
Microsoft Visio Data Visualizer Add-in for Excel
16 April 2020
The Microsoft Visio Data Visualizer add-in for Excel is a new way to create data-driven high-quality Visio flowcharts, cross-functional flowcharts and organisation(al) charts – all the shapes, connections and data linking – directly in Excel. The add-in uses Office (Visio) Online to create the visualisation. The Visio Data Visualizer add-in for Excel is now available in public Preview and will be Generally Available in the near future. You do not need license to use this add-in, however, for additional functionality, such as editing, a subscription is required.
Getting Started
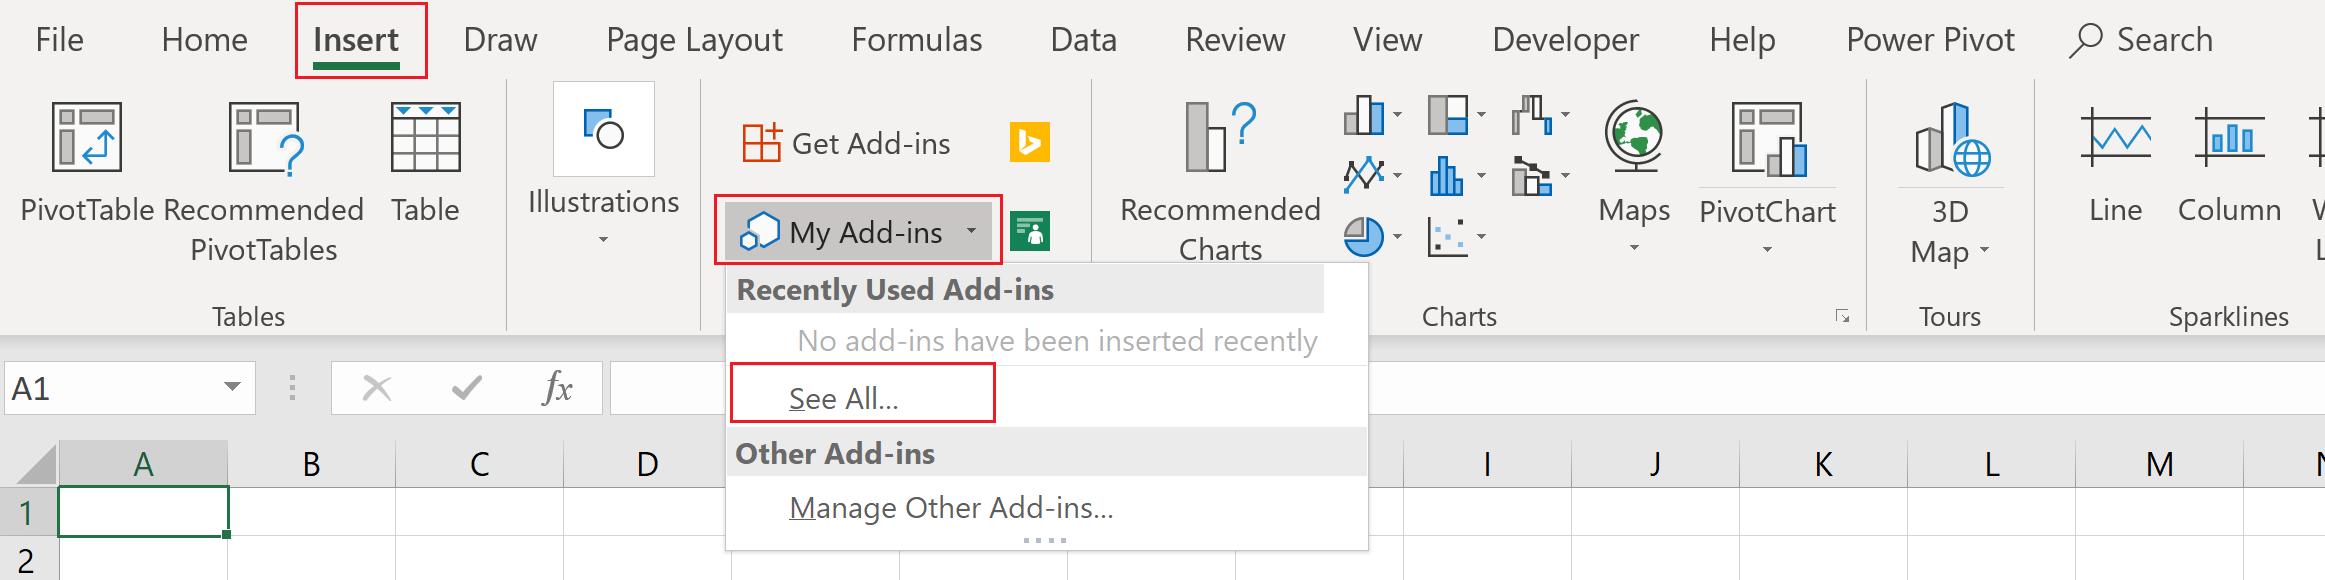
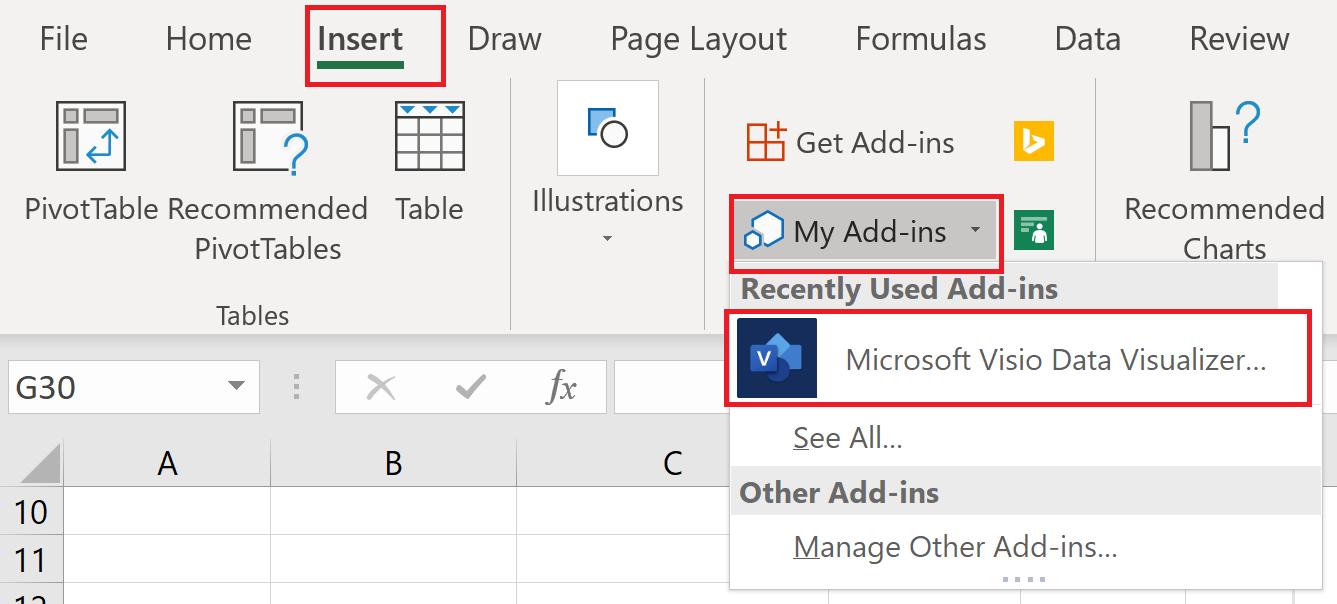
To get this add-in, it’s not on the Add-ins tab! Instead, navigate to the Insert tab on the Ribbon, and then from the ‘My Add-ins’ dropdown list, select ‘See All…’:
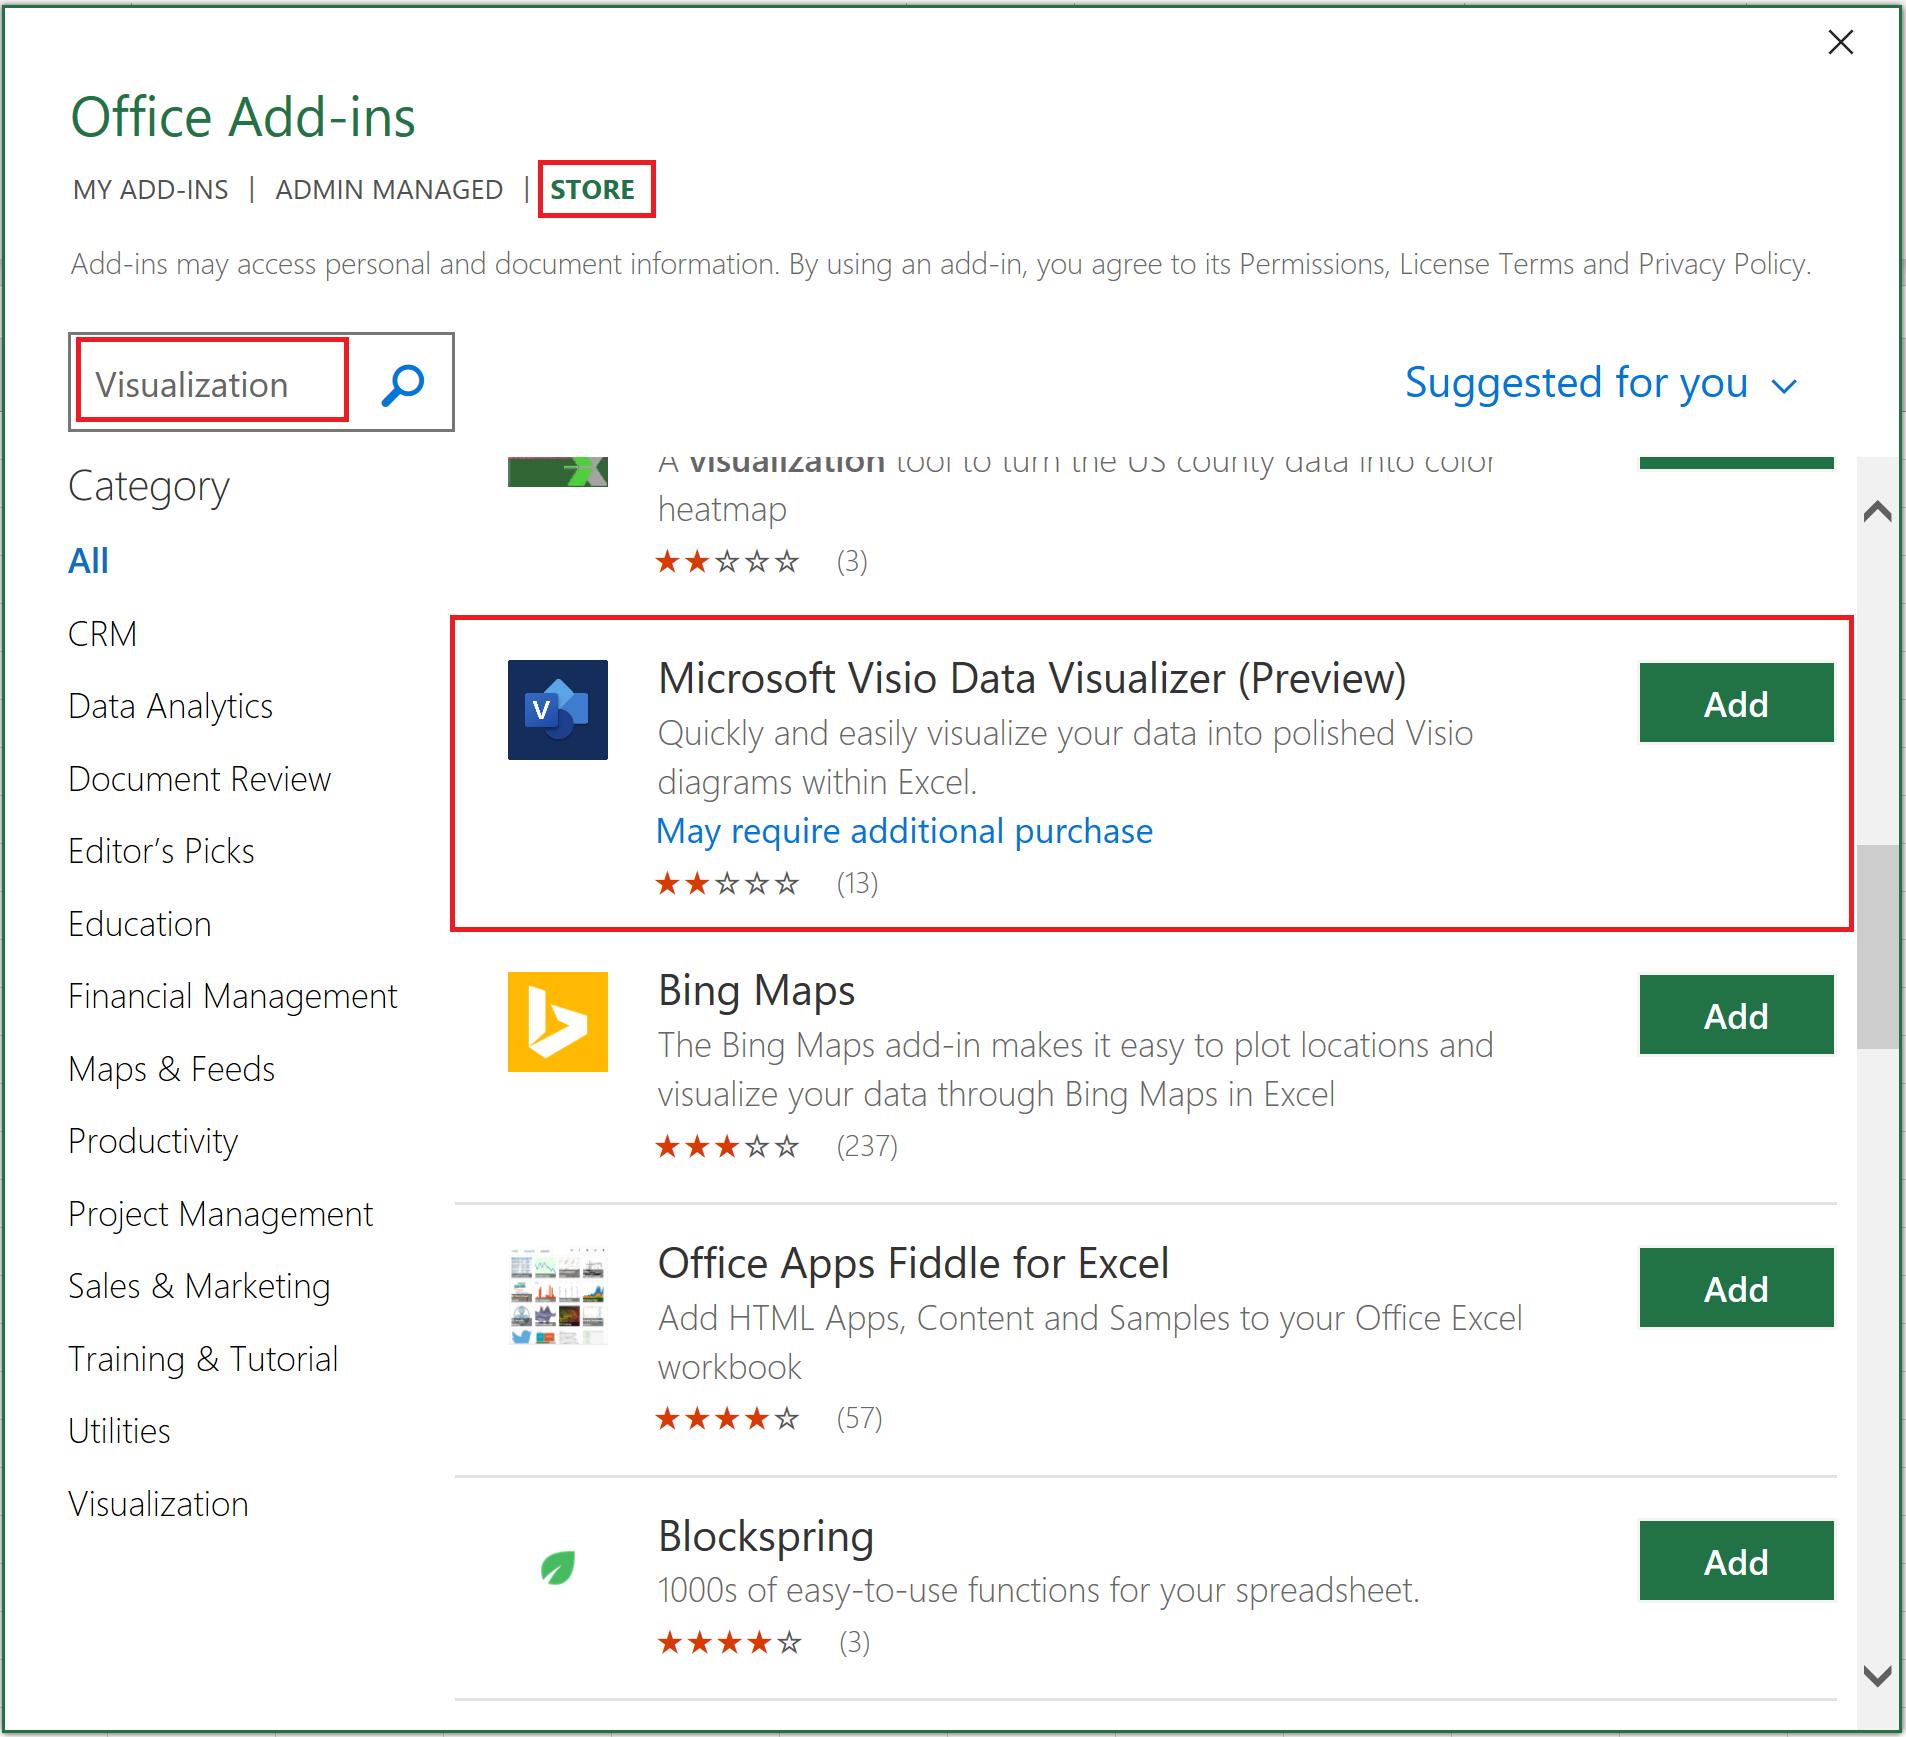
An ‘Office Add-ins’ dialog will appear. Go to the Store tab and type “Visualization” in the Search box. You should then see ‘Microsoft Visio Data Visualizer (Preview)’ from the list. Click Add to install the add-in:
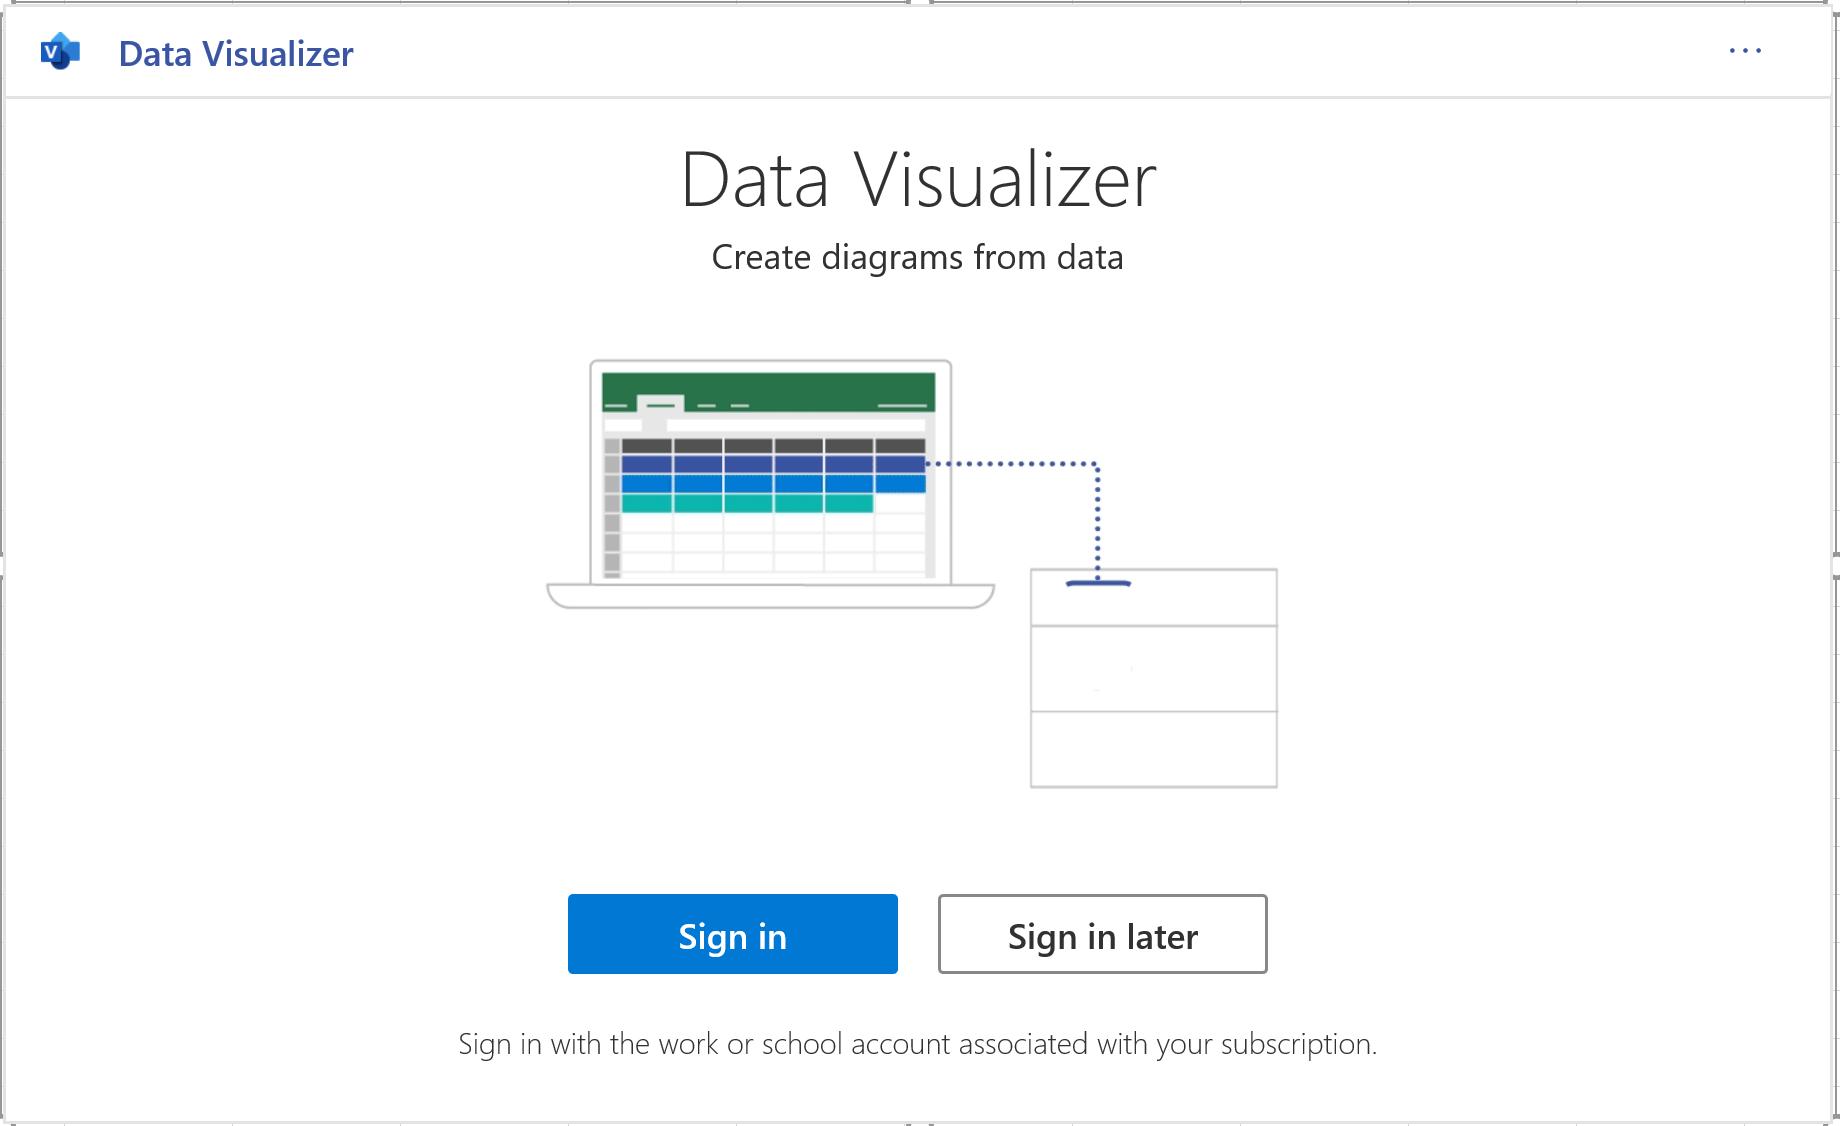
After being installed, the ‘Data Visualizer’ dialog will be displayed and prompt you to sign in. If you have a work or school account, you can sign in here, or just click ‘Sign in later’ to skip this step, because the add-in requires no license to use, although Visio subscribers benefit from additional editing capabilities.
The Data Visualizer add-in comes with three groups of data-linked samples:
- Basic Flowchart
- Cross-Functional Flowchart
- Organization Chart.
Each diagram category provides a few layout styles and theme options:
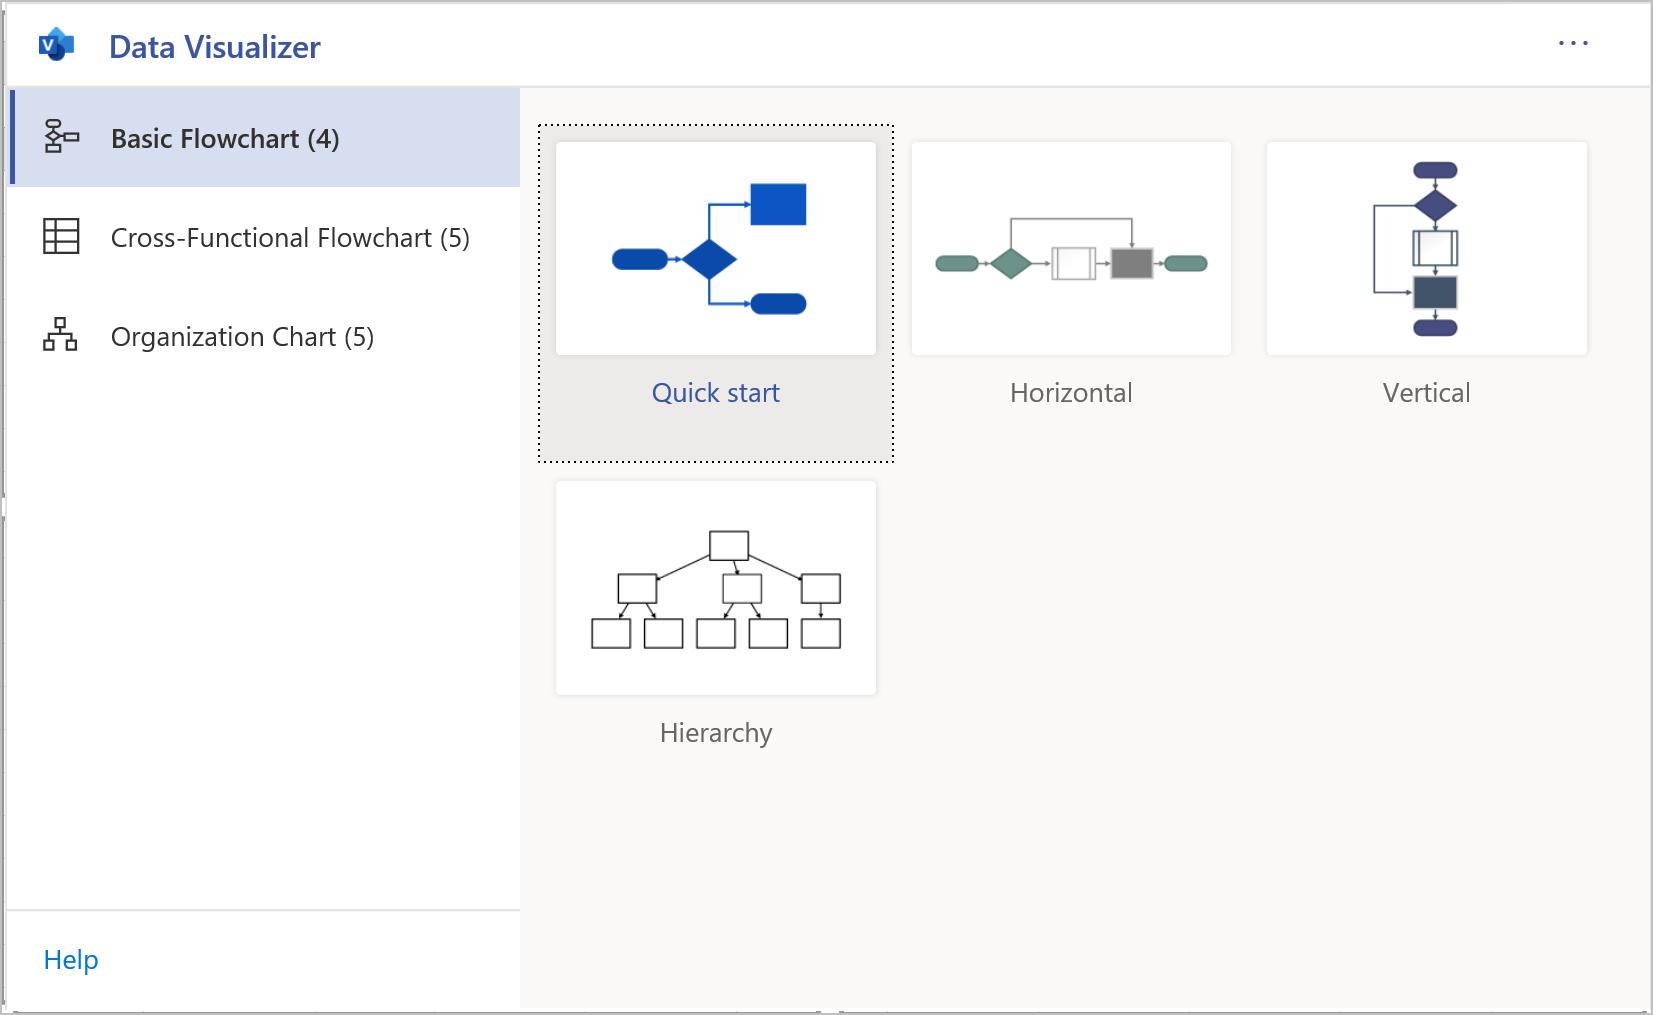
Basic Flowchart: Quick start, Horizontal, Vertical, and Hierarchy
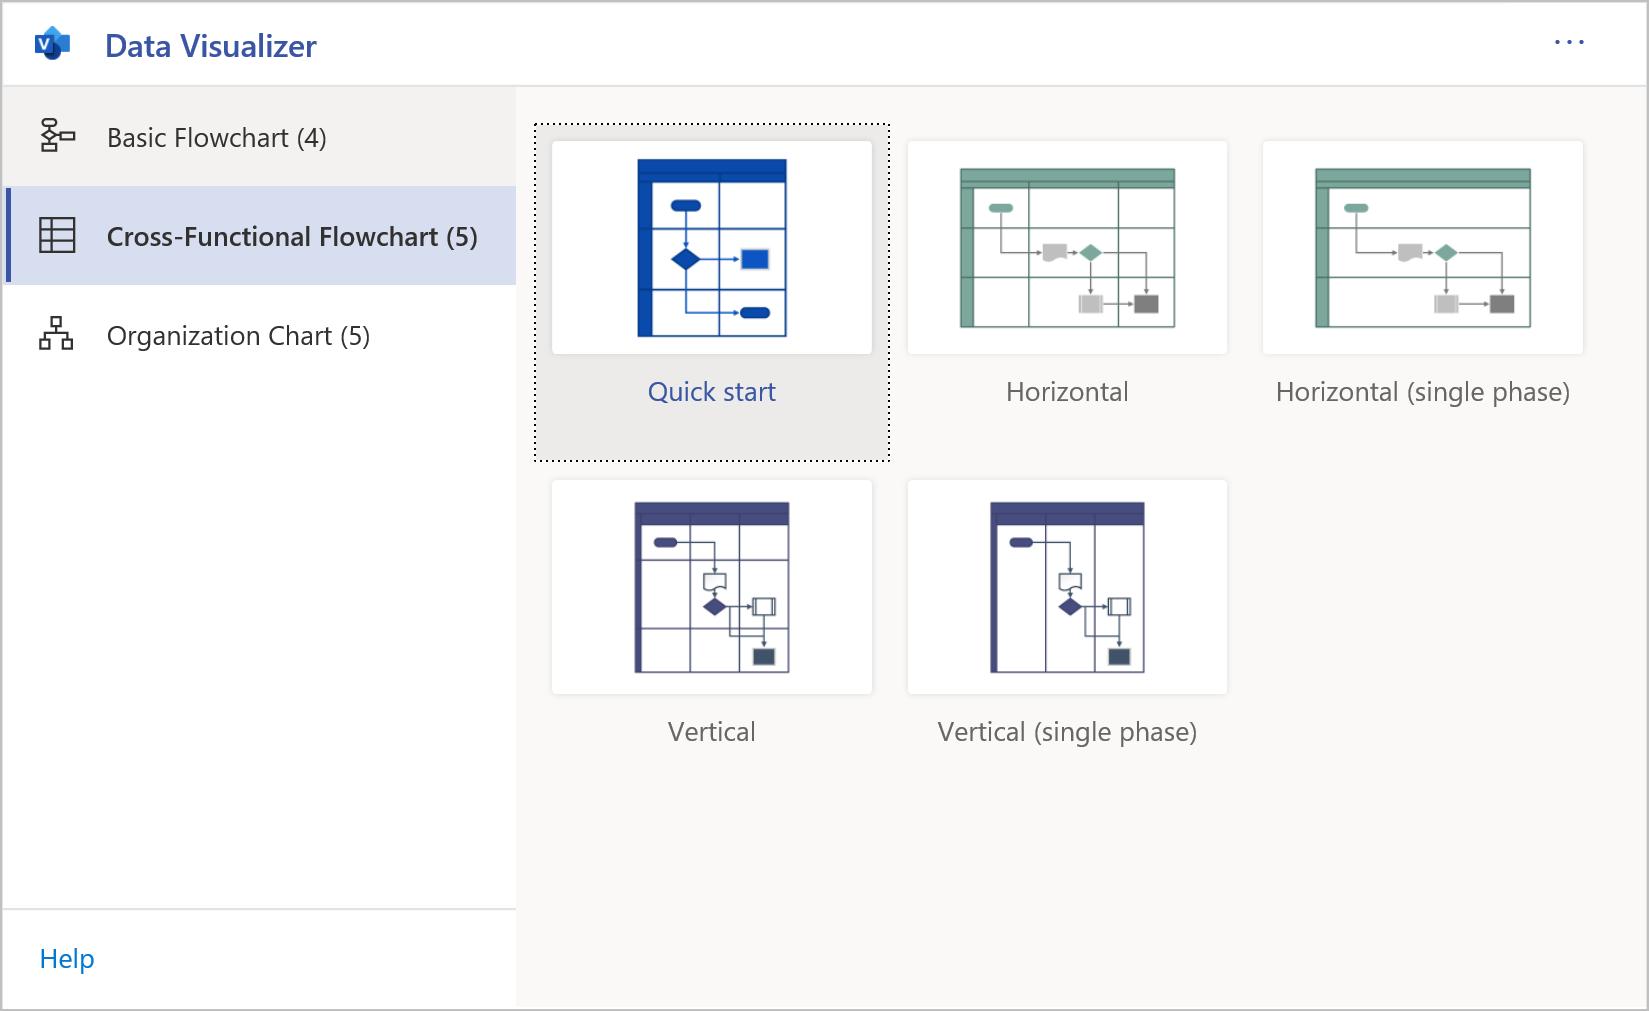
Cross-Functional Flowchart: Quick start, Horizontal, Horizontal (single phase), Vertical, and Vertical (single phase)
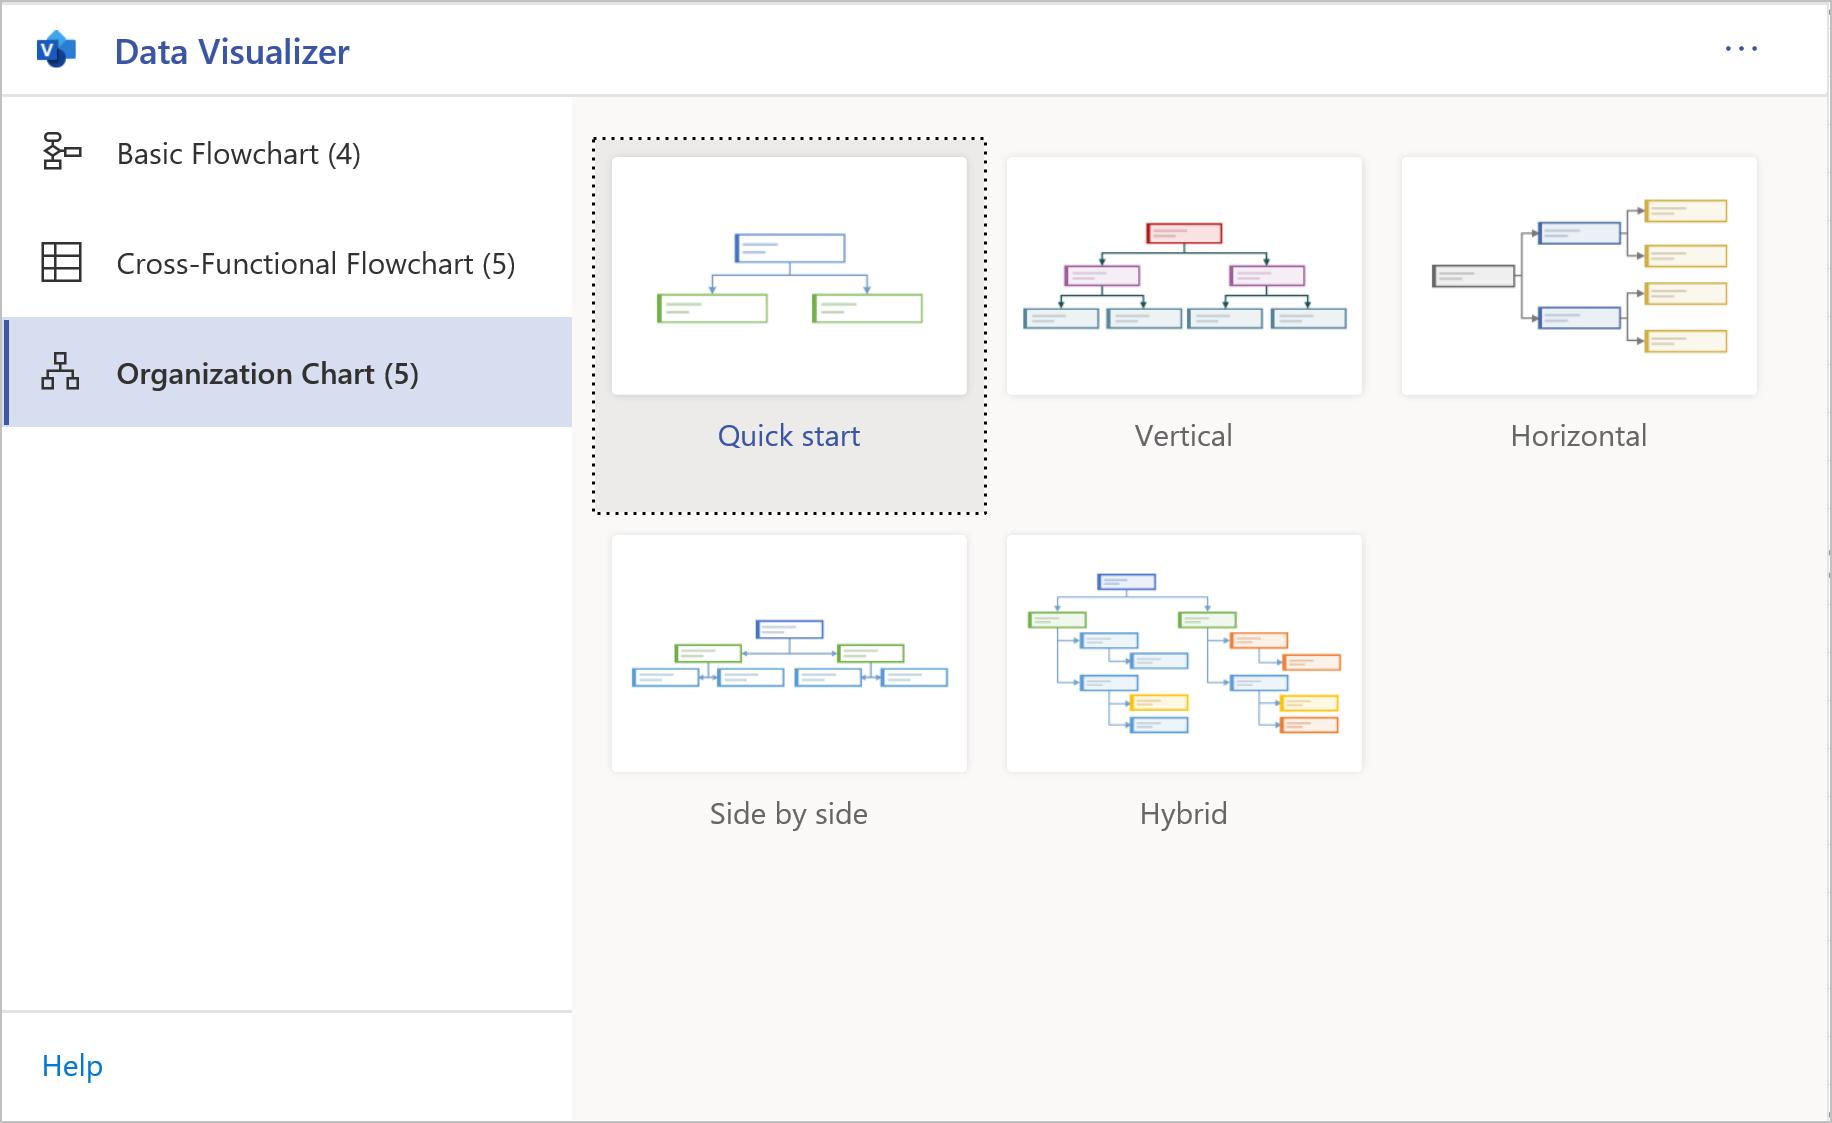
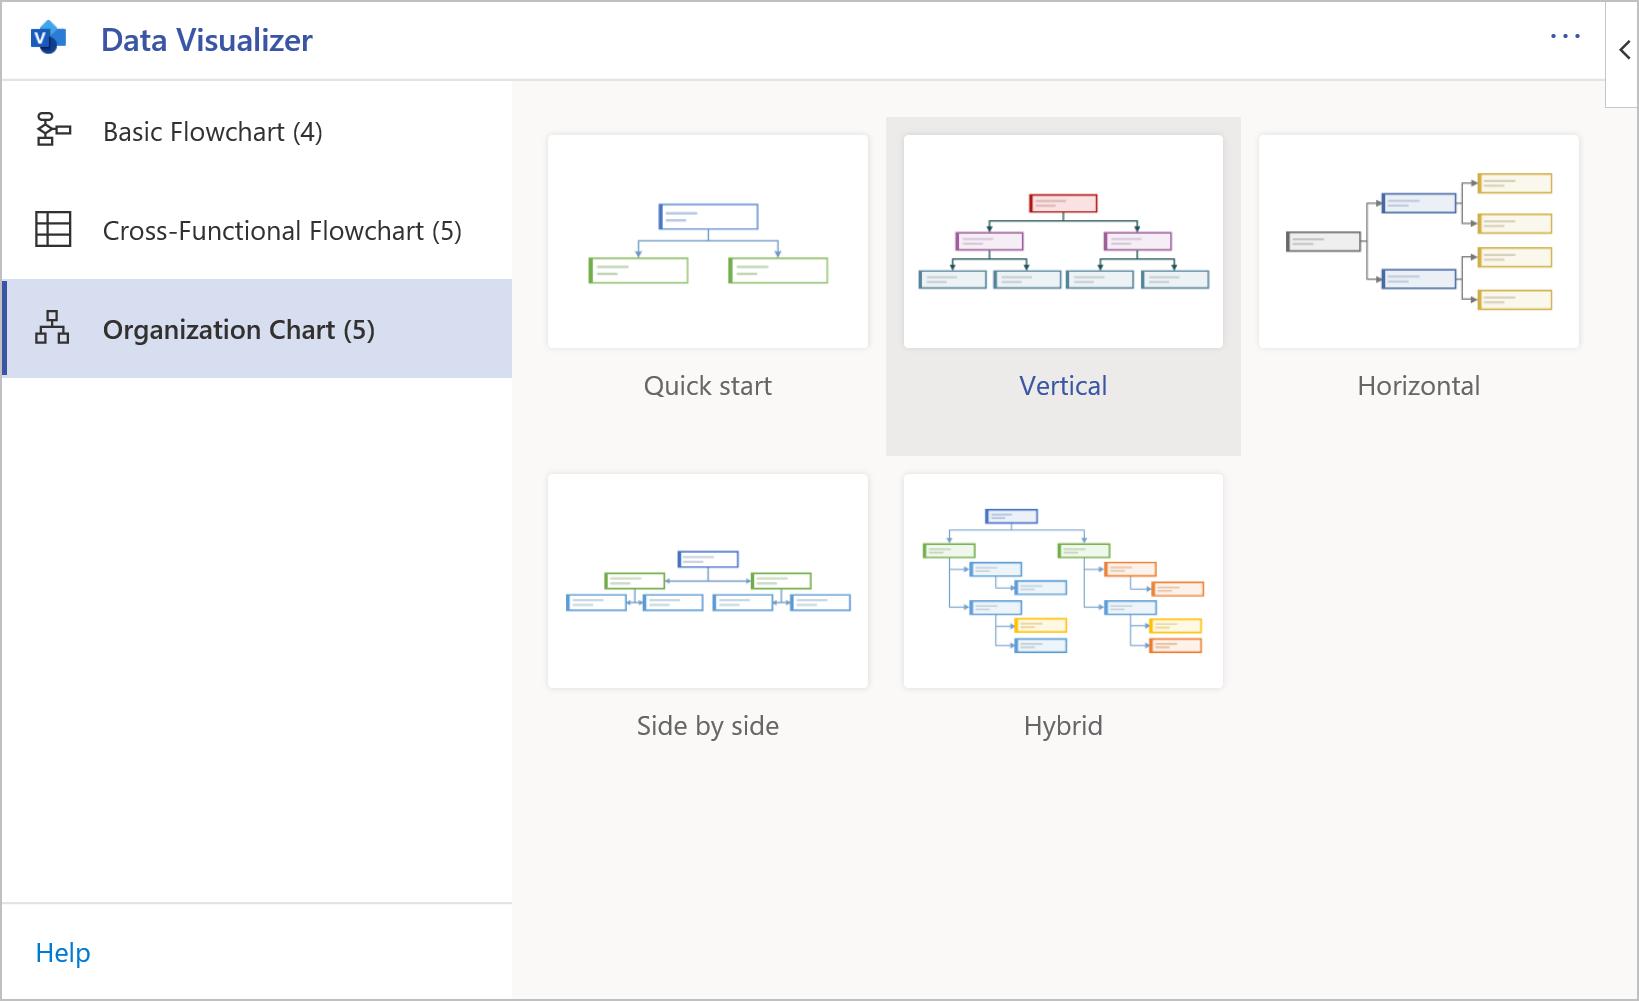
Organization Chart: Quick start, Vertical, Horizontal, Side by side, and Hybrid
To start, let’s choose the ‘Quick start’ sample from the ‘Basic Flowchart’ group. The add-in will create a sample diagram with an editable sample data table, similar to the one below:
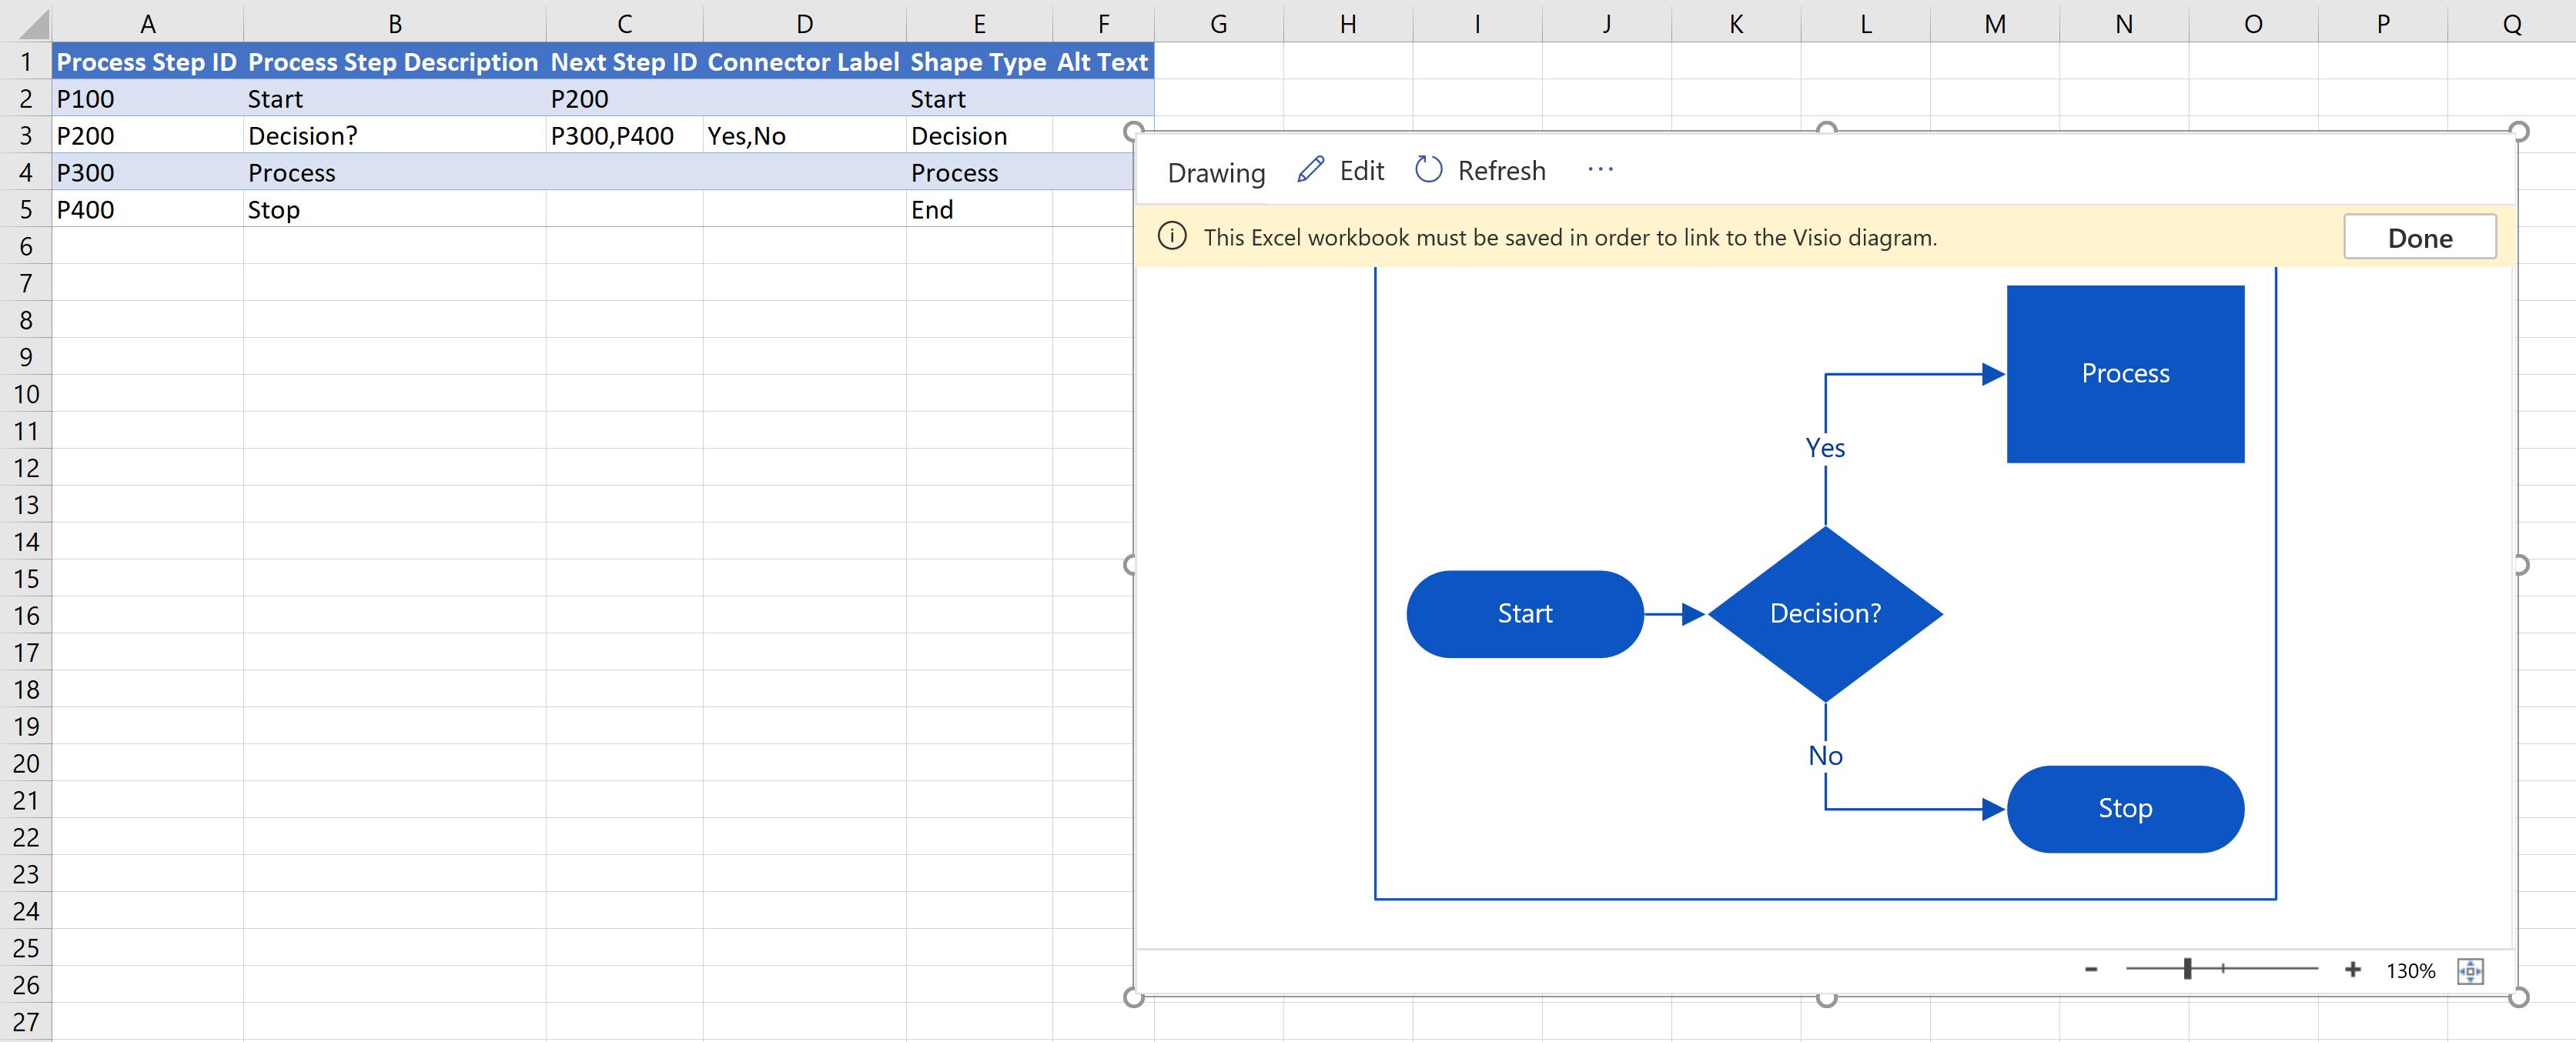
The Excel workbook must be saved in order to link to the Visio diagram, so let’s save the file and click Done. The chart can also be moved by clicking on the chart box and moving it to the desired location:
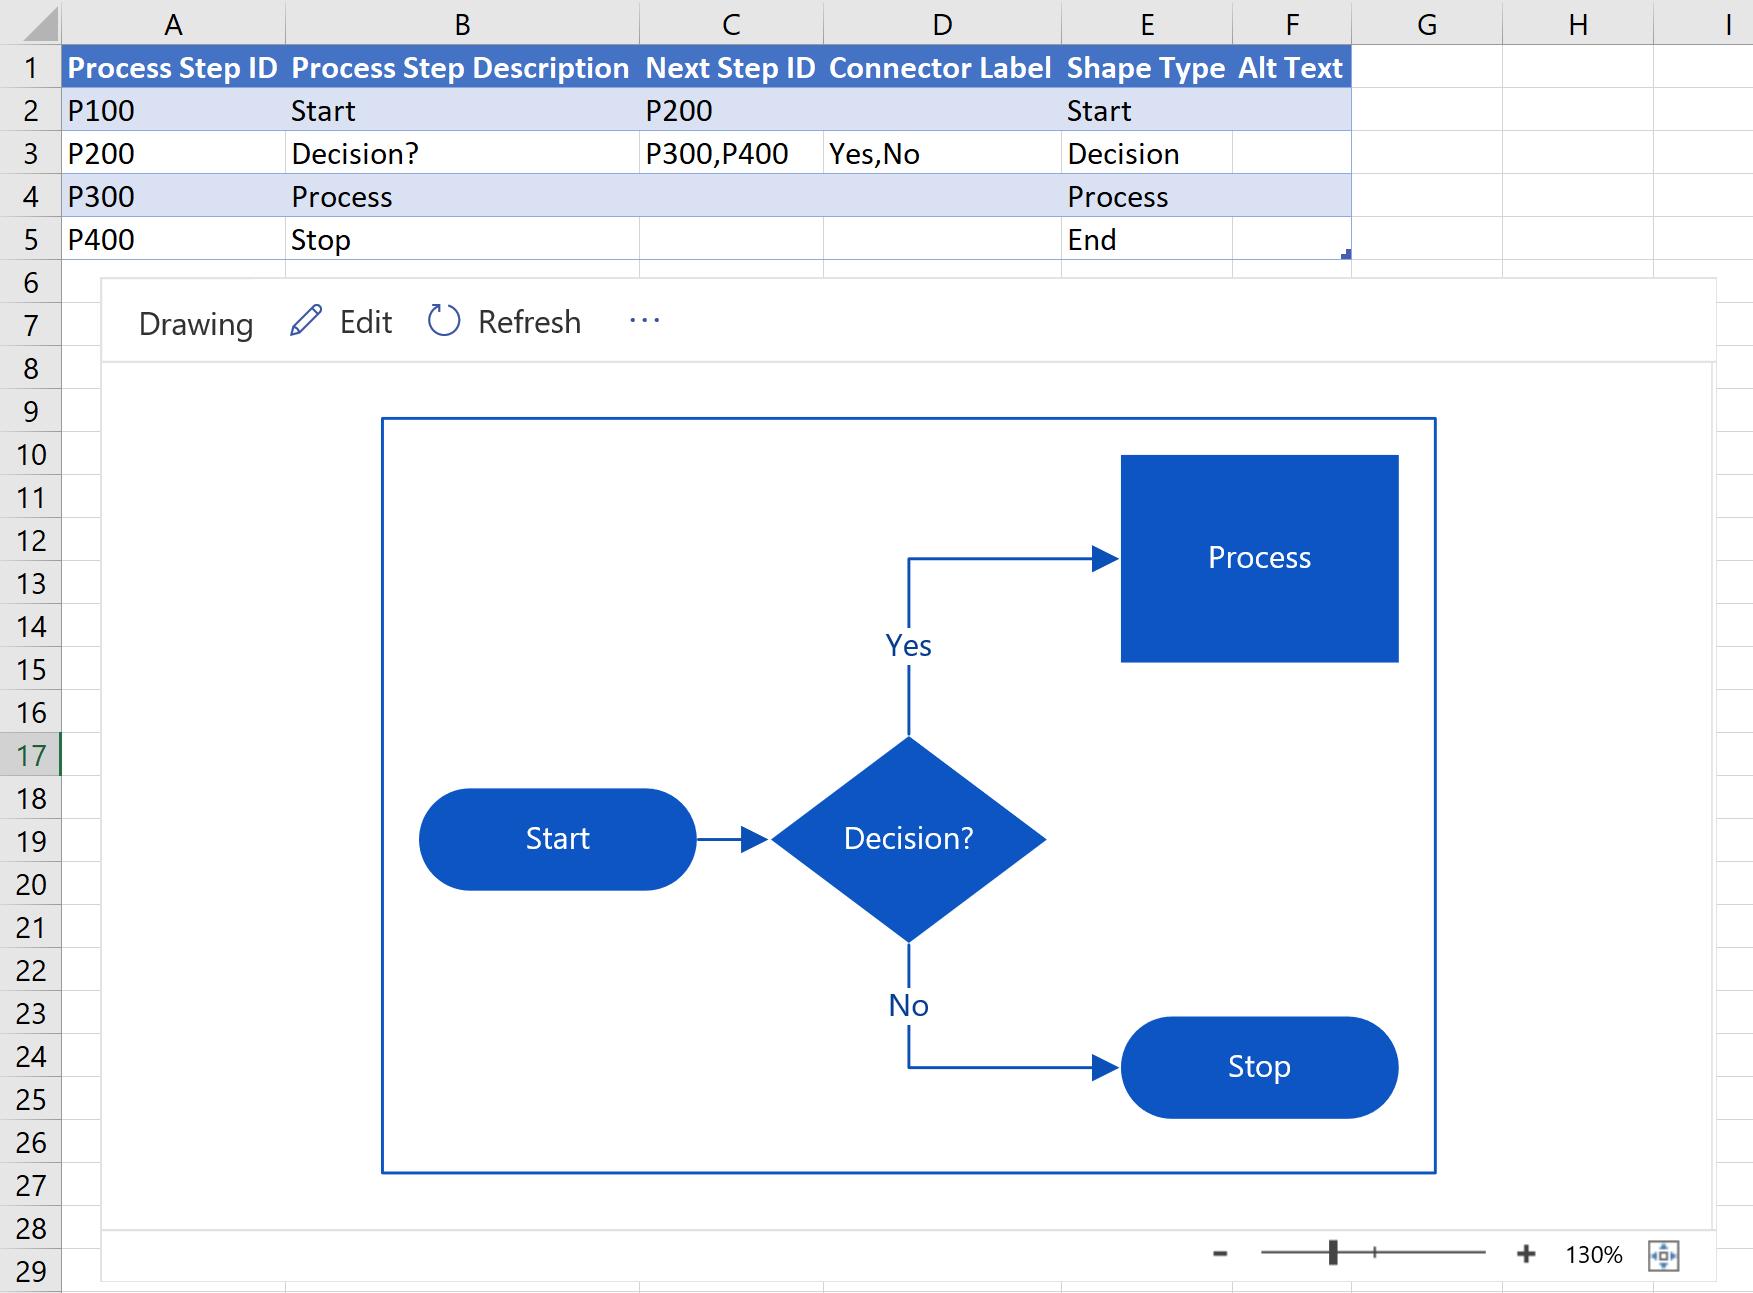
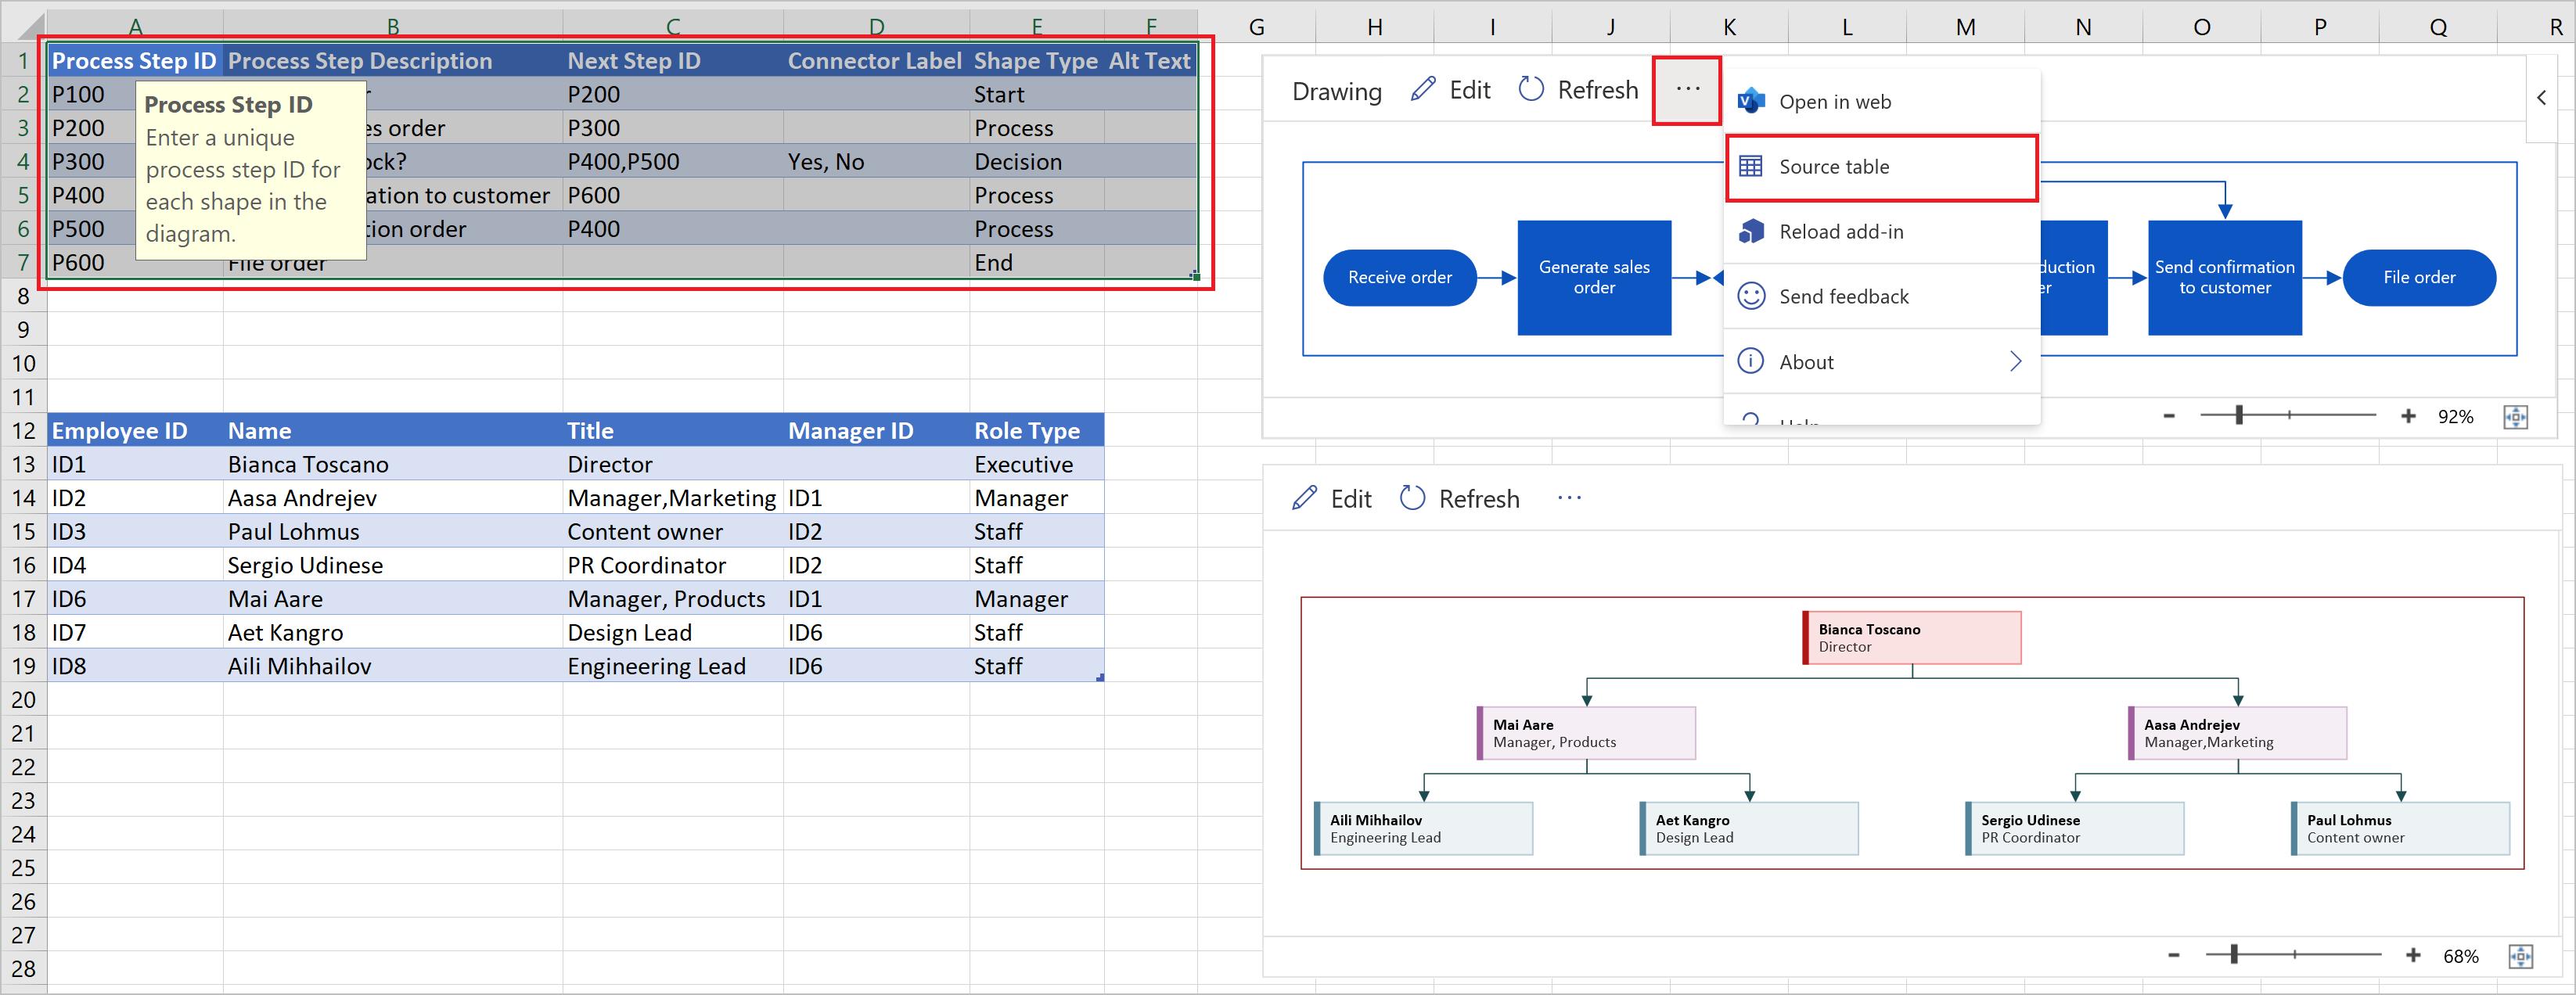
Below is a closer look at the data table, where details have been altered to create our customised flowchart. If you hover the mouse over the column headings, you will trigger ScreenTips of what should be done with the highlighted section of the data table, e.g.
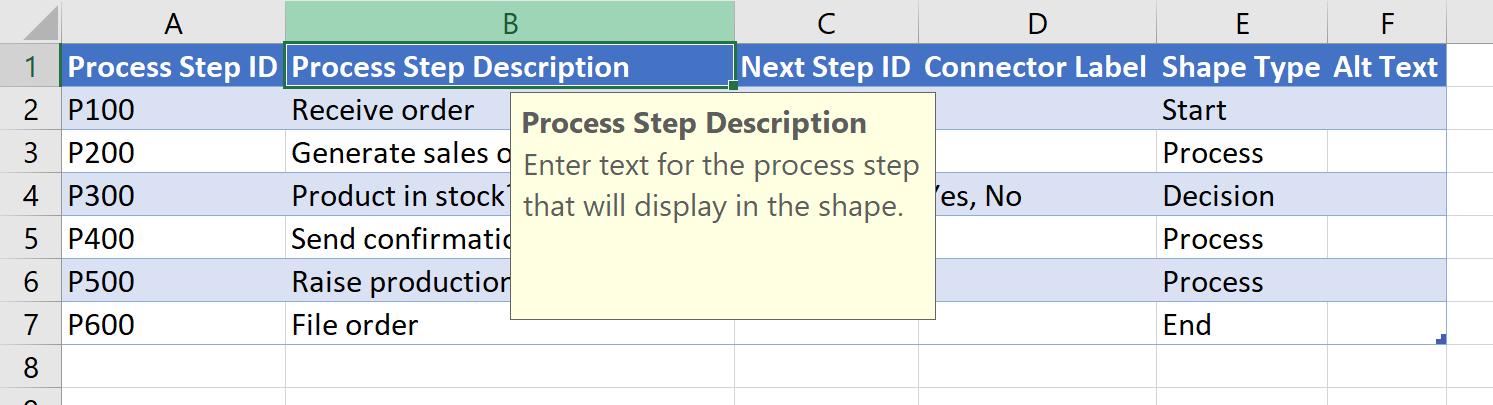
The flowchart contains six steps, each of which has an ID, caption, dependencies, connectors, shape type and alternative text. It is worth noting that particular attention should be paid to the next step ID and connector label fields. In the example below, step P300 – ‘Product in stock?’ has the next step IDs P400 and P500, together with the connector label ‘Yes,No’. This means the ‘Yes’ label is linked to step P400 and the ‘No’ label is linked to step P500.
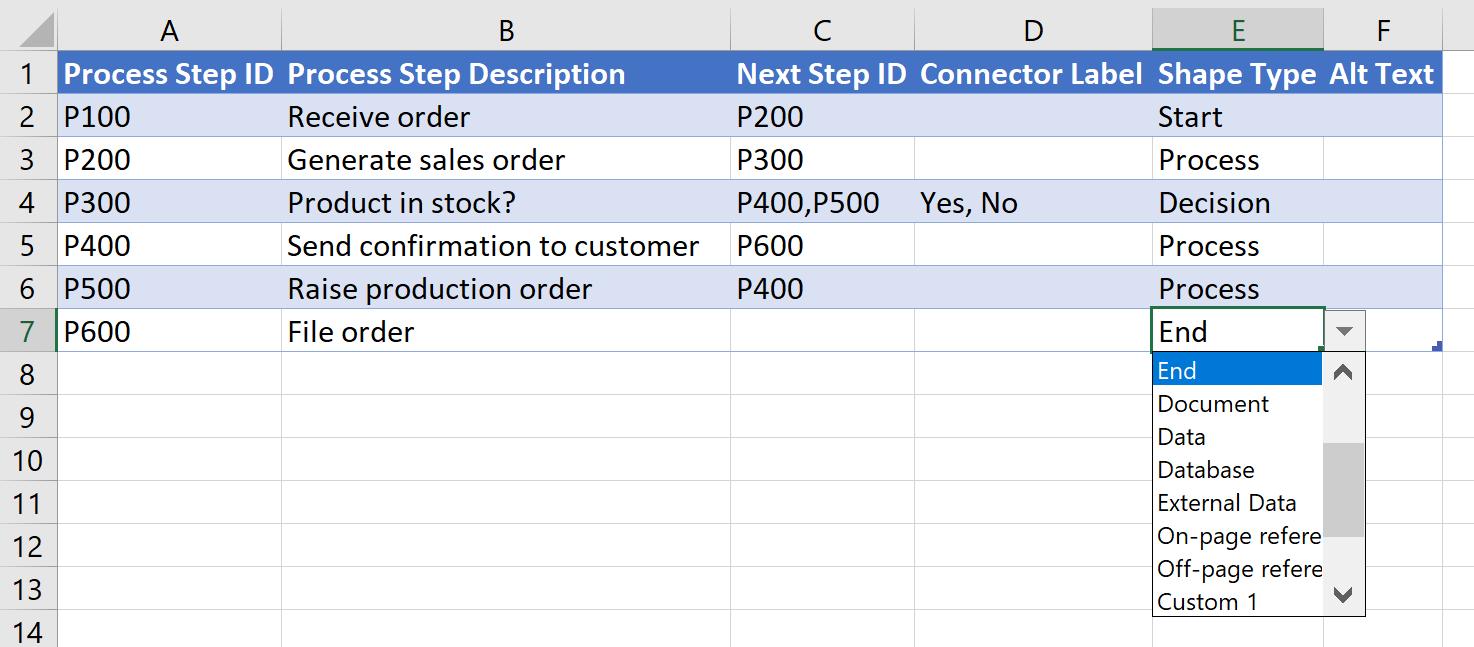
With regard to the shape type, the rounded-corner rectangle for Start/End and diamond-shaped box for Decision, for example, may be defined from the built-in cell dropdown list. There are also custom shapes to choose from, which may be customised should you have a subscription license.
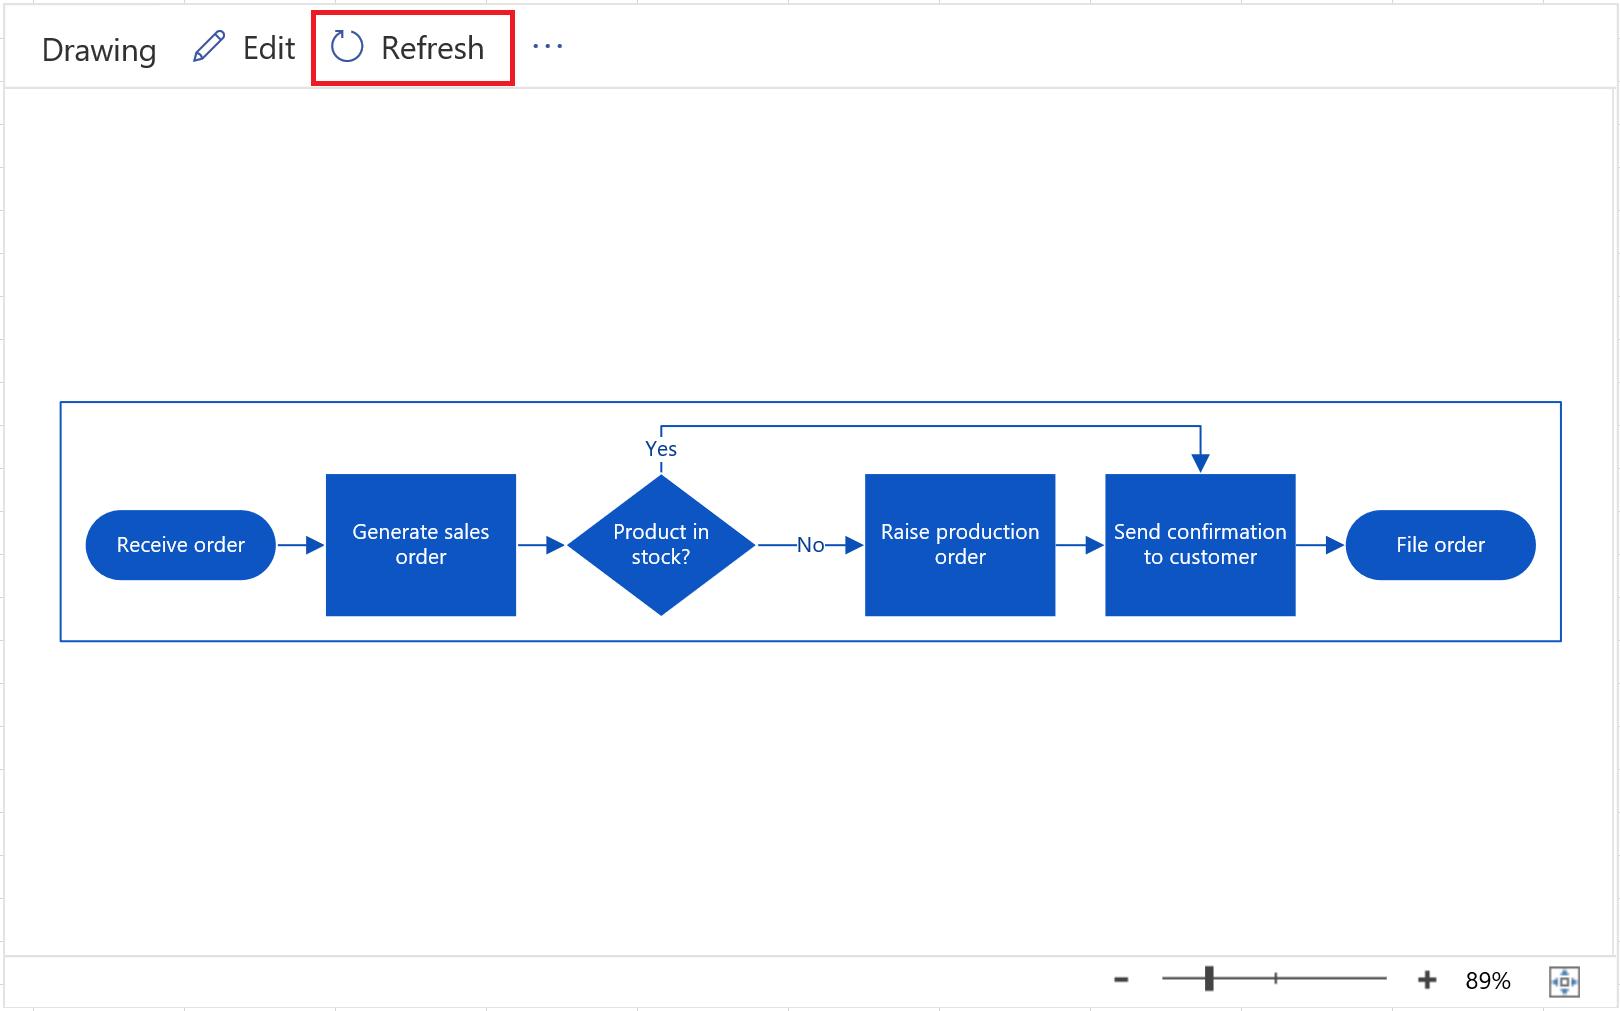
Once editing the data table has been completed, go to the chart box and click Refresh. The flowchart is now created:
If you want to create another flowchart, you simply need to go back to Insert tab on the Ribbon and choose ‘My Add-ins’ –> ‘Microsoft Visio Data Visualizer…’ since this has now been installed:
The category dialog appears, so this time let’s create a Vertical organisation chart:
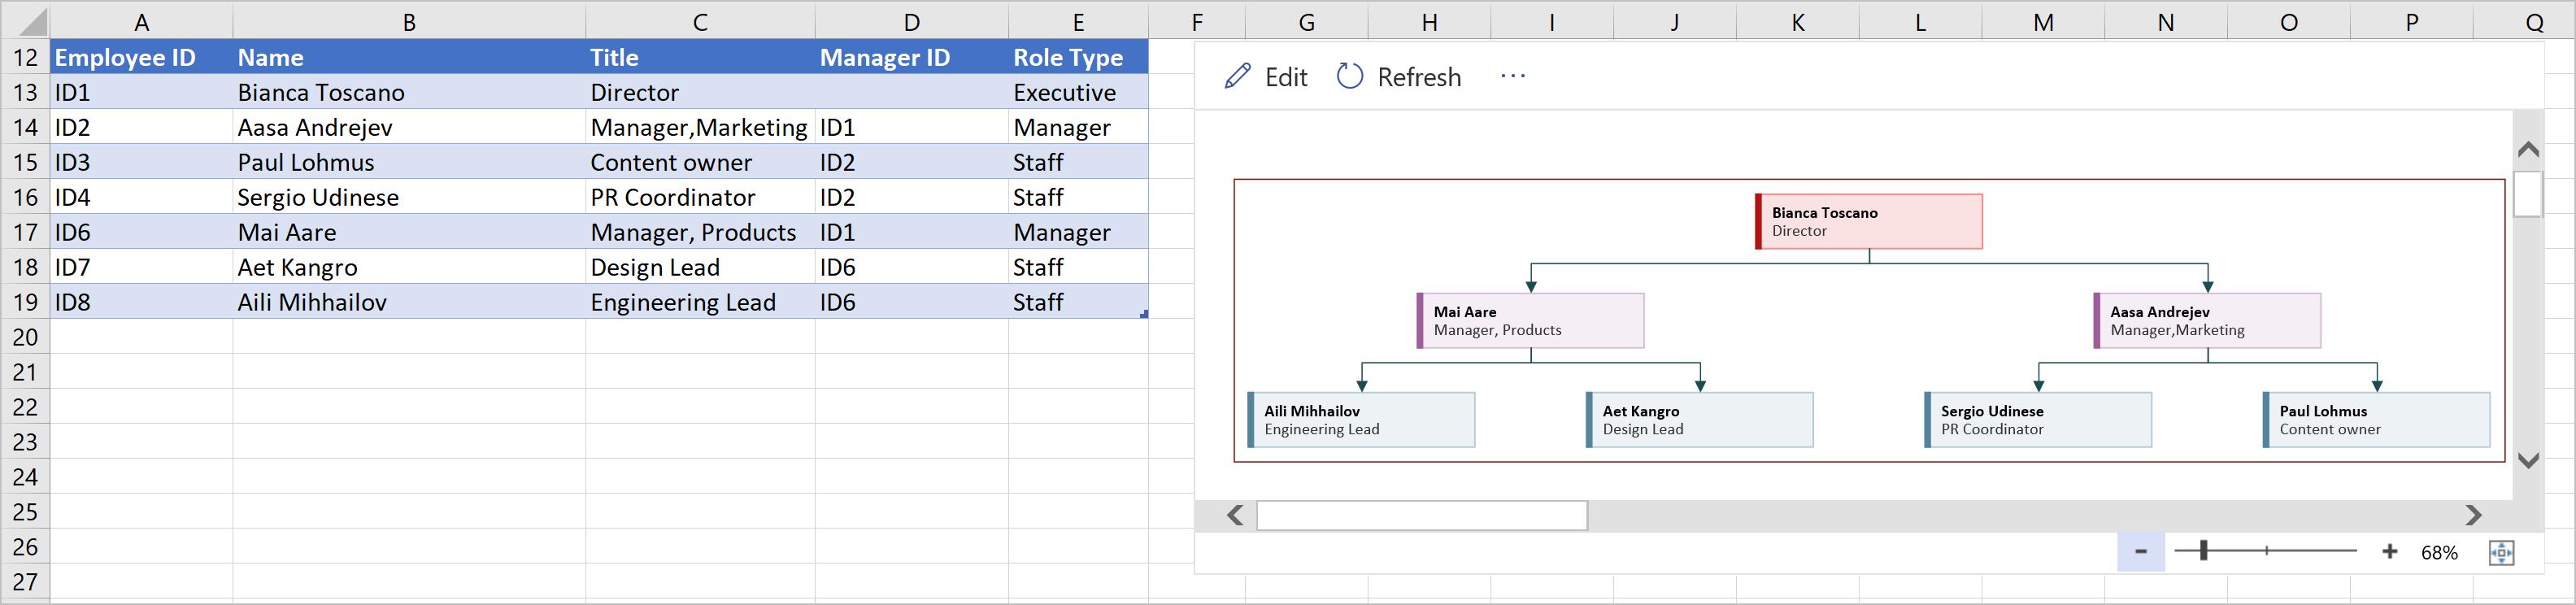
Similarly, the new sample data table and diagram are displayed, where you can change data and refresh the chart box to create the organisation hierarchy:
More Actions with Your Diagrams
In an Excel sheet with more than one flowchart, to identify the data table linked to the chart, click the ellipses in the chart box and choose ‘Source table’. This will cause the linked data table to be highlighted:
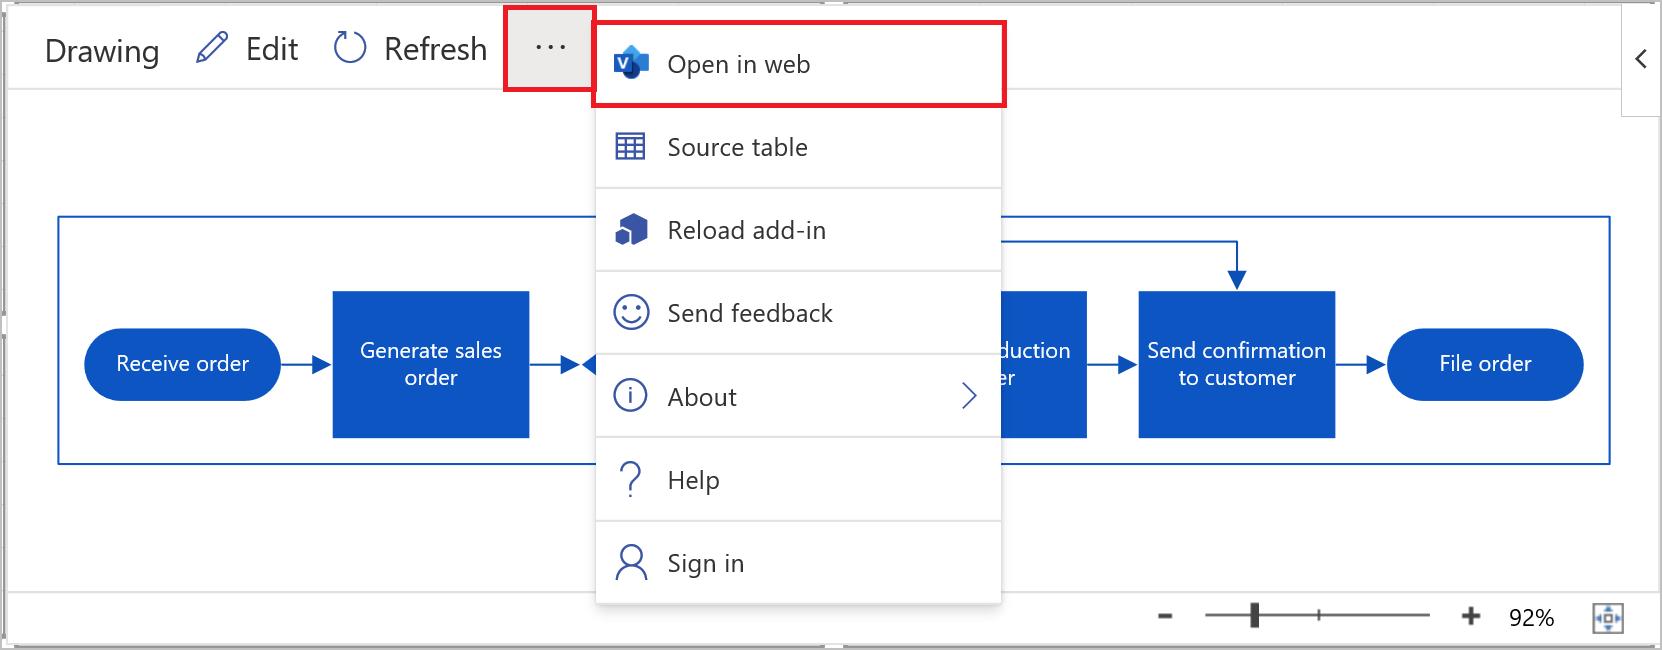
Also, if you are signed in, your Visio diagrams are created as online files and saved in OneDrive or SharePoint by default, so you may view, print and share them with other Office 365 users. To open the diagram in Visio for the web, from the ellipses, choose ‘Open in web’:
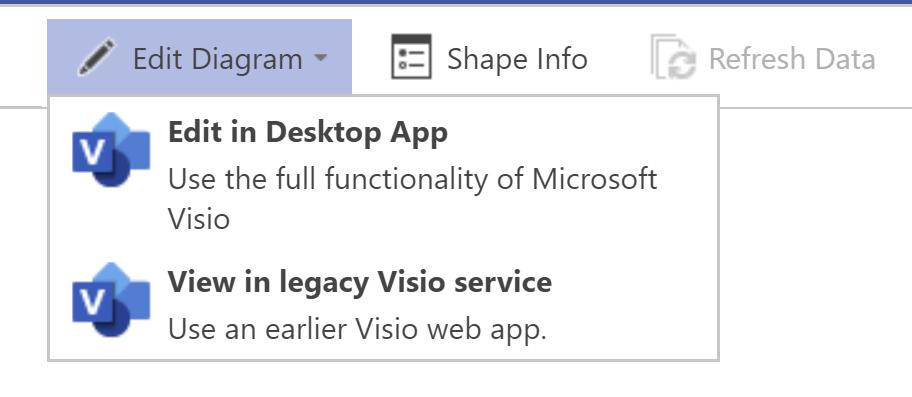
You will be navigated to Visio on the web in your browser, where you can view your flowchart. Options for more actions with the diagram may be found in the top right-hand corner:
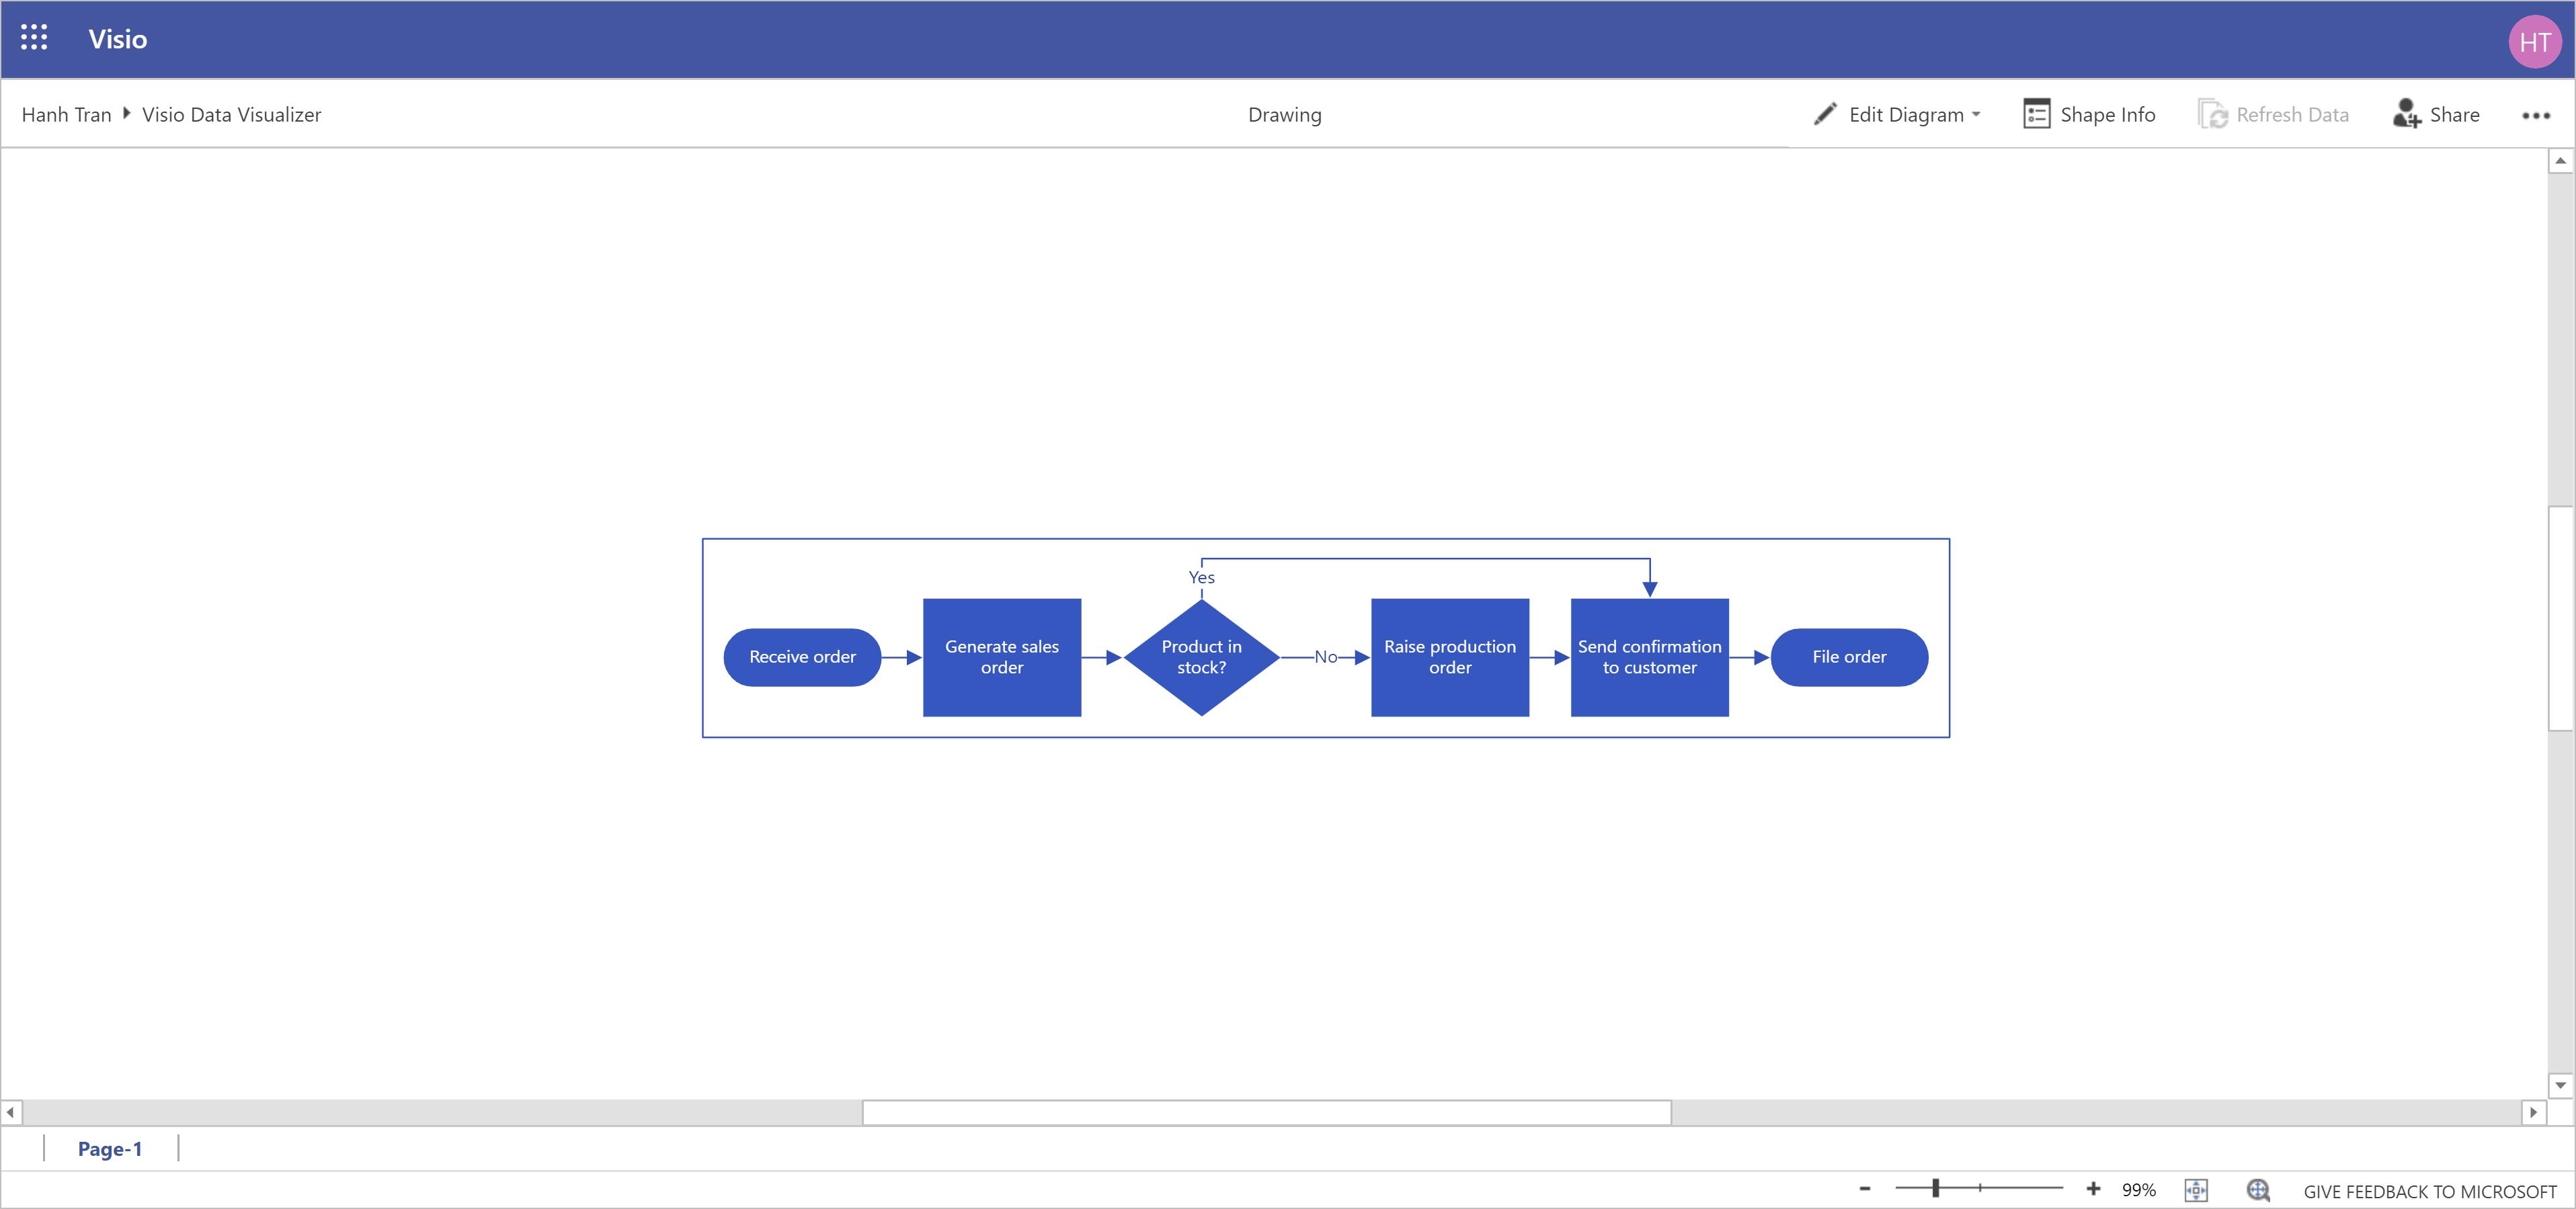
Editing the diagram, such as adding text or images, applying design themes or making other customisation modifications, requires a license.
Clicking the Share button allows you to share this file with other team members or any Office 365 users:

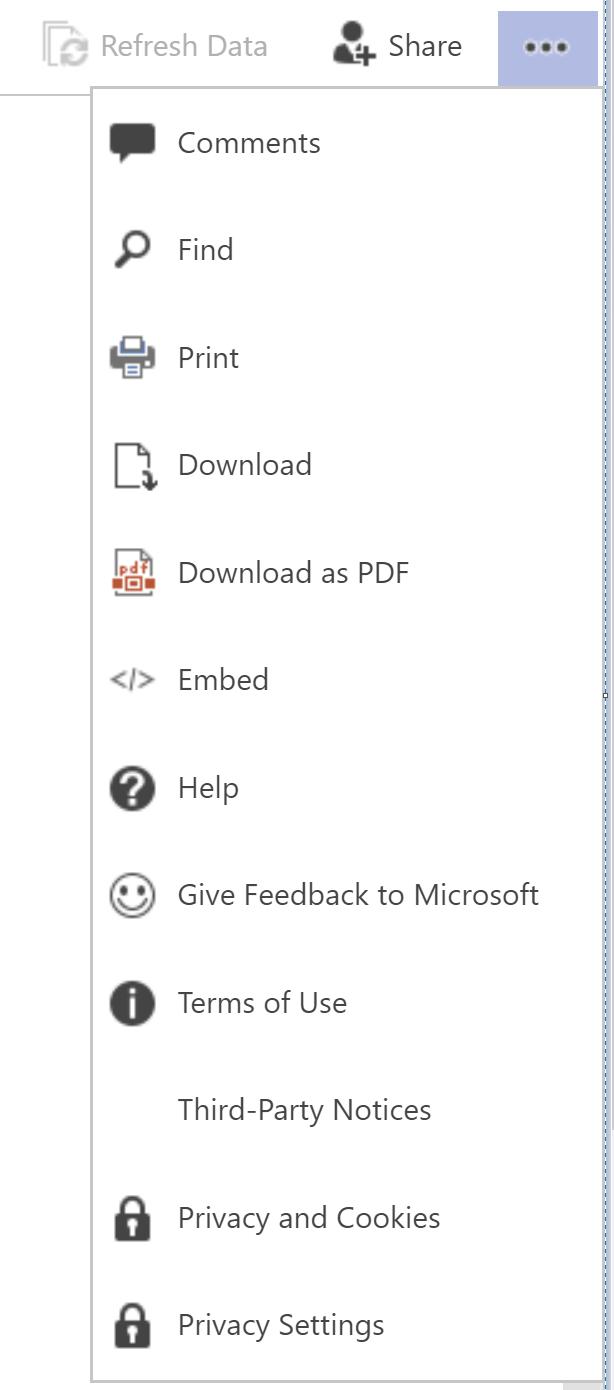
From the far most right-hand corner ellipse, you have options to add comments, print or download the diagram:
In short, this add-in makes it much straightforward for Excel users to create hierarchy type process maps and flowcharts. From the samples discussed above (but not limited to them), this add-in can be utilised to draw other creative charts, such as decision trees, activity diagrams or conditional probabilities modelling.