May 2019 Updates for Power BI Desktop
18 May 2019
On top of incremental improvements for several of the recently released features, such as the key influencers visual and the new Filter pane, the May update also sees a new ‘Performance Analyzer’ pane. This new pane lets you get a behind the scenes view of what’s happening when your report is loading, which can help you optimise your report and improve the end user experience.
The full list of updates for May are as follows:
Reporting
- ‘Performance Analyzer’ pane
- Filter pane improvements (Preview)
- Sorting filter cards
- Theming support
- Table and matrix keyboard navigation
- Line data label position control
- KPI visual indicator text size control
Analytics
- Key influencers visual improvements (Preview)
- Binning support
- Formatting options
- Mobile support
Modelling
- Disable auto-date tables for new reports
- Update to the ALLSELECTED DAX function
Visualisations
- ArcGIS maps for Power BI updates
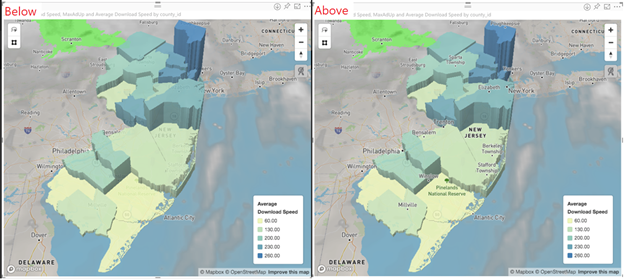
- Mapbox updates
- ValQ – Modern Digital Planning
- Advanced Graph Visual
- Craydec Control Chart
- Walkers Animated Pictogram
- Treemap Bar Chart by MAQ Software
Data Connectivity
- Essbase connector: Support for Native Query (MDX)
- Intune Data Warehouse connector
- Tenforce connector
- Roamler connector
Other
- Automatic query cancellation for Power BI Desktop.
As always, we'll be detailing these updates in our next (June) newsletter. Please remember we have training in Power BI which you can find out more about here. If you are not already a subscriber, why not sign up at the bottom of any SumProduct web page? And don't forget to download the latest version of Power BI Desktop here too.