January 2018 Updates for Power BI Desktop
19 January 2018
Microsoft’s updates continue unabated with another splurge of reporting, analytical, visualisation and connectivity tools. You really do need to keep this free software up to date.
In summary, here's the latest additions:
Reporting
- Show and hide pages
- Control data label background color for Cartesian and maps visuals
- Increase area used for axis labels in charts
- Bar / column padding control
- Show dates as a hierarchy (Preview)
- Add an anchor date for relative date slicer
- Top N selection in Q&A
Analytics
- Correlation coefficient quick measure
Custom visuals
- PowerApps
- TreeViz
- Funnel with Source by MAQ Software
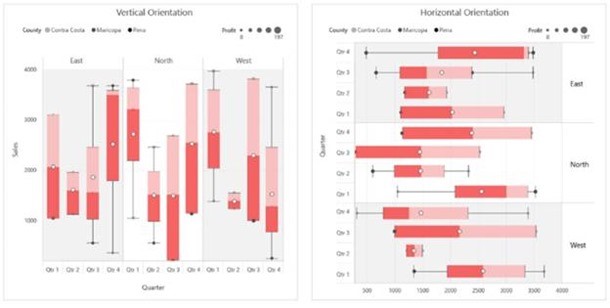
- Box and Whisker chart by MAQ Software
- Agility Planning Matrix Light
- Image Grid
- Gantt Chart by MAQ Software
Data connectivity
- Support for Azure Active Directory authentication for Azure SQL Database & Data Warehouse connectors
Other
- Advanced language settings for the Windows store app.
As always, we'll be detailing these updates in our February newsletter. Please remember we have training in Power BI which you can find out more about here. If you are not already a subscriber, why not sign up at the bottom of any SumProduct web page? And don't forget to download the latest version of Power BI Desktop here too.