
Blog


Monday Morning Mulling – June 2021
28 June 2021

Final Friday Fix – June 2021
25 June 2021
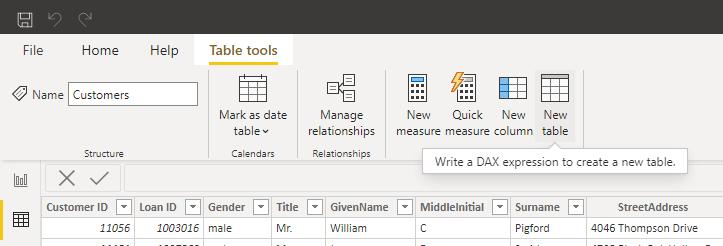
Power BI Blog: CALENDAR tables
24 June 2021

Power Query: Evaluate the Environment
23 June 2021


A to Z of Excel Functions: The ISNUMBER Function
21 June 2021
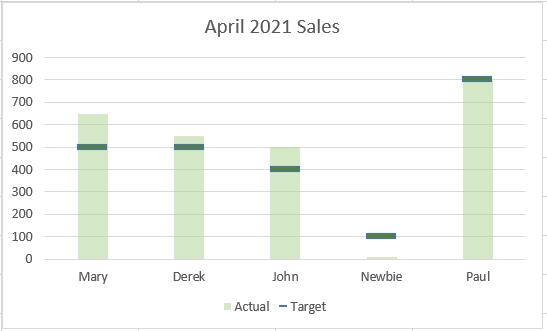
Charts and Dashboards: More Target Practice
18 June 2021
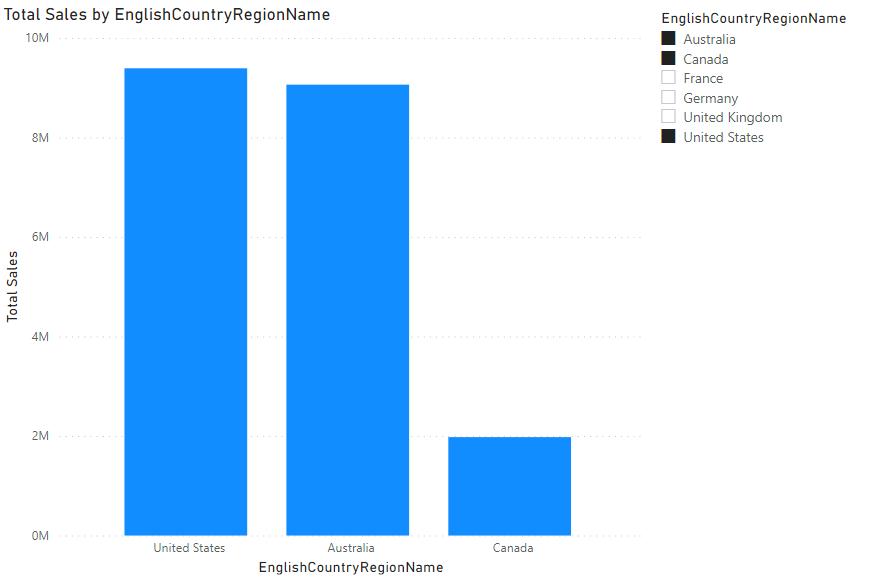
Power BI Blog: Dynamic Headers
17 June 2021
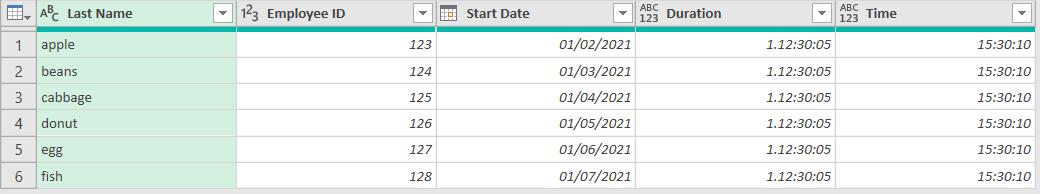
Power Query: Fixed Expression
16 June 2021