
VBA Blogs: Charts and Macros 3
15 March 2019
Welcome back to this week’s VBA blog! This month, we’re going to look at the interaction between charts and macros.
As we mentioned previously, this month we’re going to look at the thought process around creating a macro that would help us to identify a chart’s details and present the results to a user. We effectively need to go through the following steps:
- Define the target / output file, save target details
- Determine the series details and loop through to extract them
- Extract out the relevant name / y-axis / x-axis / bubble size from the formula and clean up
This week, we’re covering the second step in that list.
There are several loops that we need to run through to make this macro work:
- We need to look through each sheet (variable: “sh”)
- We need to find each chart in each sheet (variable: “ch”)
- We need to find the details of each data series in each chart in each sheet (variable: “srs”)
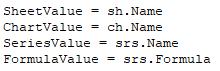
So for each series, we will want to record the sheet name, the chart name, what series it is, and the formula that is used to get the data for that series.
Now, for the purposes of our macro and recording the results, if the data series is blank, for example, then we don’t want the macro to record a completely blank cell as it breaks the way that our Named Ranges work to determine how many rows there are. So, we can replace any blanks with a single space, and record our results.
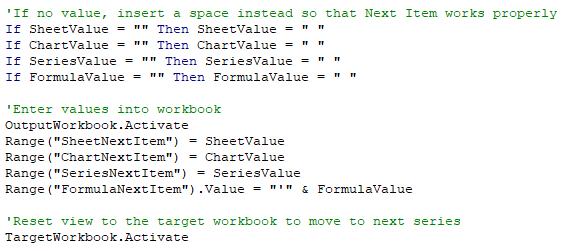
Then, once the values are recorded, we can switch to the new workbook, set the values in place in the appropriate positions based on the named range rules, then go back to the target workbook to look at the next data series and the next chart.
Once the loops are put in place, the whole code looks like this:

So essentially, we are selecting a sheet, then selecting the first chart object in that sheet, then going through all of the data series to determine what the details are. Then, once we’ve finished that chart, we can move on to the next chart, and once we run out, we can move to the next sheet.
One thing to note – SeriesCollection.Formula does not work with the new Excel 2016 chart types. That’s why in our final code, we have an error trap to check for that.
We’re almost done now! The last step is to clean up the output page and work out all of the moving parts in the data series. We’ll wrap that up next week. See you then!