
VBA Blogs: Charts and Macros 2
8 March 2019
Welcome back to this week’s VBA blog! This month, we’re going to look at the interaction between charts and macros.
As we mentioned previously, this month we’re going to look at the thought process around creating a macro that would help us to identify a chart’s details and present the results to a user. We effectively need to go through the following steps:
- Define the target / output file, save target details
- Determine the series details and loop through to extract them
- Extract out the relevant name / y-axis / x-axis / bubble size from the formula and clean up
We’ll cover each of those steps each week.
Firstly, we need to define what file contains the charts, and where we want to store the results. For the macro to work properly, we don’t want to modify the base file (which we can’t do in a model audit), so we’re going to create a new workbook to store the results.
We can use the command:
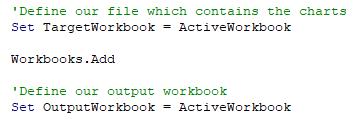
ActiveWorkbook refers to the Excel file that is currently active (i.e. the one that Excel is focused on, and will be performing actions to). Presuming that we are running this macro when we are looking at the workbook we have sheets on, we can set the first variable, TargetWorkbook to be that file.
Then, Workbooks.Add will create a new, blank Excel file that we can define as our OutputWorkbook.
Defining the Excel files will allow us to use OutputWorkbook.Activate and TargetWorkbook.Activate to switch between our files, as we will need to look at the Target to find chart information, and swap back to the Output to store the result.
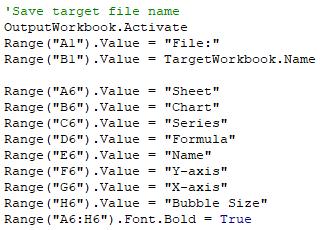
Then, all we need is to identify the details that we want to store in the output, and set up the headings we need to get the output file ready to take inputs.
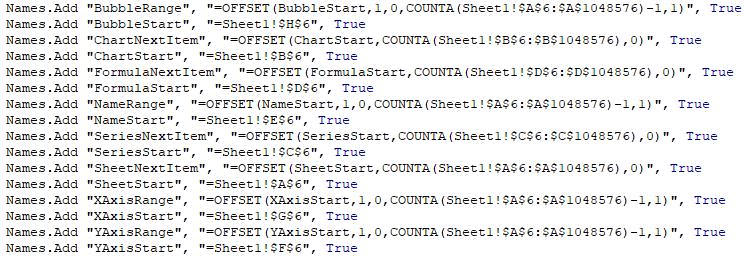
We’re then going to do one more thing – create named ranges that we can use to define where our outputs start, and consider how many rows are included.
That’s about it for now – this first step has identified the workbooks, and has set up the output page to start taking details. Next week, we’ll show you the code that goes back to our target workbook and starts looping through to find all the charts. We’ll see you then!