
Same-Sex Marriage Results - A Data Driven Analysis
17 November 2017
It’s been a big week in Australian politics, as the results of a voluntary postal survey have come back suggesting that Australians overall are in favour of legalising same sex marriage. Now, while that’s all very well and good for our LGBT friends, and not so good for our deeply religious friends, we thought we’d do a dive into the data and see if there were any interesting facts that arose.
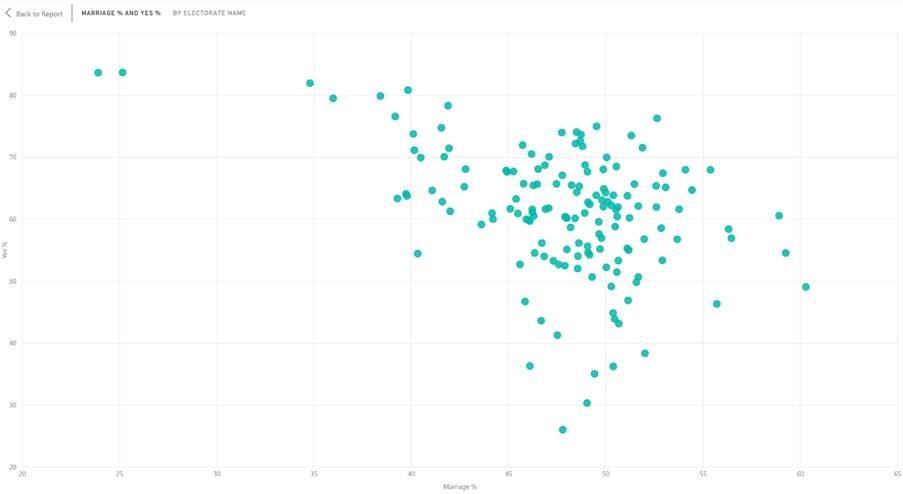
The first thing we tried to do was pair up the postal vote data with other data available from the Australian Bureau of Statistics. Seeing as we’re talking about marriage, why not compare the vote in favour of same sex marriage to the number of married people in each voting area? It turns out, there is a reasonable (or unreasonable?) negative correlation between the % of people who are married in an electorate, and the propensity for people to have voted in favour of same sex marriage.
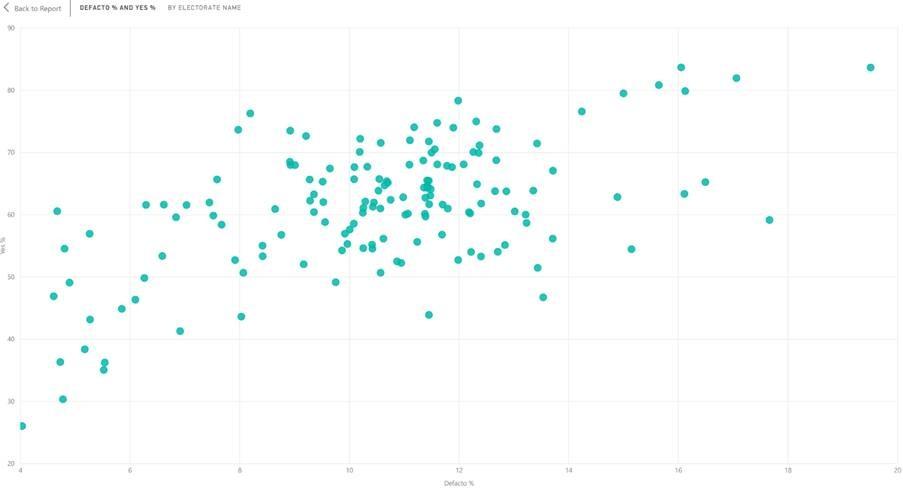
However, the more interesting feature of the ABS data shows that if you look at people in defacto relationships, the correlation is not just the inverse, but it’s also even stronger:
The actual question we were trying to uncover the answer to though, which led us down the ABS data path, is in relation to comments that a number of people have made, noting that “48% is not a majority”, suggesting that if you take into consideration the turnout rate, the headline 62% Yes vote is not as strong as it implies. So we decided to pass the numbers through and look at the actual Yes % and No %, looking at the whole eligible voting population, to see which electorates made it over the 50% majority line.
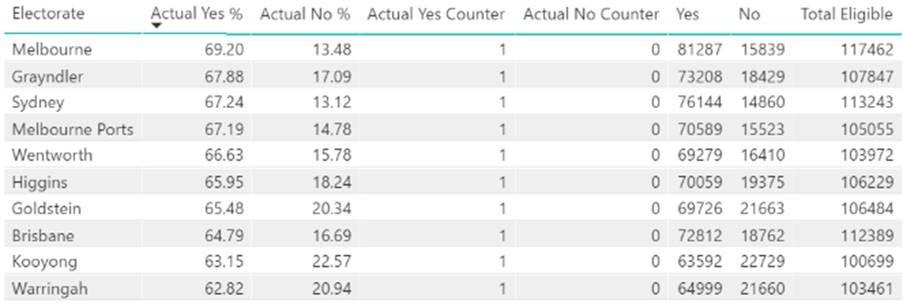
What we uncovered is that there were a total of 69 out of 150 electorates which met the criteria of having a Yes vote of over 50%, on an absolute basis (i.e. No votes, invalid votes and non-responses were less than 50% in total). While that wouldn’t get you a parliamentary majority, it’s still a very strong response. By contrast, we tried to see how many electorates would have won a No vote on an absolute, and found that just three electorates met the criteria.
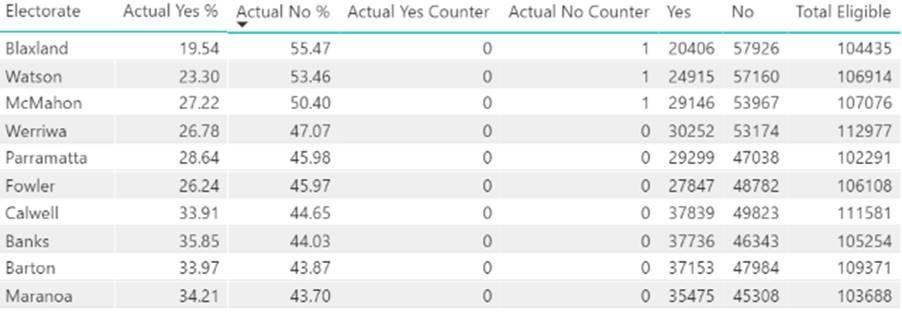
So really, the Yes vote won 69 seats to 3 on an absolute majority basis, which is actually even more of a landslide than the 133 to 17 seats on a two-party preferred basis.
We’re probably going to play with the results a little more, along with the 2016 Census data, so check back in the next week to see what else we uncover!