
Power Query: Tidier Totals by Type
21 July 2021
Welcome to our Power Query blog. This week, I take another look at selective running totals.
Last time, I extracted running totals by Tent Type for my tent data:
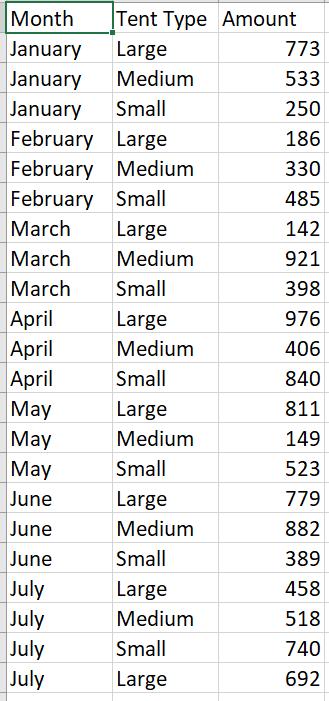
Although I got to my required output, I had to make an assumption that I had seven [7] rows for each Tent Type (since I had seven months of data).

I will start from the Added Index step that I used last time.

Since I am going to be reading the data in the table, I buffer it in step Custom1.
= Table.Buffer(#"Added Index")
The Custom Column I am going to create this time is a little more complicated, and is based upon Table() functionality instead of List() functionality. This allows me to enter conditions.

The M code I have used is:
= (Other_Table) =>Table.SelectRows(Custom1,
(Total_Table) => Total_Table[Index] <= Other_Table[Index]
and Total_Table[Tent Type] = Other_Table[Tent Type])
This looks complicated, but it can be broken down. Custom1 is the table from the previous step. Total_Table is the data that I am grouping. It’s essentially looking for all the rows where the Tent Type matches, and the Index is less than or equal to where we are now. Other_Table is the current table. The result will be a mini table, with all the rows that should be included in the running total.

I have grouped the data by type into these mini tables. Now I can expand them to get at the amounts.

This gives me a subgroup for each occurrence of Tent Type containing the amounts I need to total for the running total.

I can group these by Index.
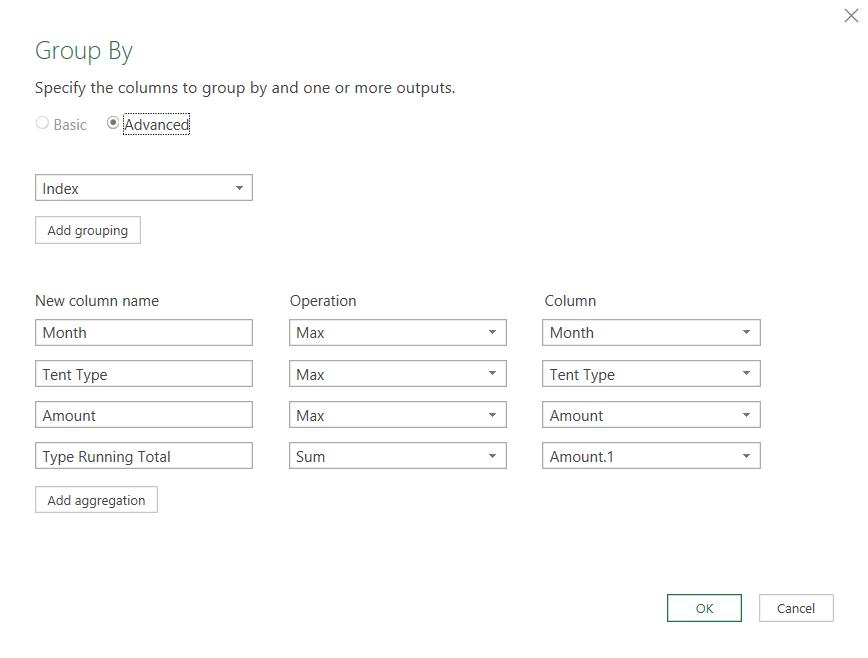
Since the values in Month, Tent Type and Amount are the same for all occurrences in the group, I use Max (I could also use Min).
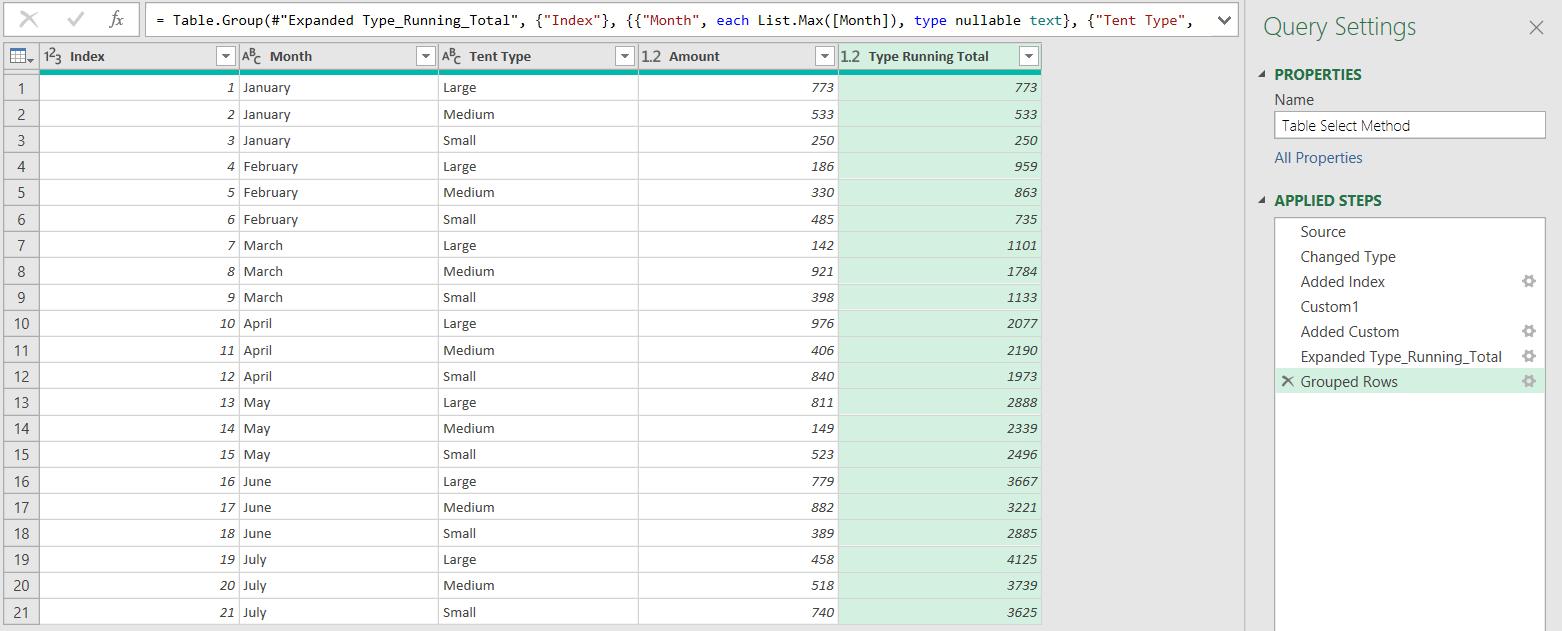
The results are the same as last week, but this time I didn’t need to assume anything about my data, so this query would cope with additional months being added.
Come back next time for more ways to use Power Query!