
Power Query: Step Back and See
7 August 2019
Welcome to our Power Query blog. Today, I build a function to add a column to a table.
My imaginary salesperson, Mary, has been busy, and I want to look at how her commission varies daily.
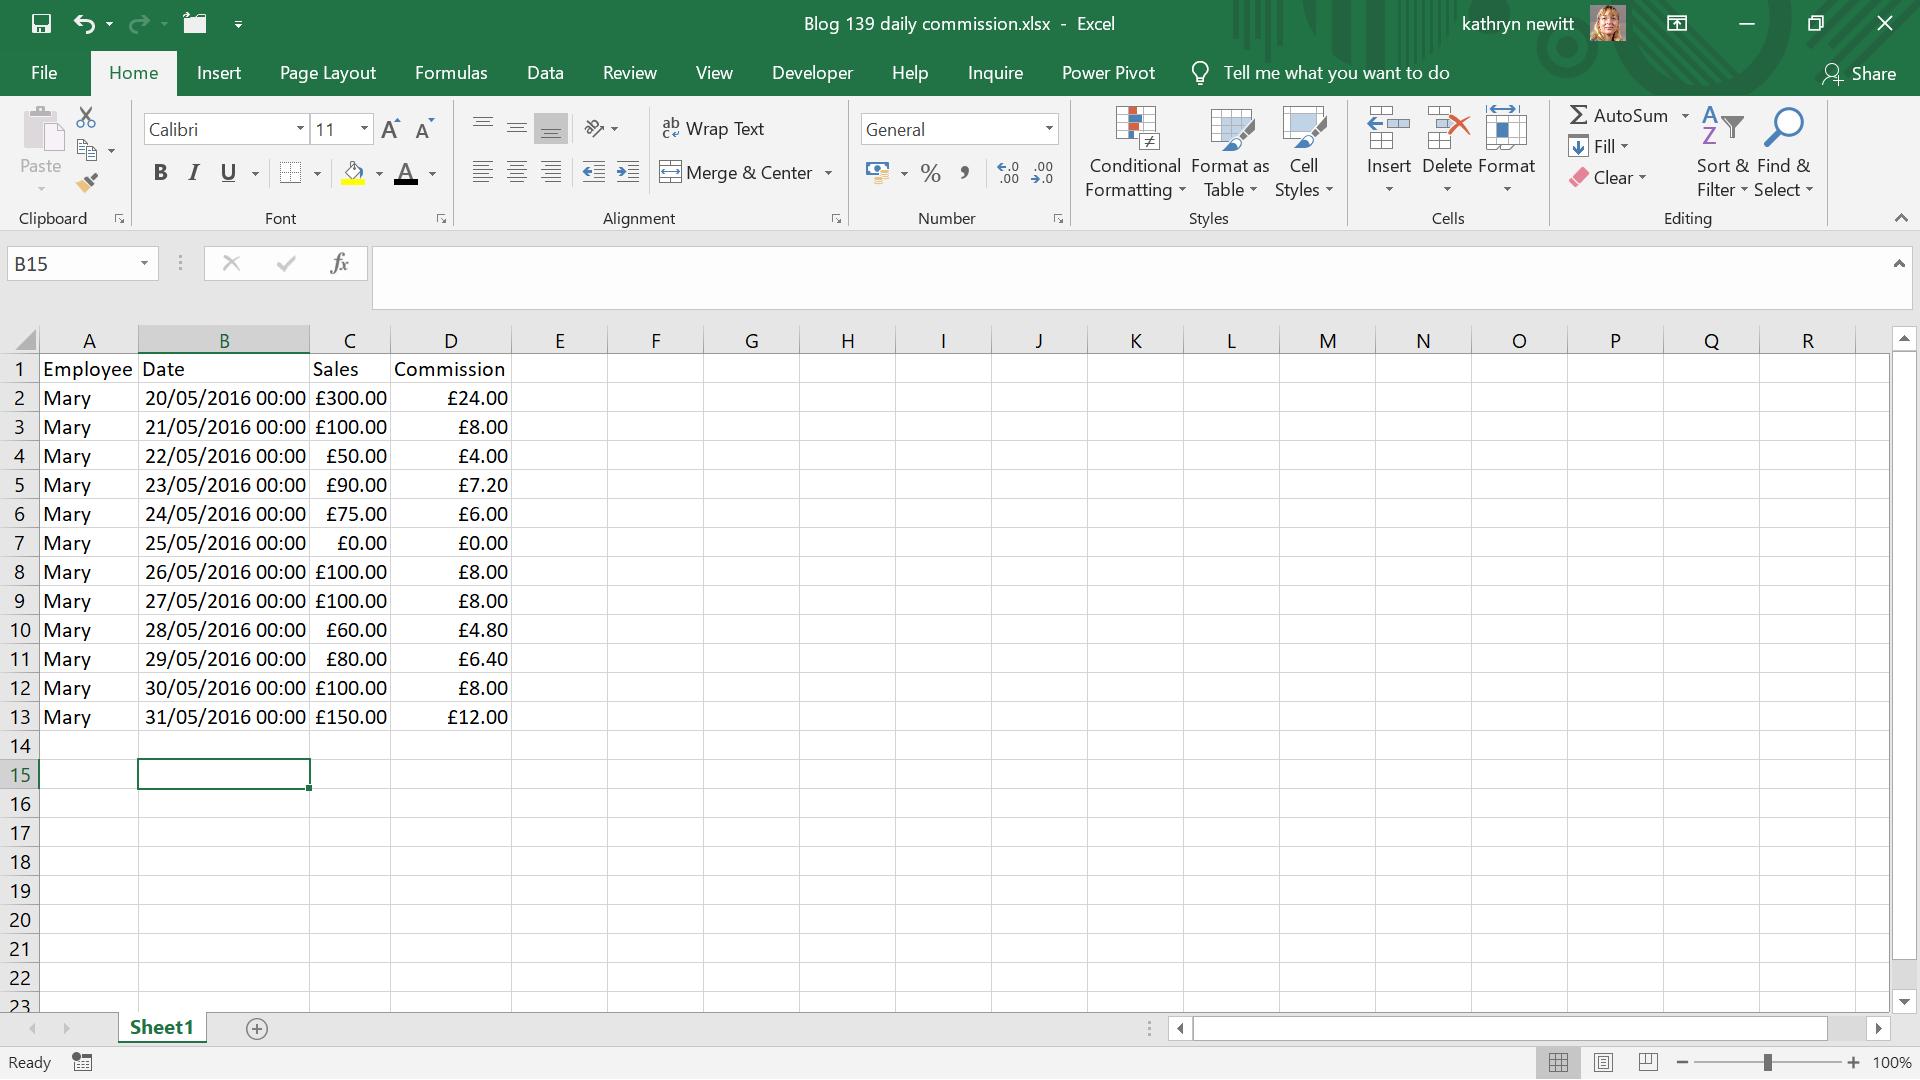
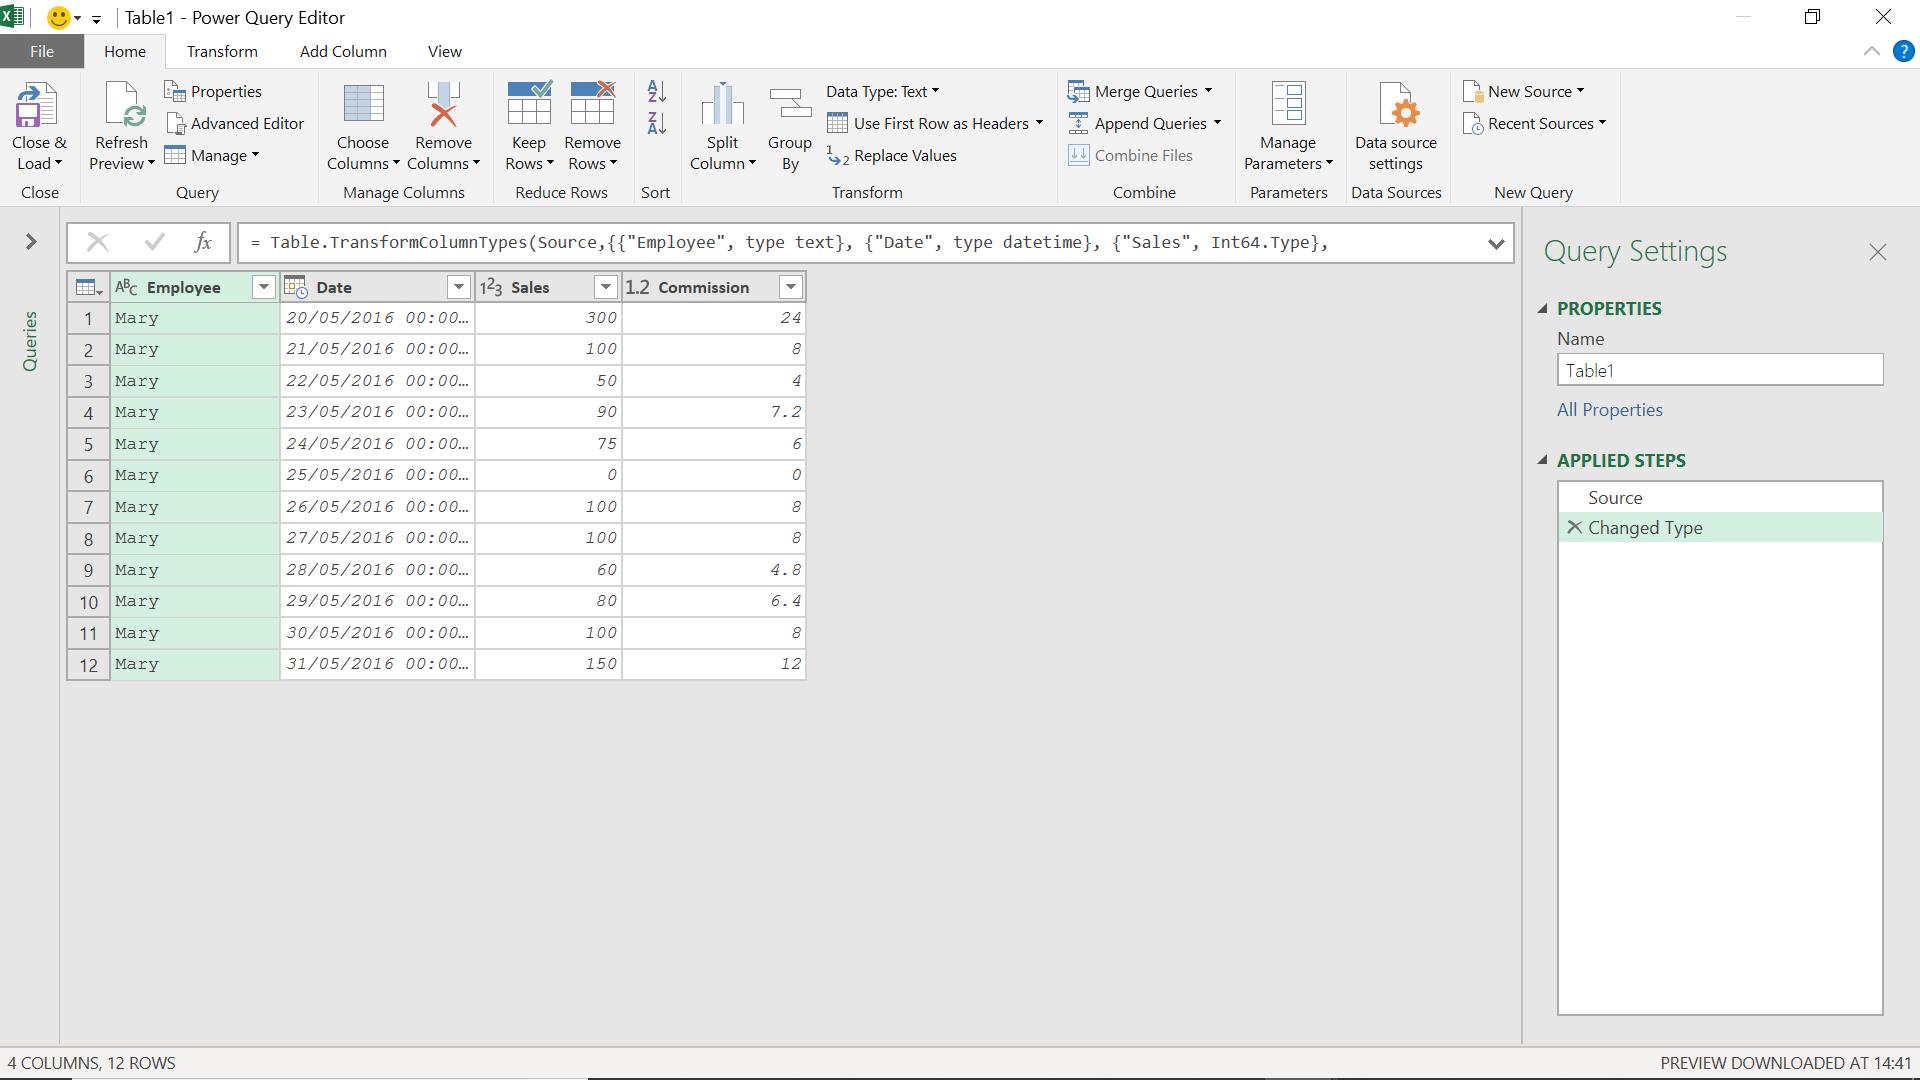
I upload my data into Power Query using ‘From Table’ on the ‘Get & Transform’ section of the Data tab.
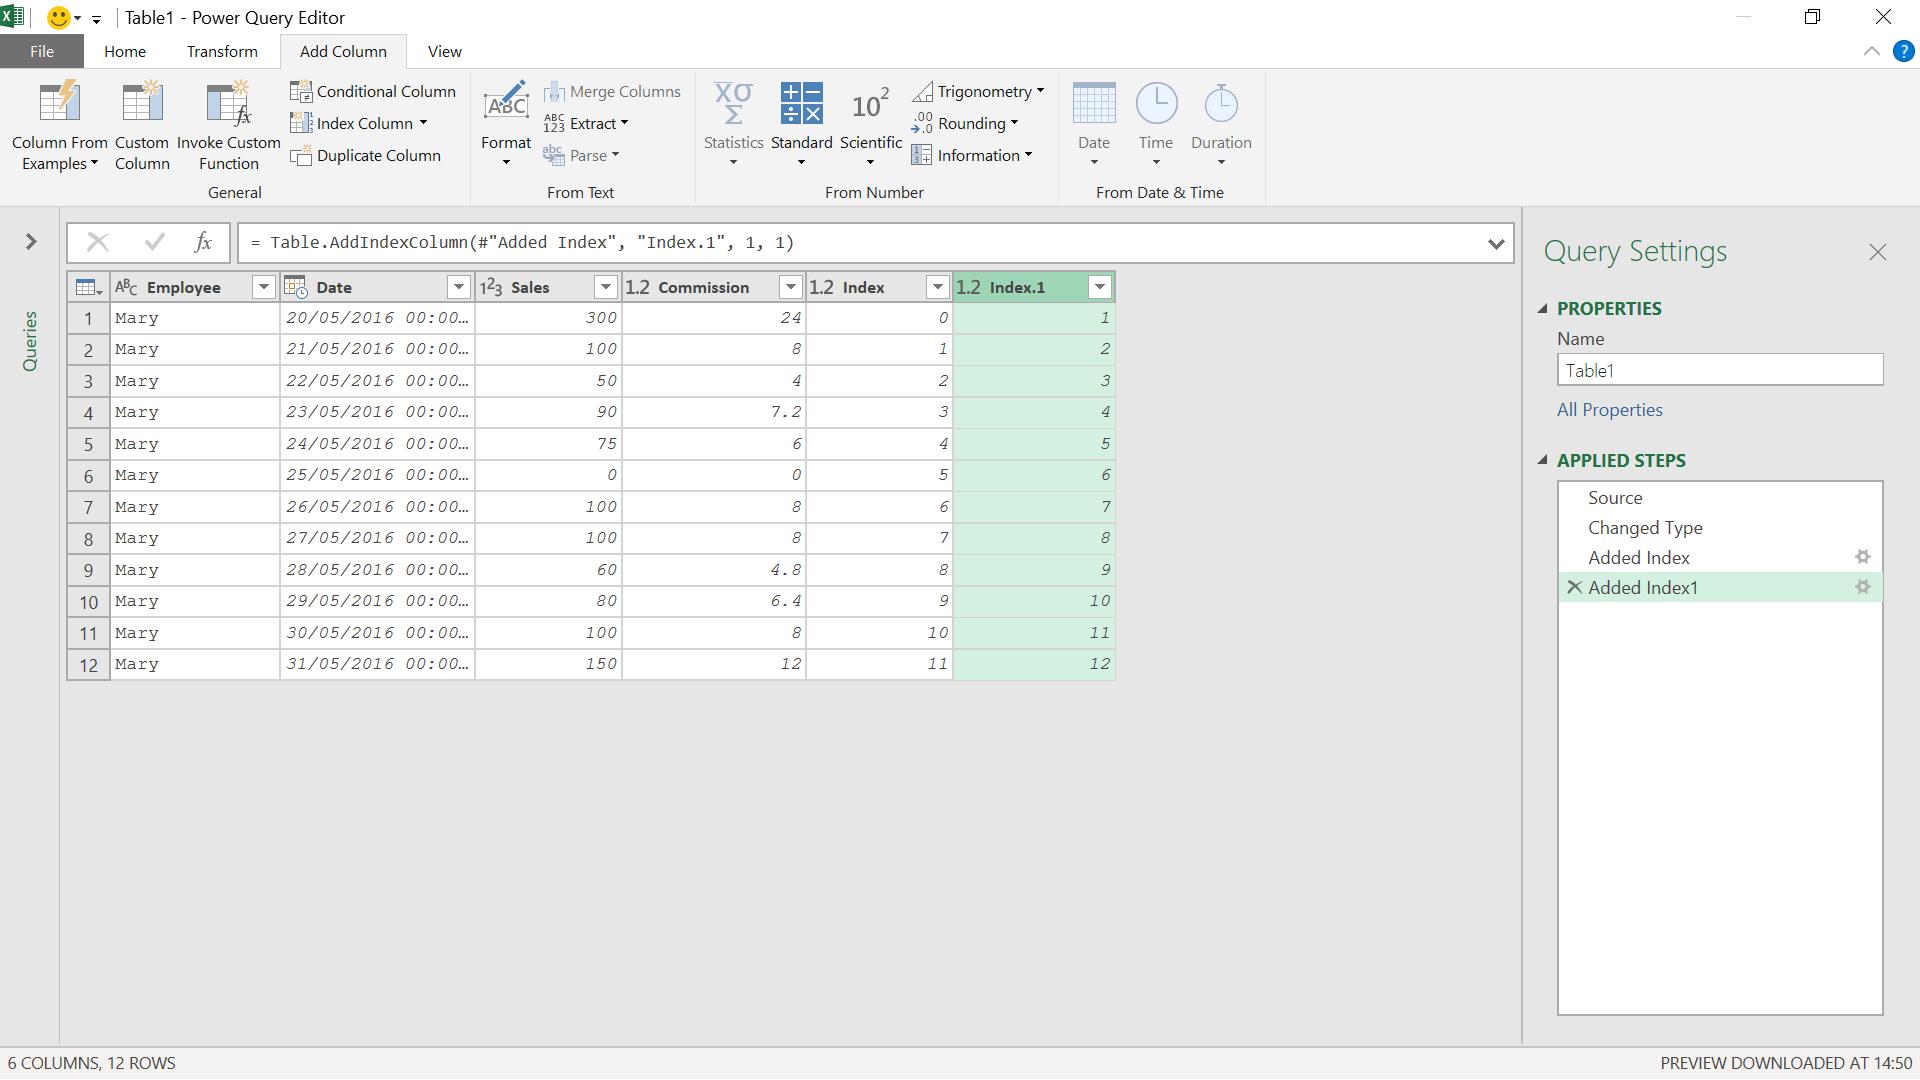
I am going to add an index column, in the ‘Add Column’ tab:
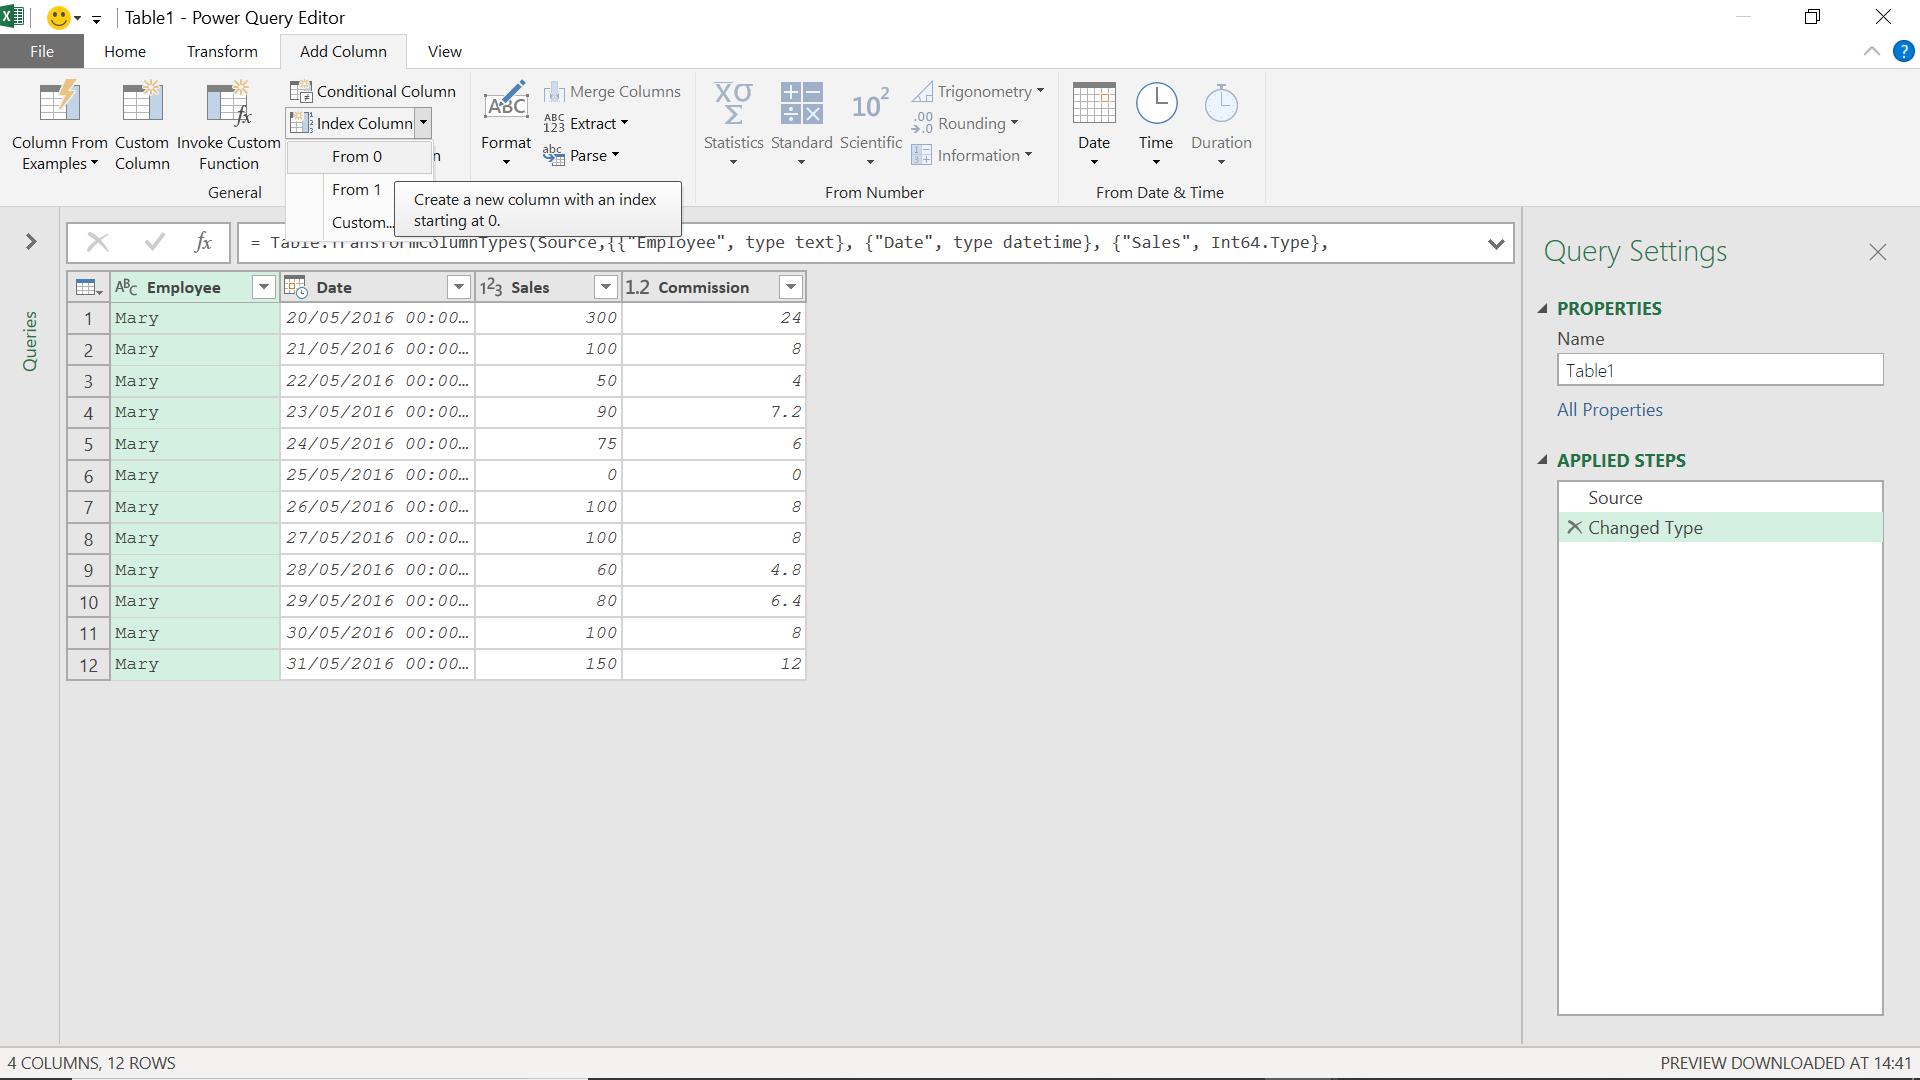
I choose to start from 0.
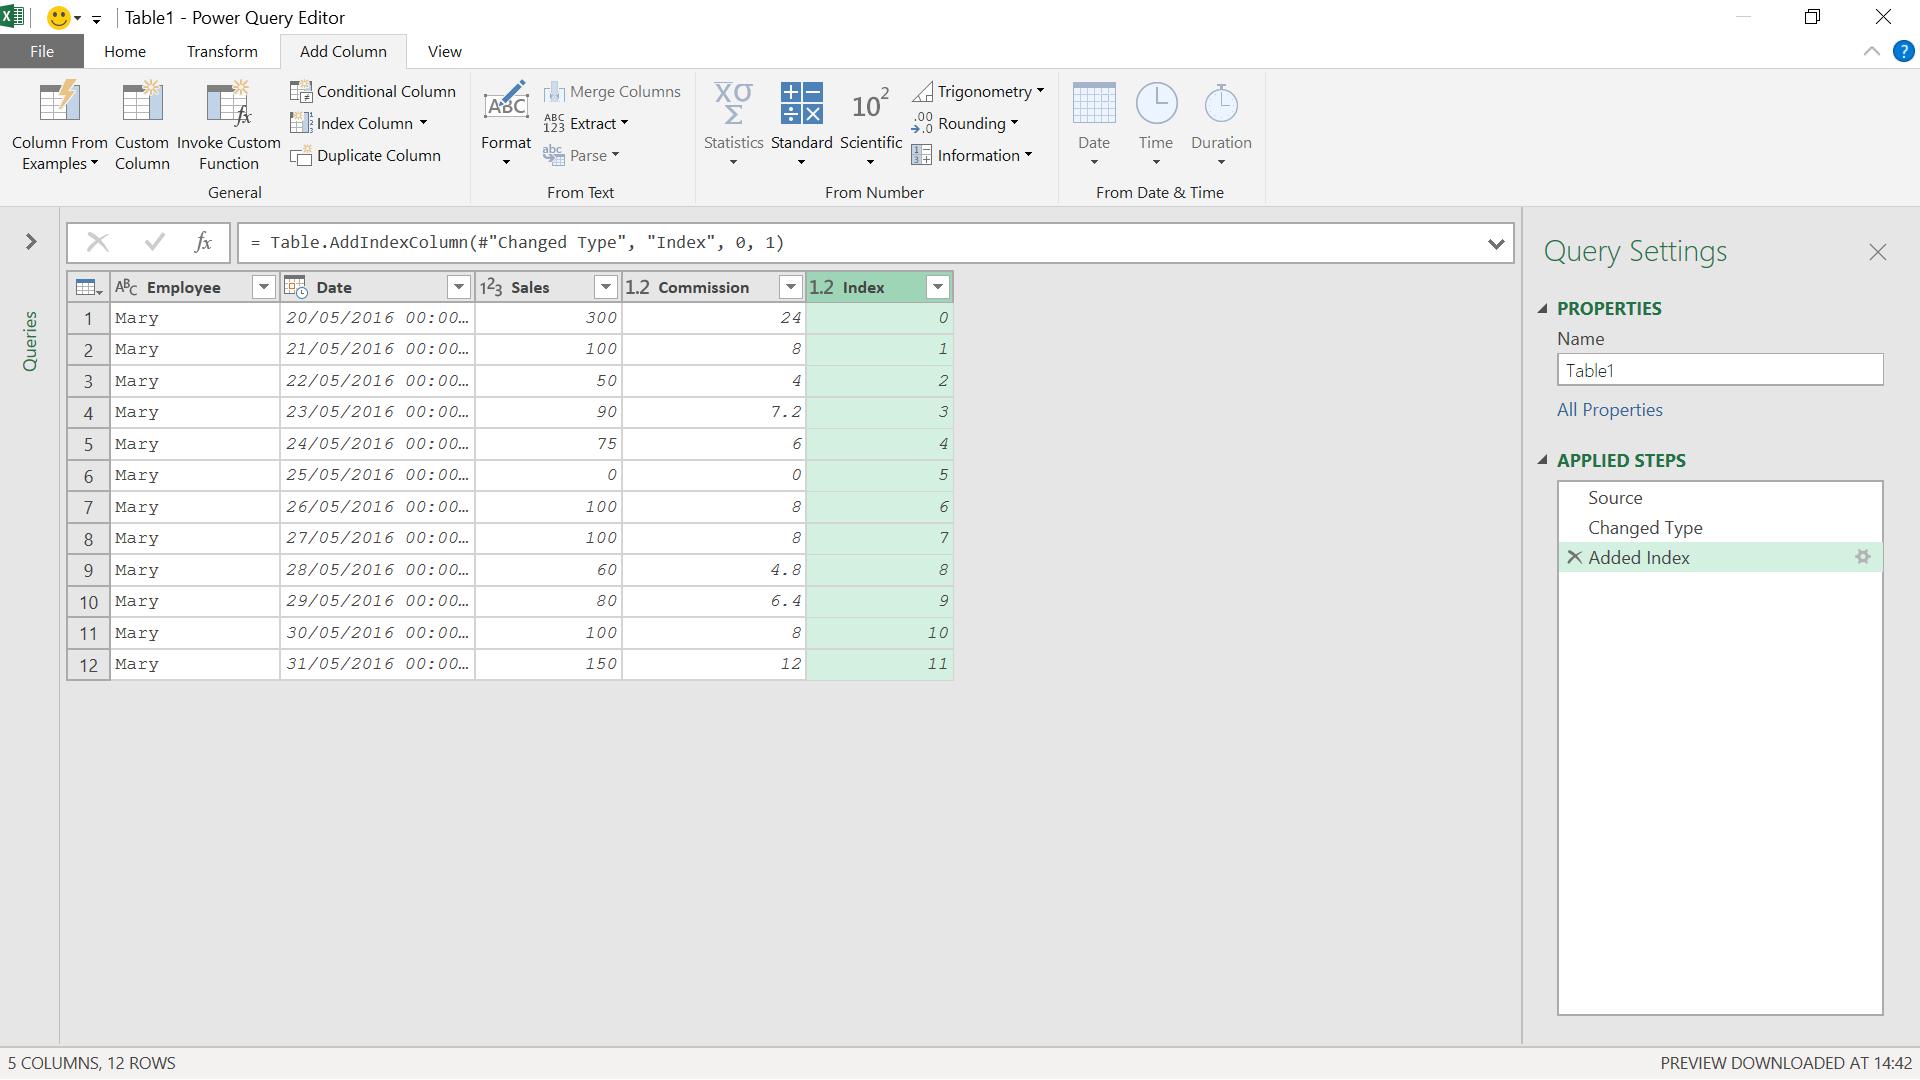
The step is call ‘Added Index’, which I need to remember for later. I am going to add another index column, this time starting at 1:
I am going to merge ‘Added Index’ and’ Added Index.1’ by using some M code in a step. This will allow me to link each row to the previous row. The M function I am using is Table.NestedJoin(), which I used in Power Query: Group Dynamics when I was calculating group share.
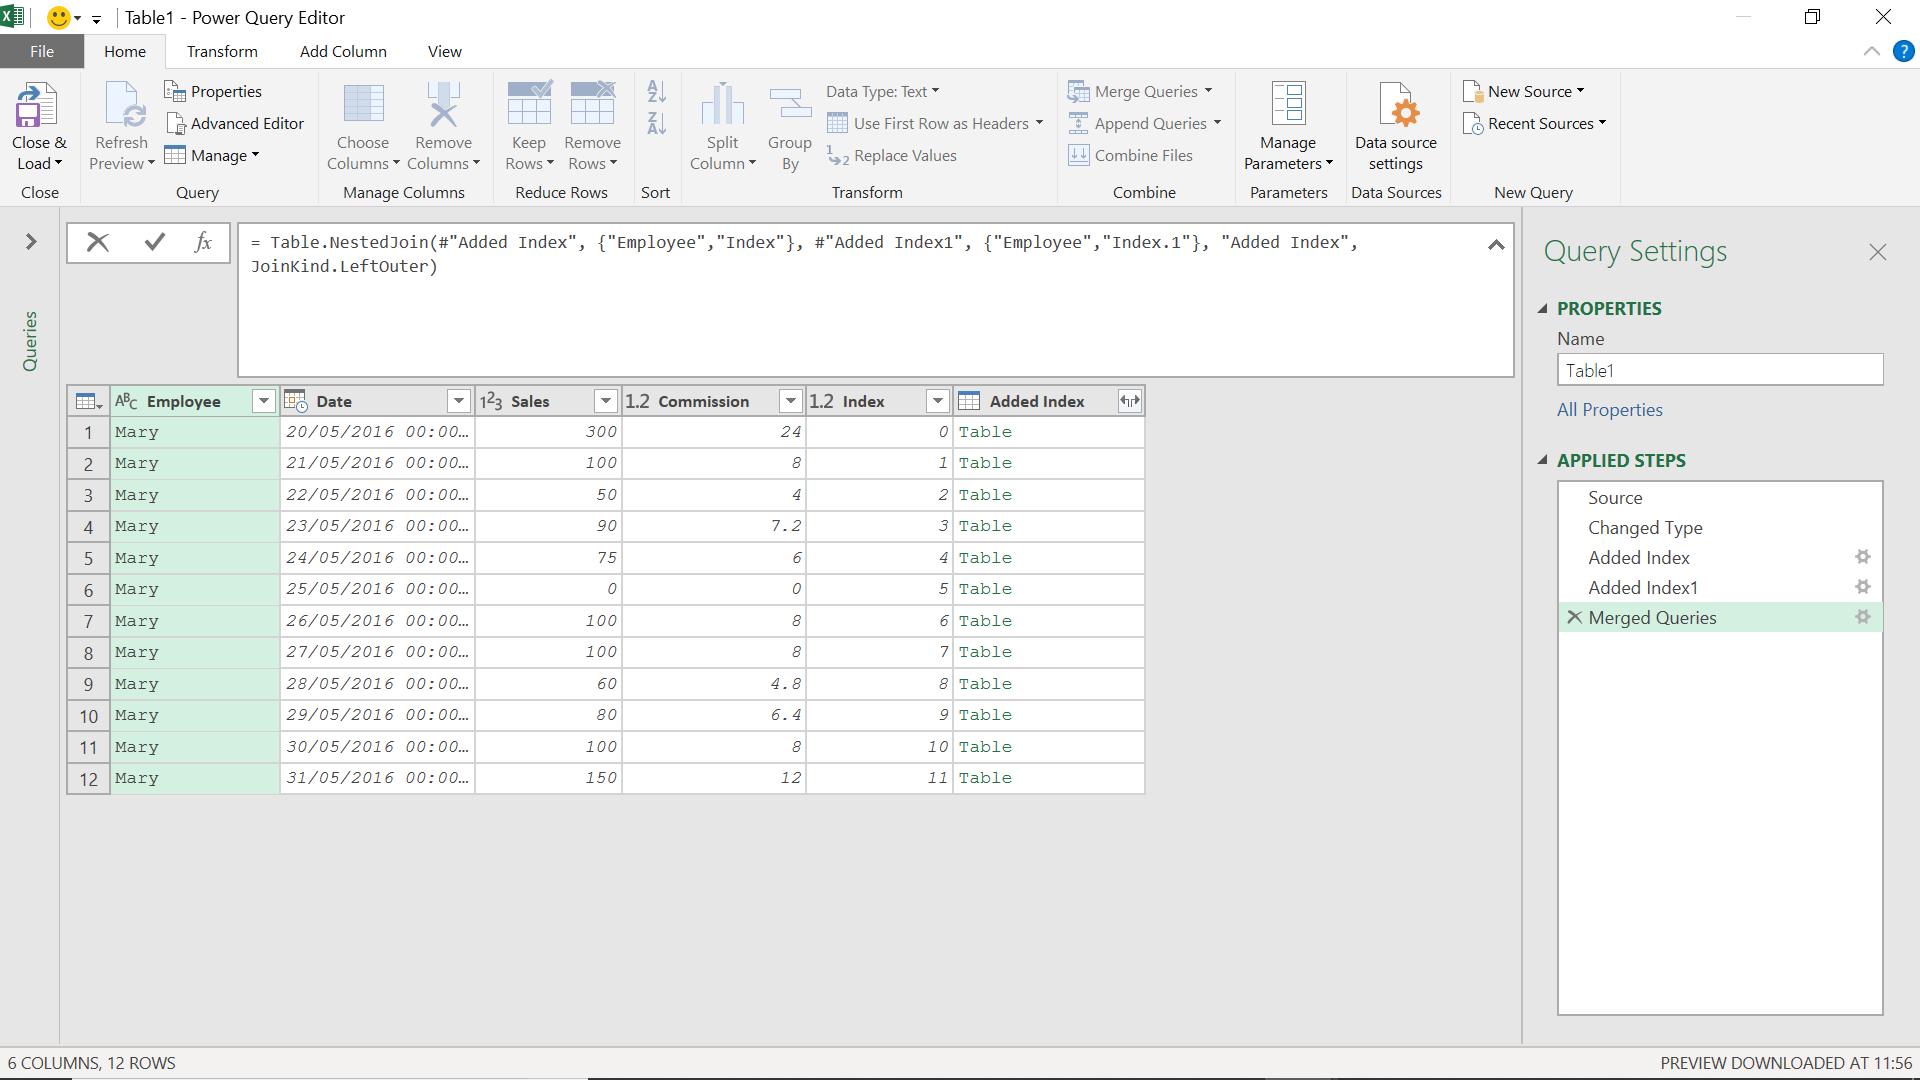
The M code I have used is:
= Table.NestedJoin(#"Added Index", {"Employee","Index"}, #"Added Index1", {"Employee","Index.1"}, "Added Index", JoinKind.LeftOuter)
This takes my data with the index that begins at 0 and links it to the table with the index that begins at 1. Therefore, it links all the data to the previous row.
Next, I need to expand some data from my joined table.
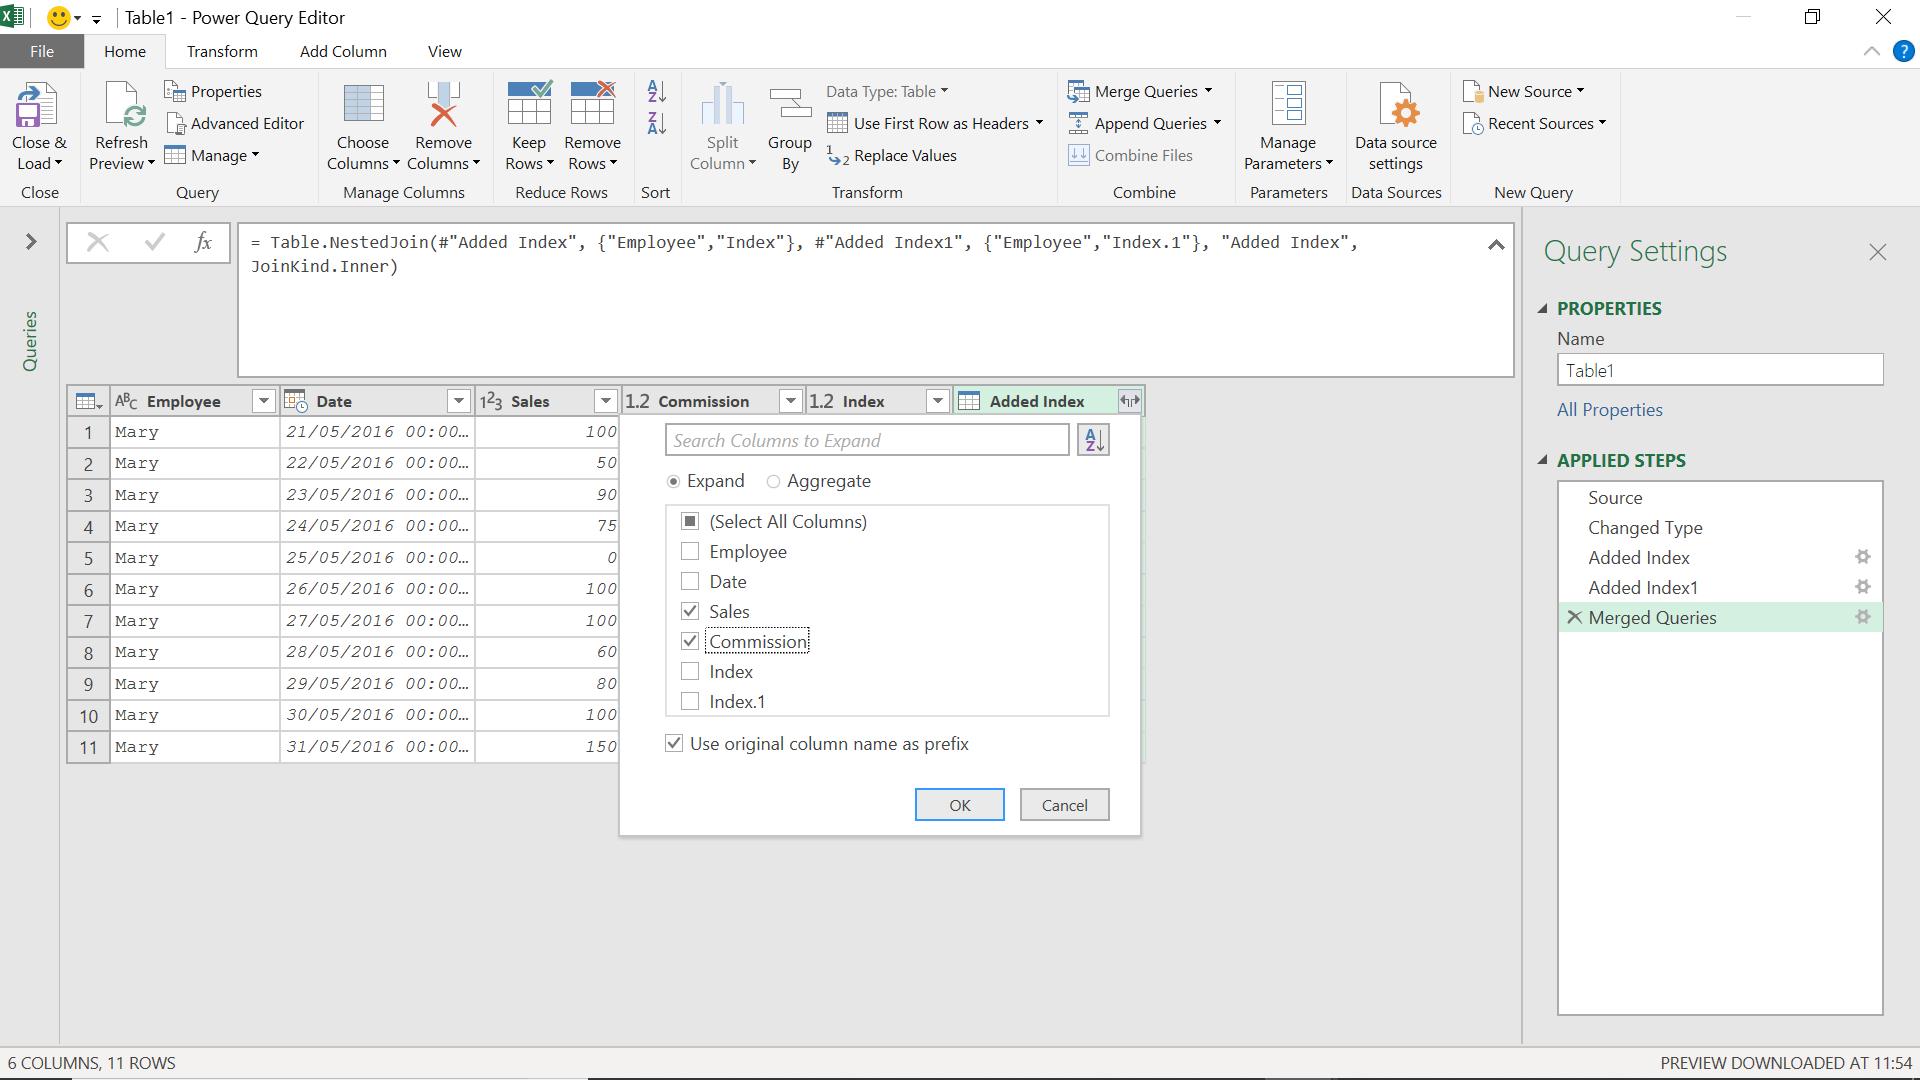
In this case, I will ‘Use original column name as prefix’, so I can distinguish between my original and expanded data.
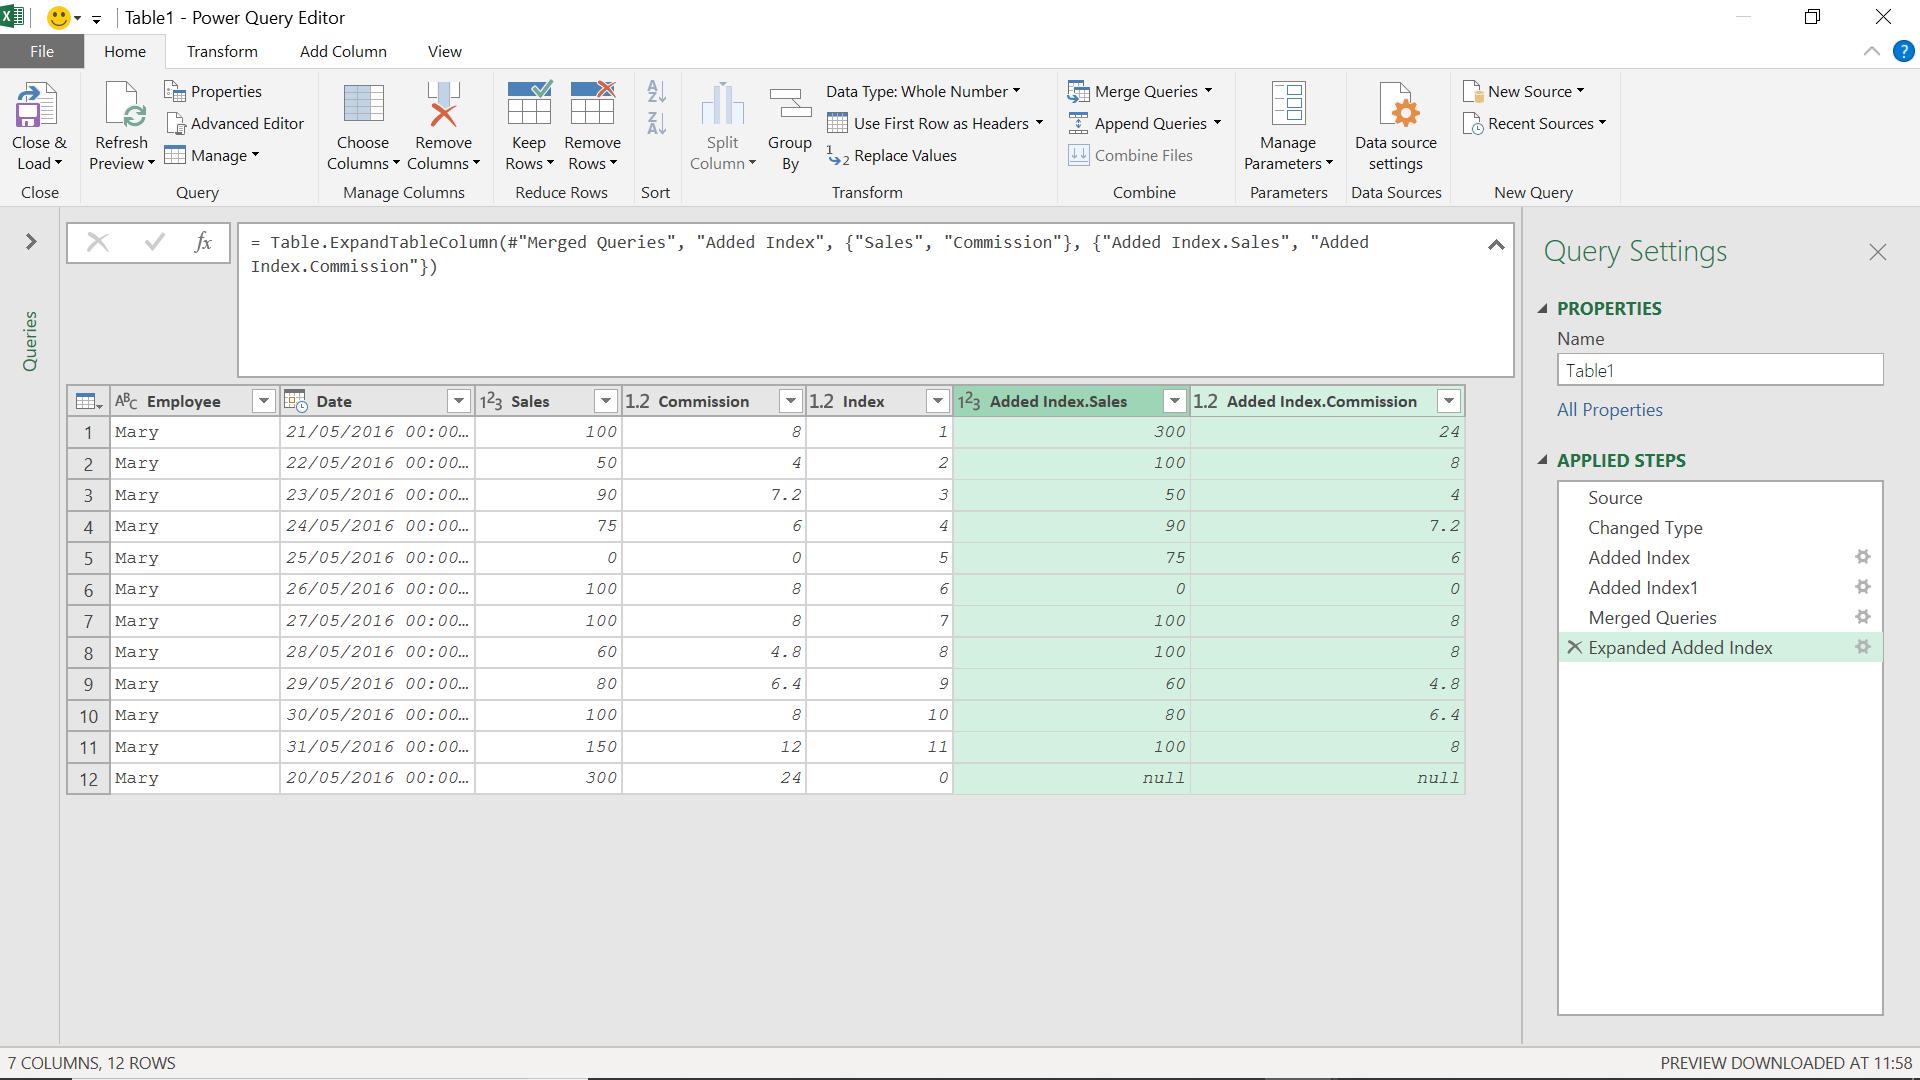
I can now remove the row with null values. I choose to apply a filter.
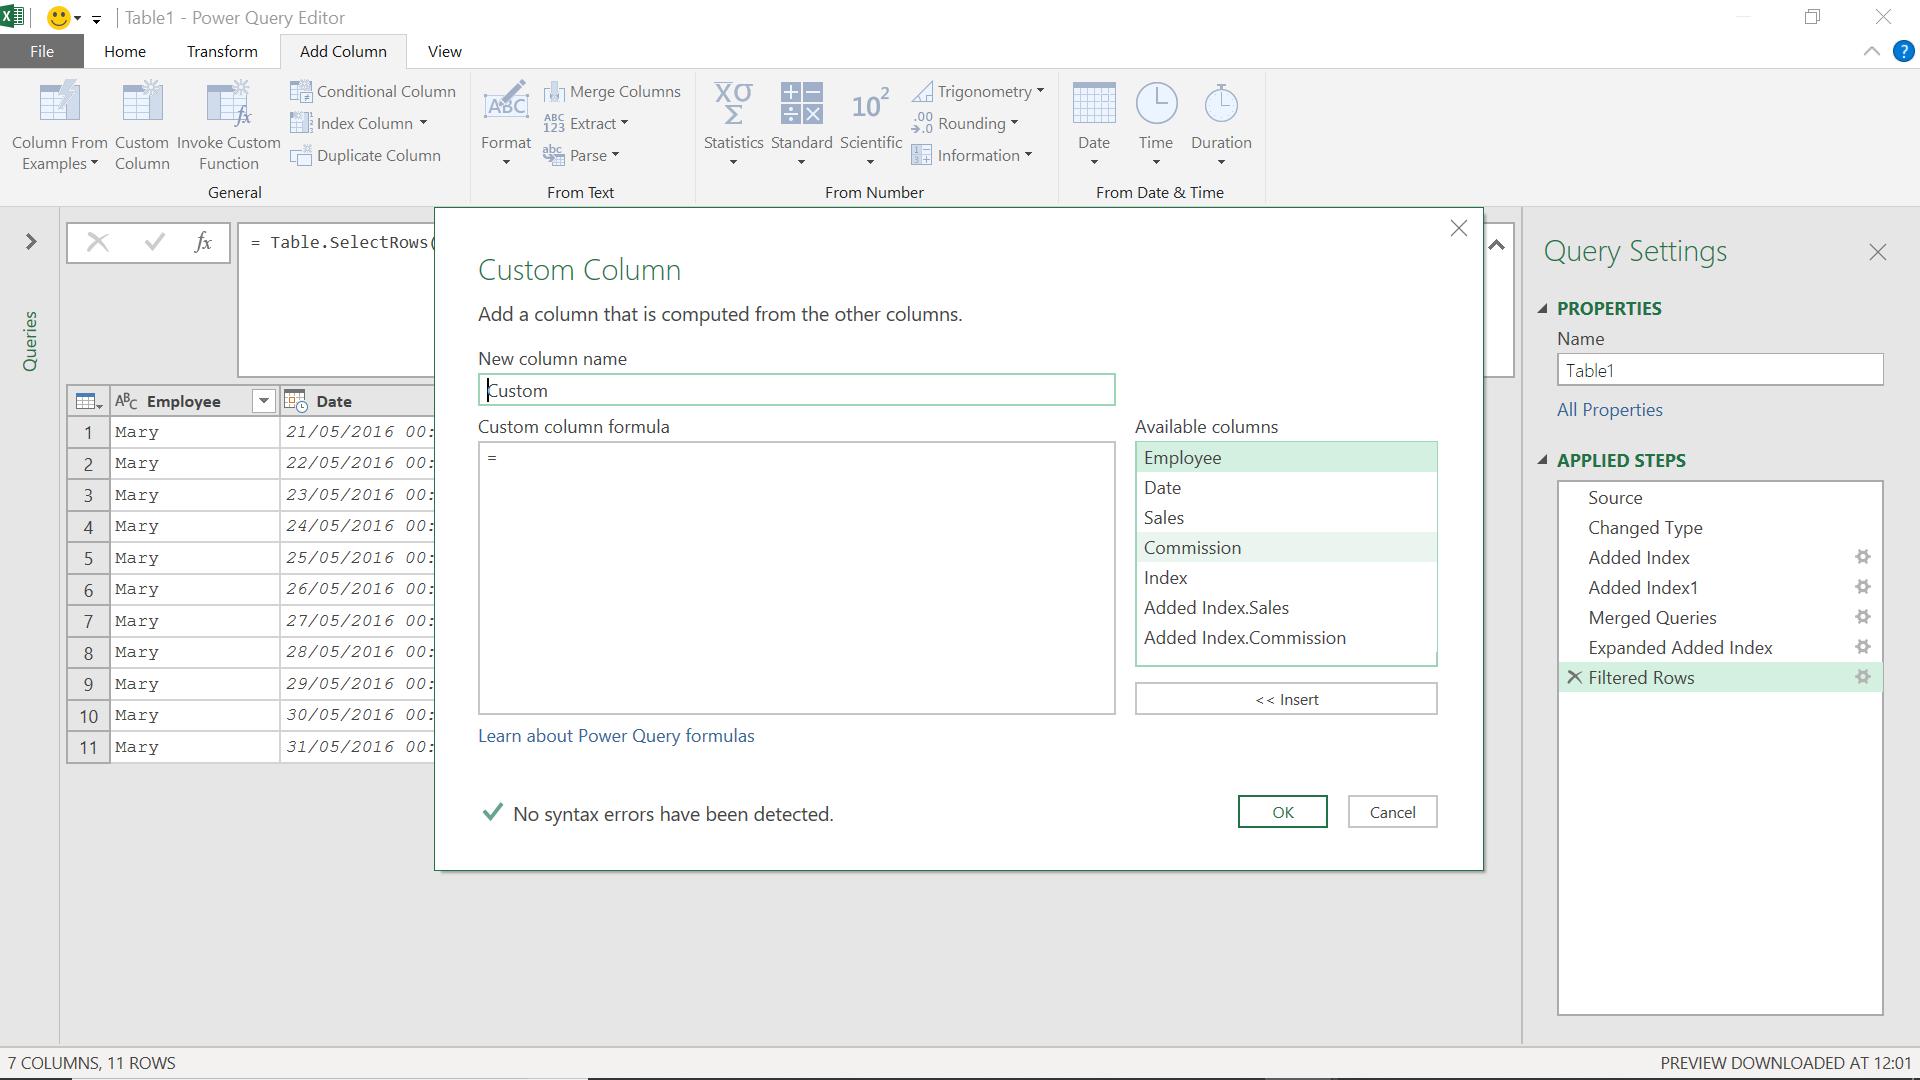
Now, I create a custom column to calculate the daily difference in commission.
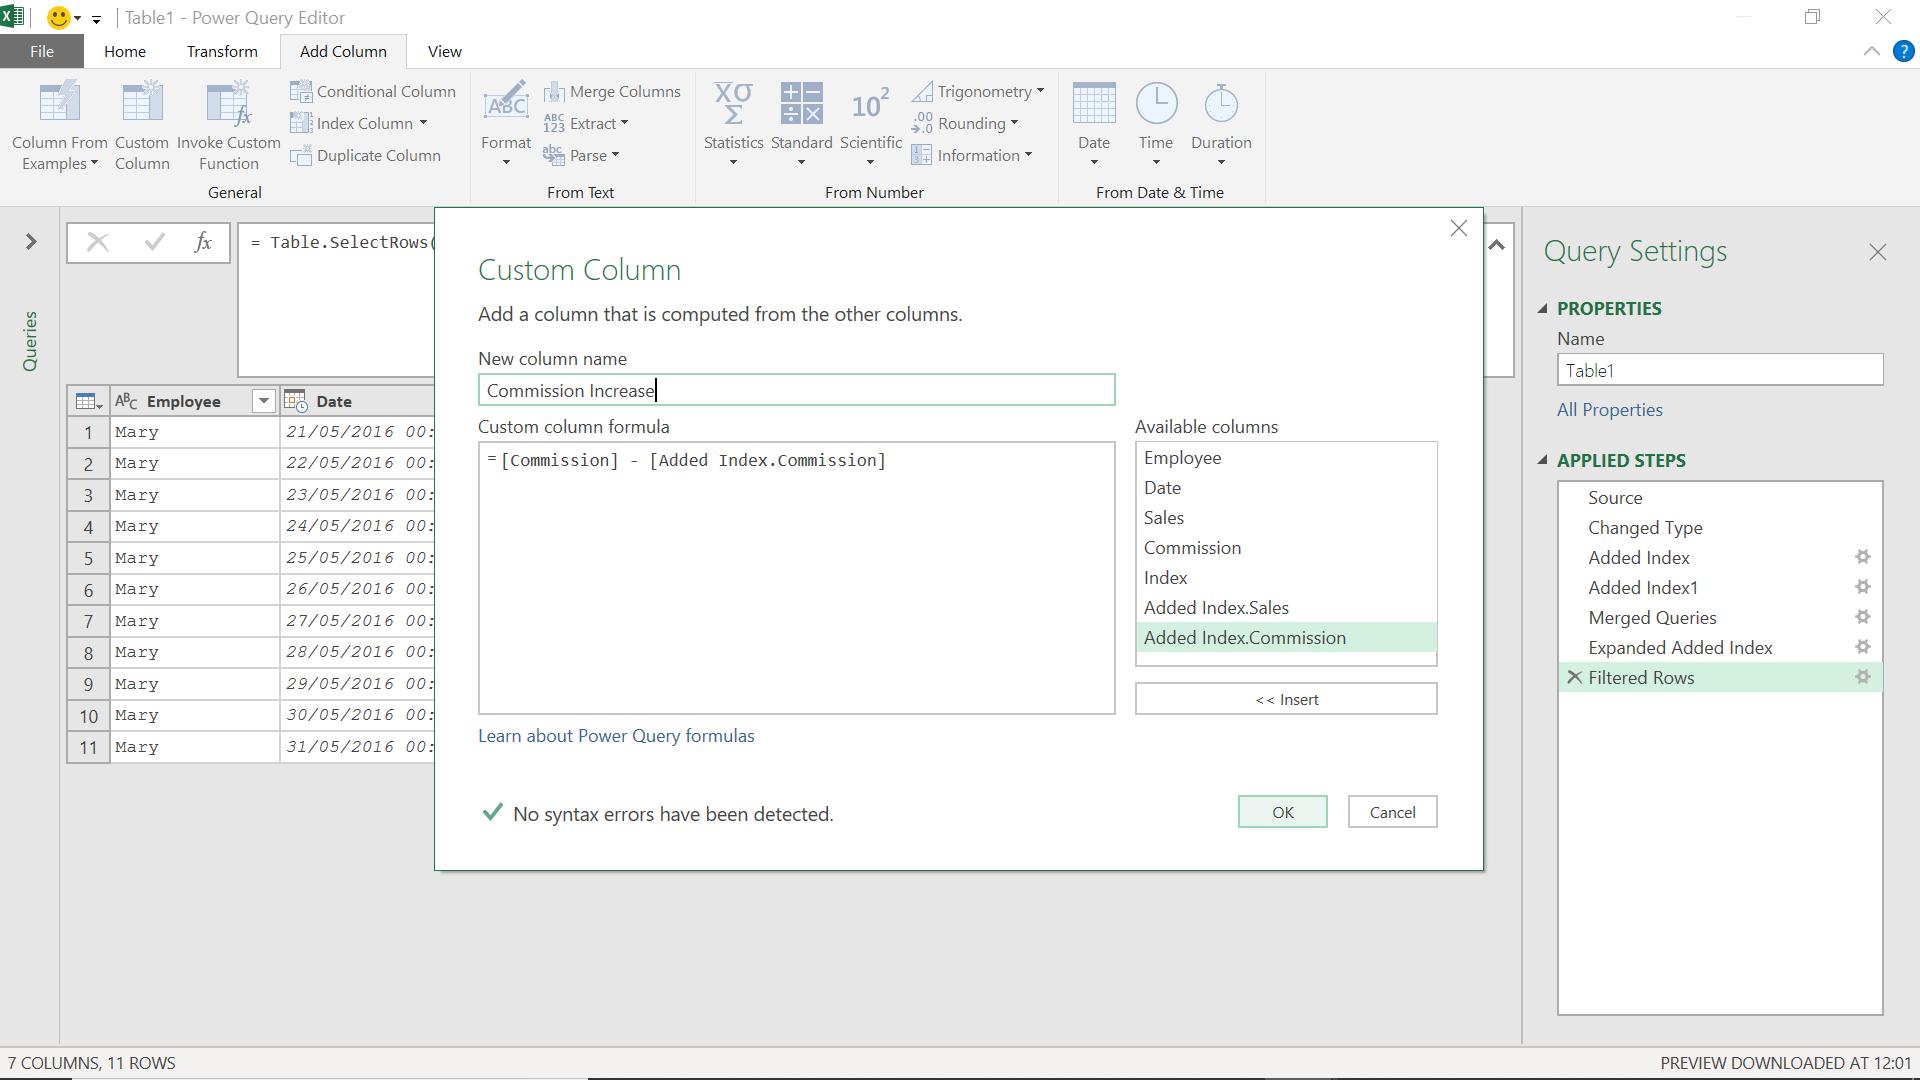
I click OK to see my new column:
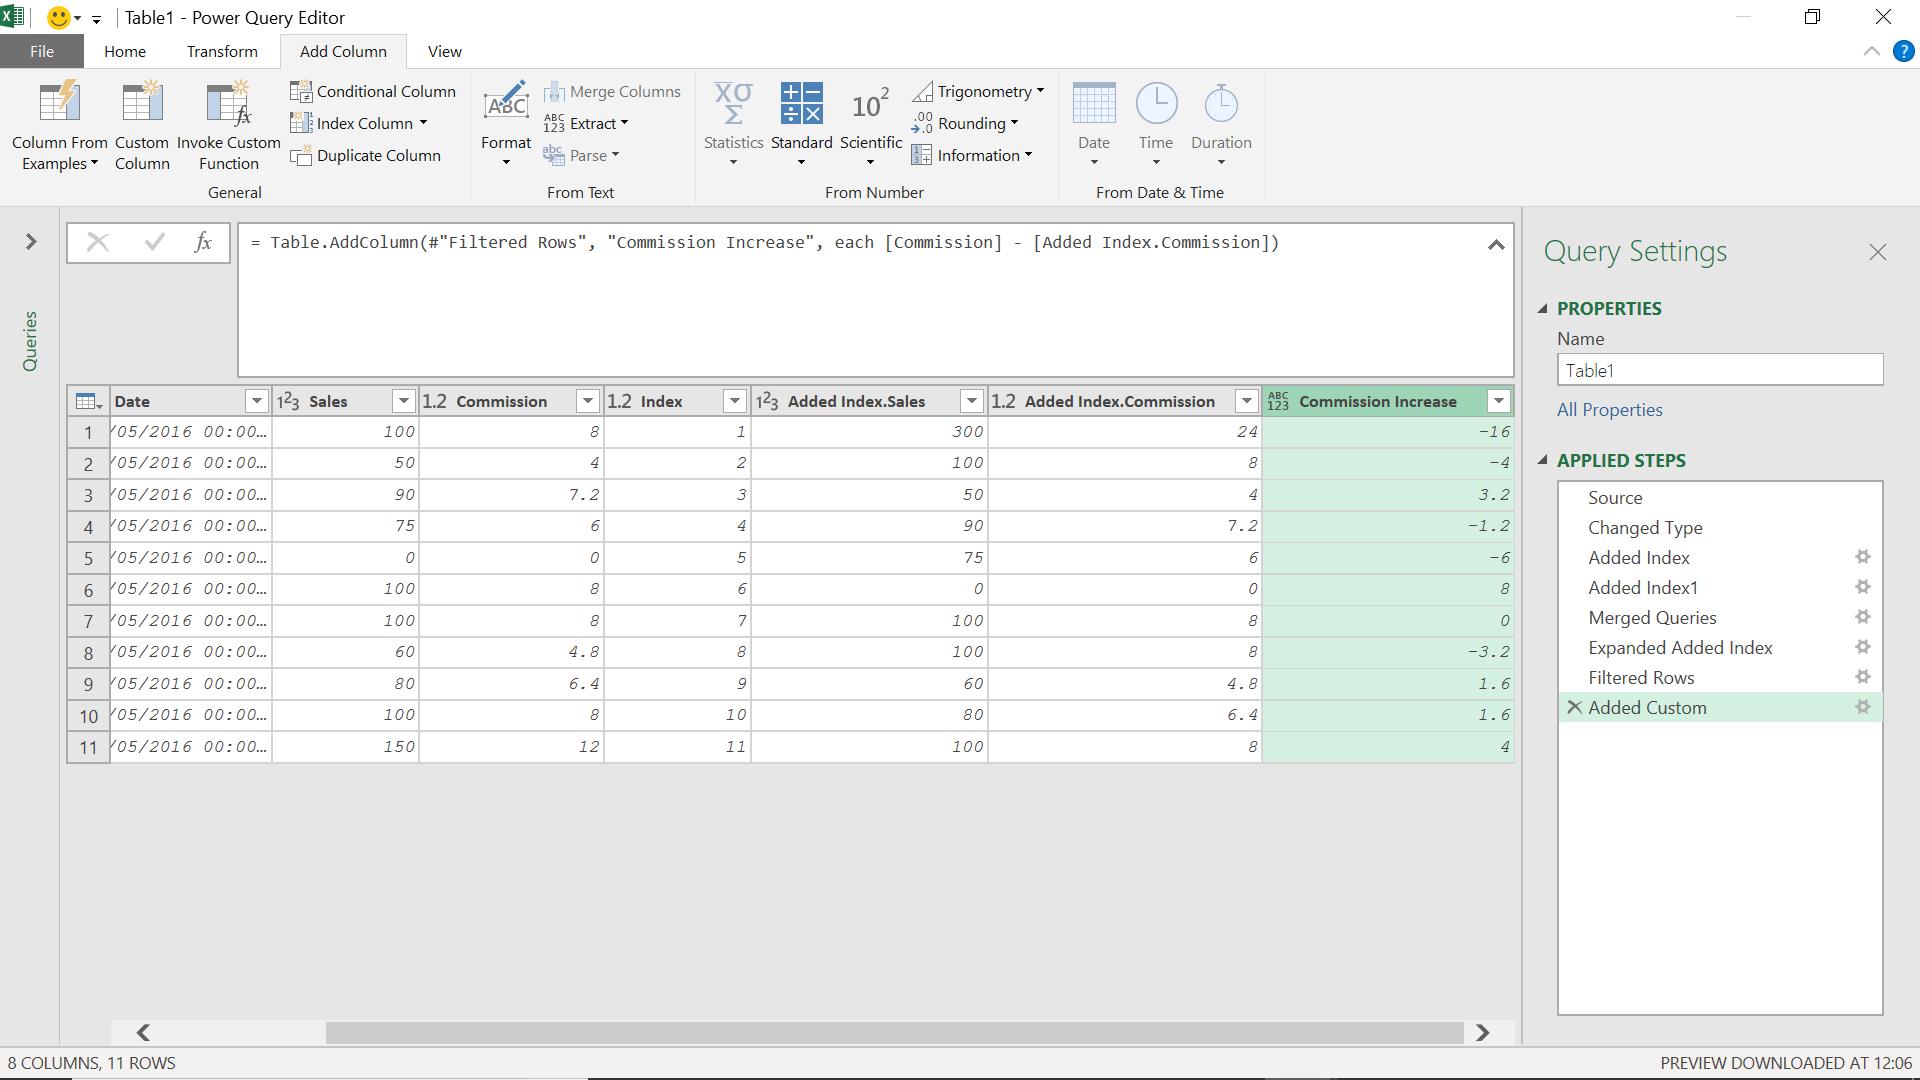
I can track my salesperson’s progress in terms of commission, and set targets if I wish.
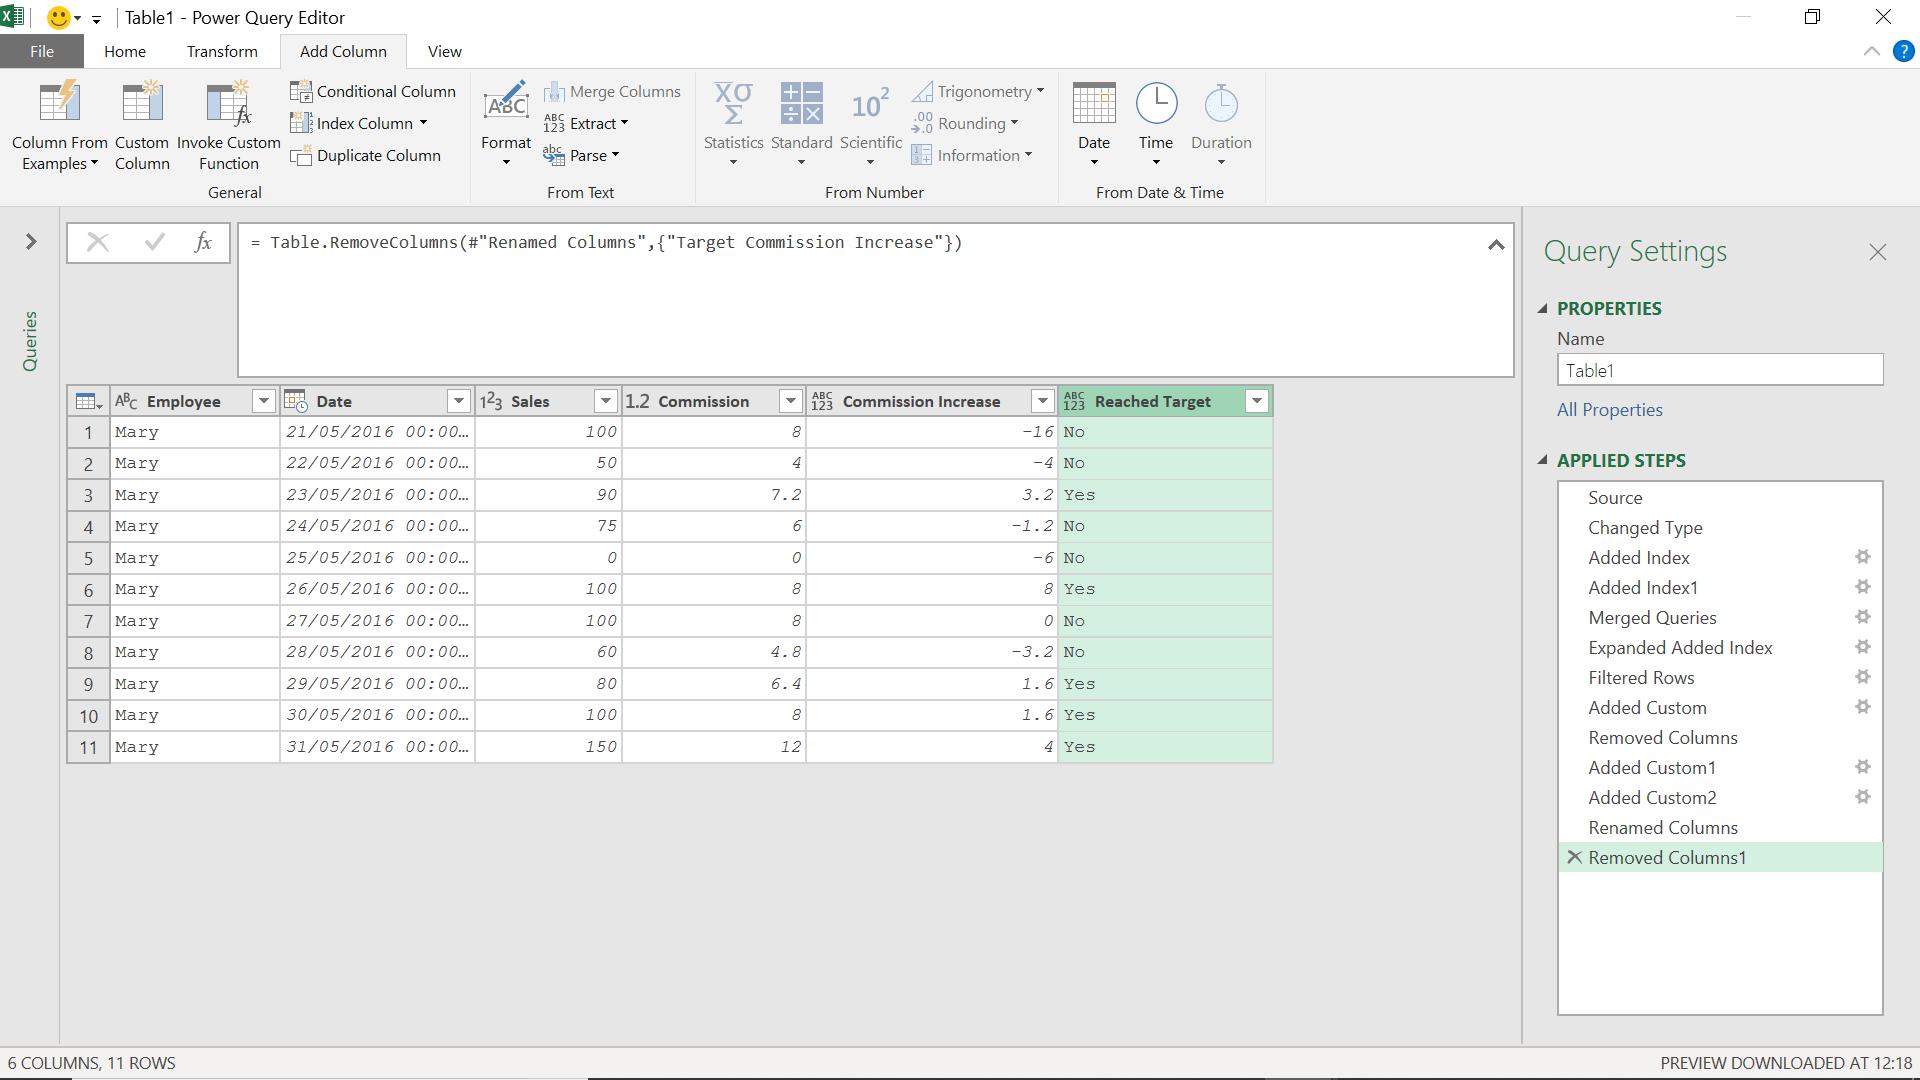
I can expand this method to include data from other salespeople.
Come back next time for more ways to use Power Query!