
Power Query: Room for a View
20 May 2020
Welcome to our Power Query blog. This week, I take a look at some new additions to the view tab, which are still not available on all versions of Power Query. I begin with Column Distribution.
Since SumProduct wrote about this way back in September 2019 when COVID-19 sounded like a TV channel, I have been waiting for this to hit my version of Excel, but as yet, it is only available in some versions. However, it is available in Power BI – where the View tab has some interesting new features.
My current View tab in Power Query looks like this:

However, the Power BI version has a few extras:

The new features are Column Distribution, Column Profile and Column Quality.
In order to try out these features, I am going to use some more challenging data.

This week, I will concentrate on Column Distribution.
I begin by ticking the ‘Column Distribution’ box.

I can see for most of my columns there is a graph for my data and a number of distinct and unique values. There are distinct values for most columns, which means how many different values there are in my column, e.g. if the data were the same for every row, then there would be only one distinct value. A unique value only appears on one row in a column. If I scroll across my columns, I can see that not every column has Column Distribution information:

My Custom and Maybe Null columns have no information, and this is because they have issues (don’t we all?). These issues are not errors, at least not to Power Query, though errors can stop the column distribution being calculated too. In Custom, some calculations divide by zero (0) giving infinity as an answer. In Maybe Null, some values are null, but this is not what is stopping the distribution from appearing. Not providing a column distribution for these columns is currently a limitation of this feature and will hopefully be improved on in time. In the case of Maybe Null, I need to change the datatype from ‘Any’ to ‘Text’.

The distribution for Maybe Null now appears.
To see the distribution for Custom, I need to not only change the datatype to ‘Decimal’, but also filter to remove the infinity values. The second required step seems to be a bug, as I can get around this another way, as I’ll show next week.

If I do this, I can see the distribution:
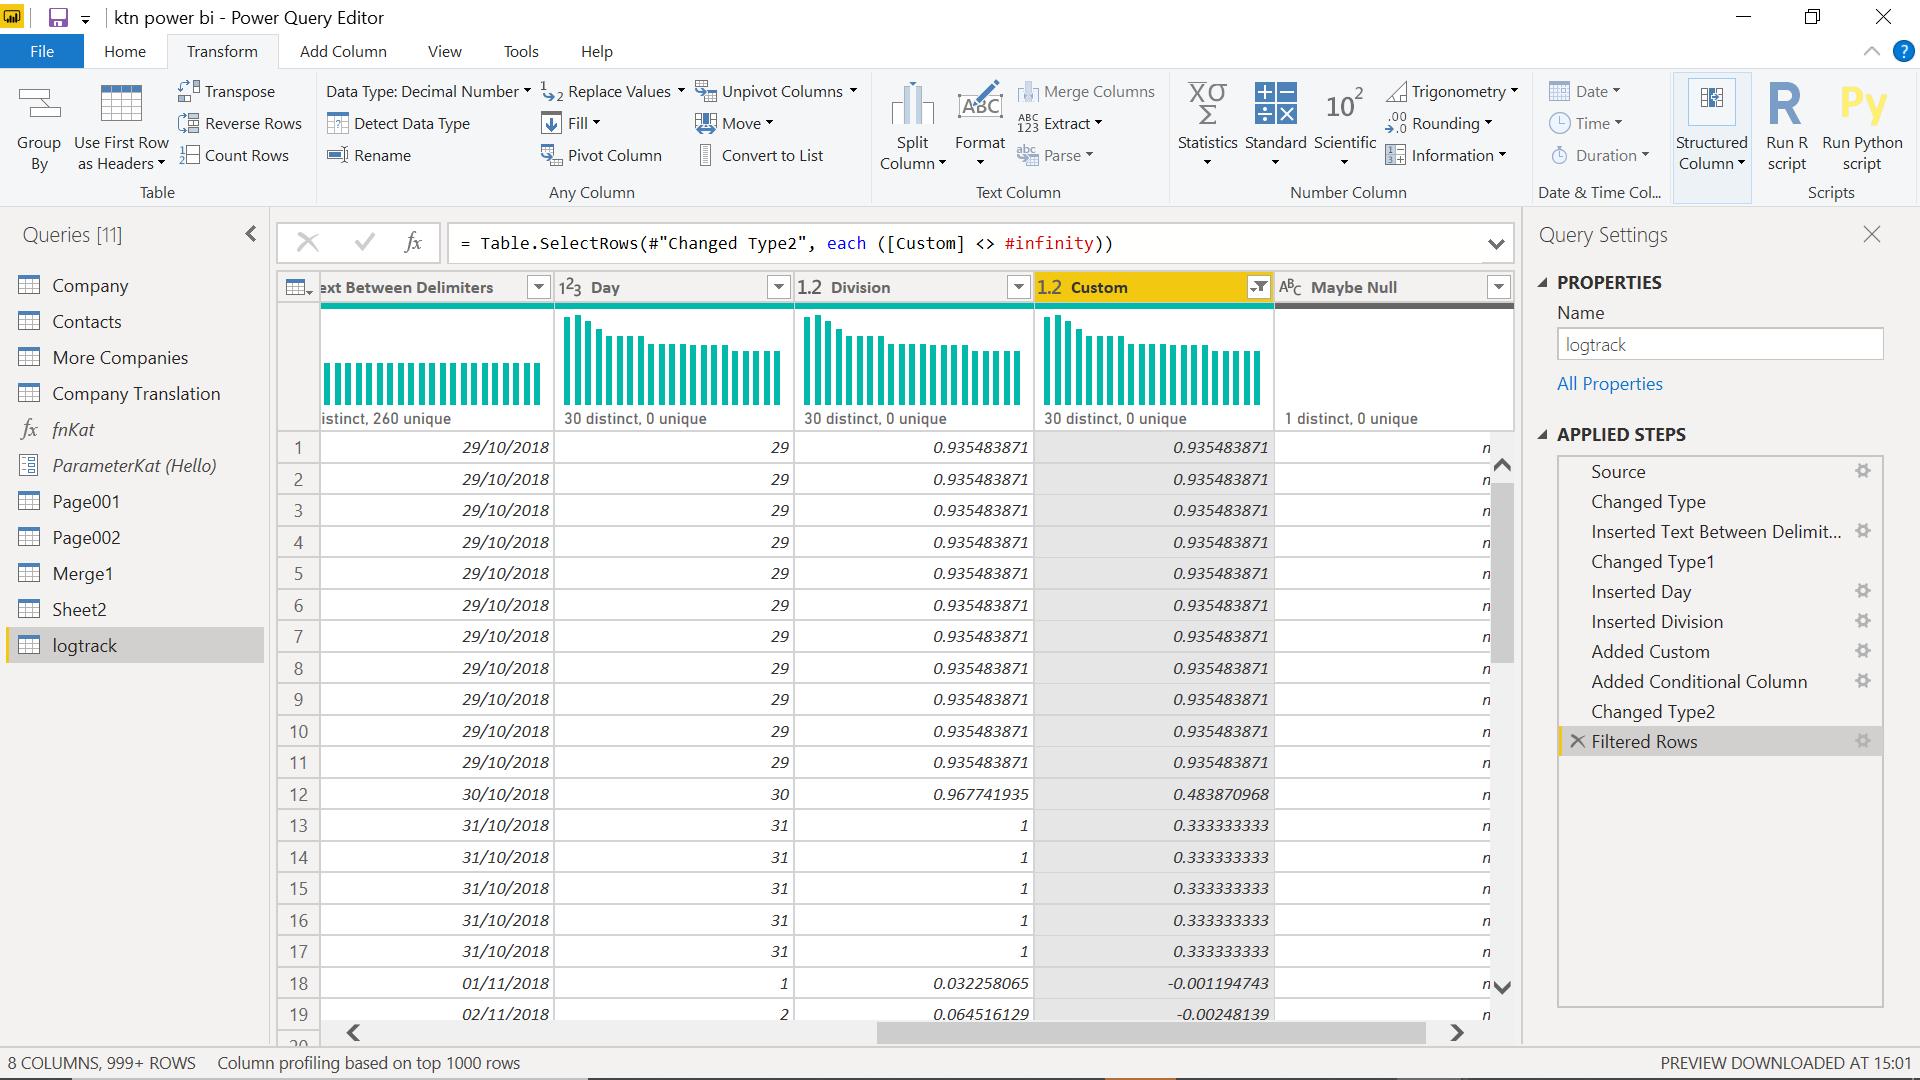
If I hover over the distribution information, I can see more data, and an ideas box, which suggests transforming my data.
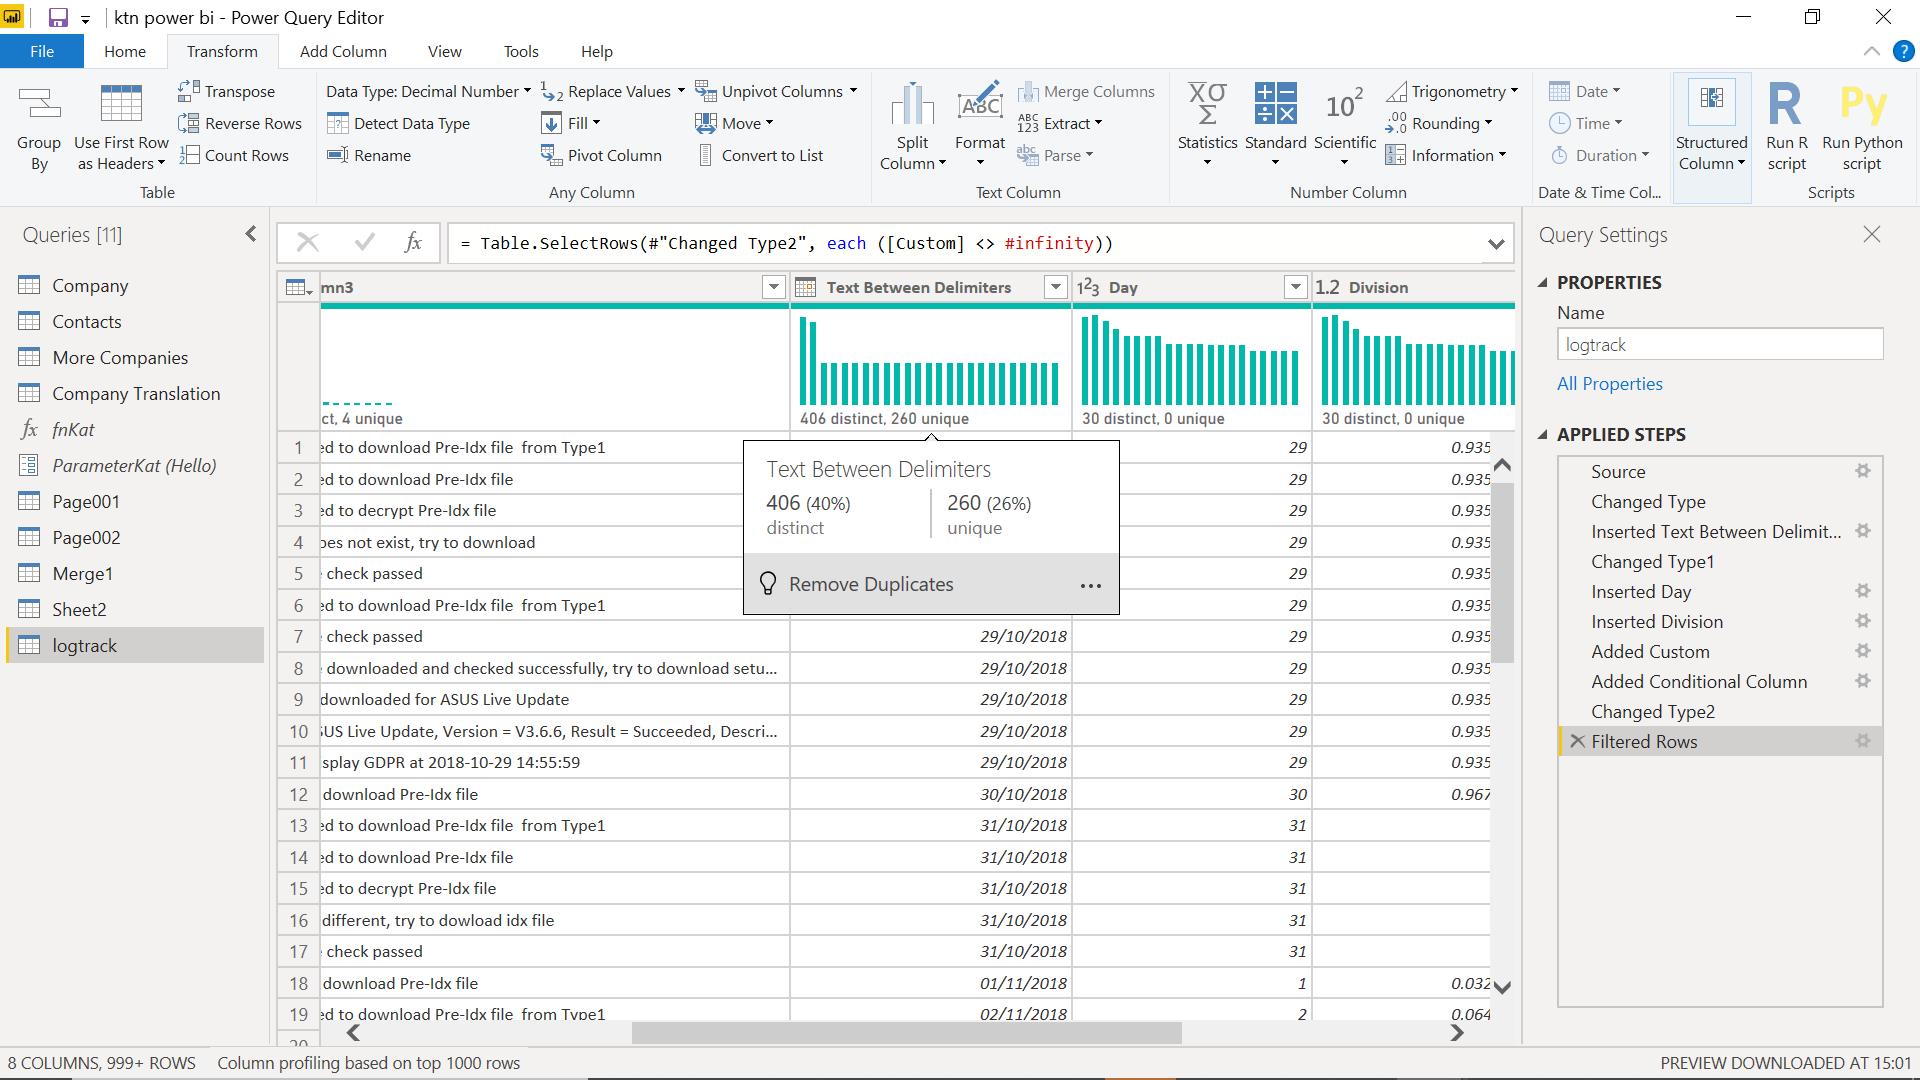
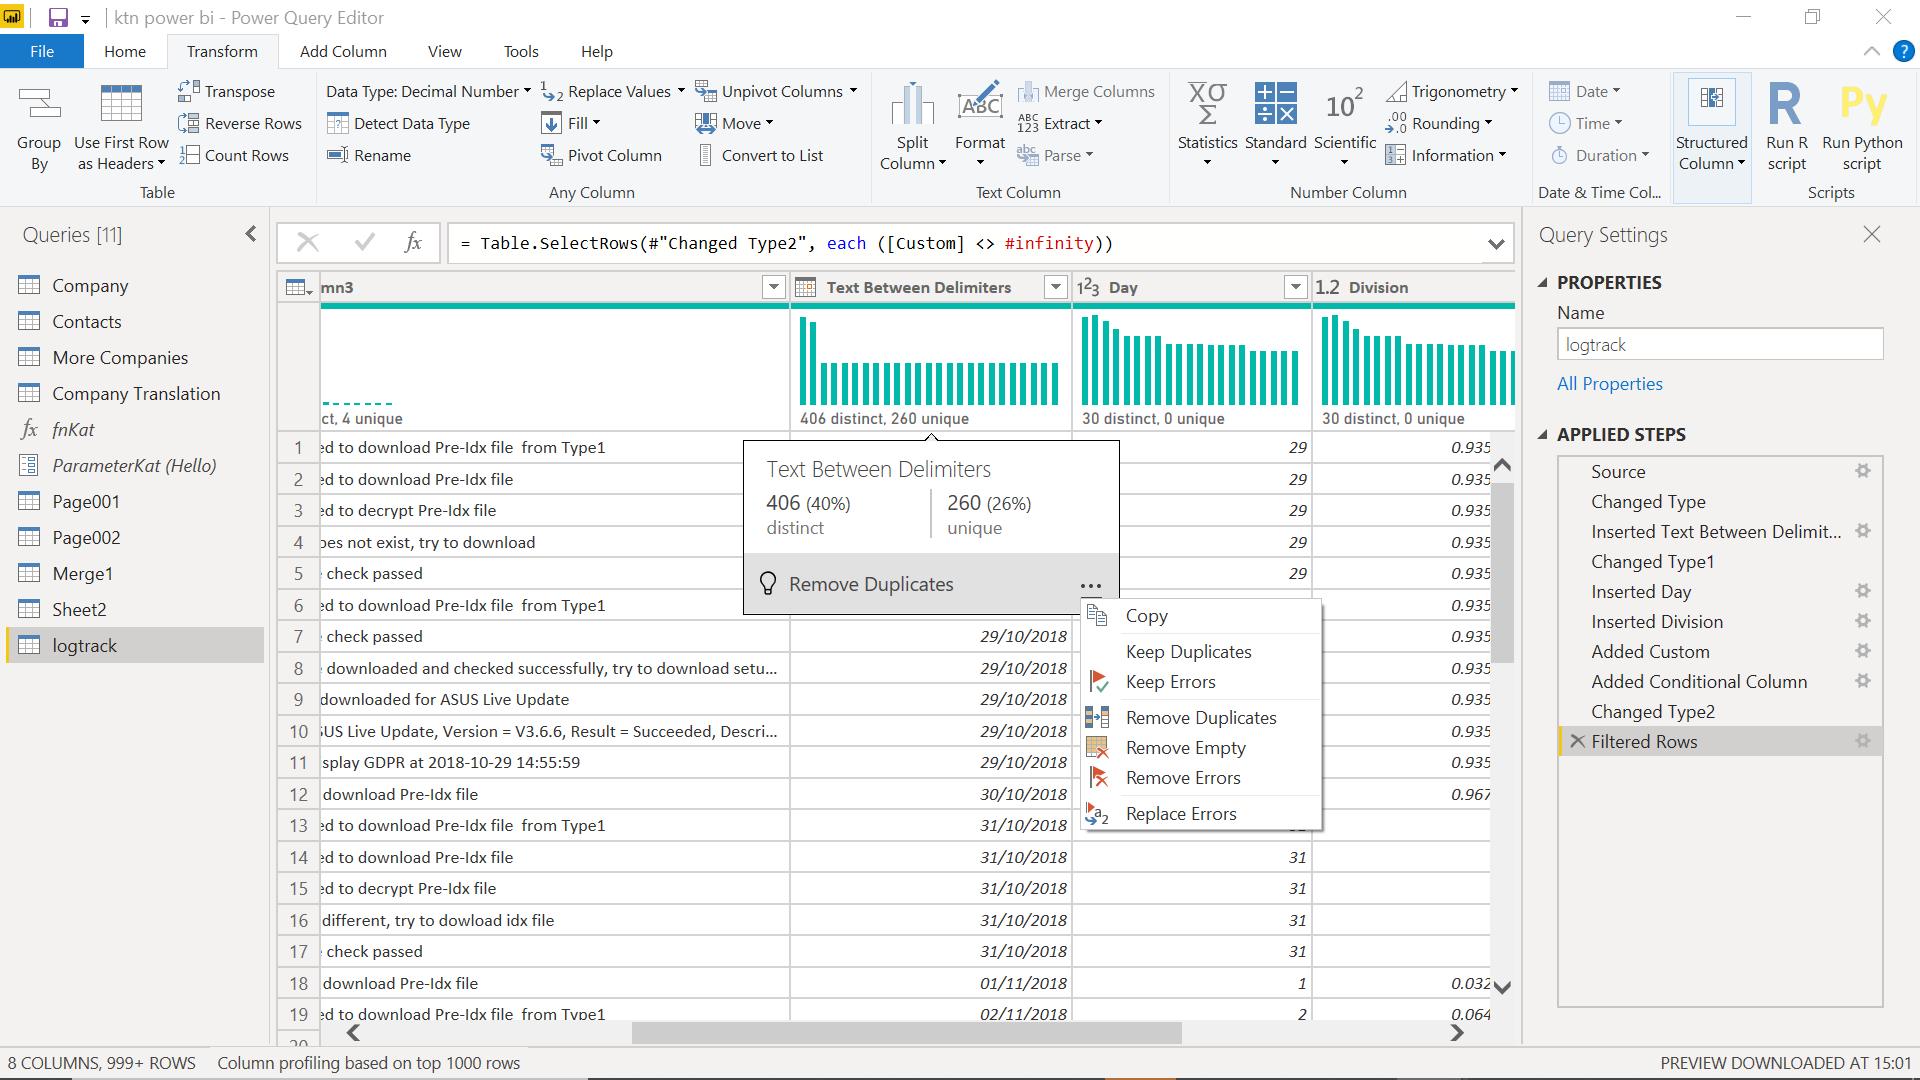
From here I can click on the ‘…’ next to ‘Remove Duplicates’ in order to access more Power Query options.
Next time I will look at Column Profile and Column Quality.
Come back next time for more ways to use Power Query!