
Power Query: Riveting Results Part 1
15 December 2021
Welcome to our Power Query blog. This week, I look at an example where I plan to use parameters.
My salespeople are taking a break. This week, I am looking at some exam results:
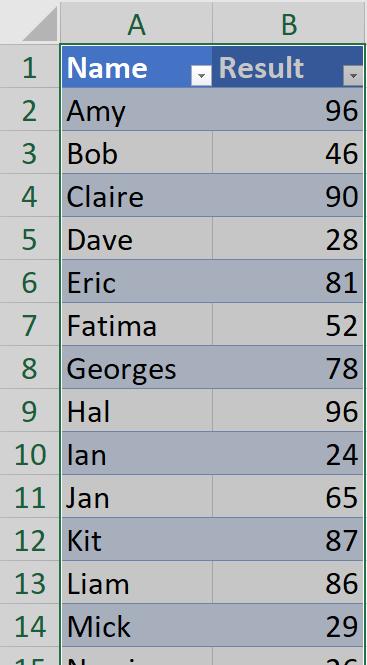
I will be grading the results and I will be using this example to explore parameters. I’ll start by extracting my data into Power Query, where I will create the grade column. To extract my data, I choose ‘From Table/Range’ from the ‘Get & Transform’ section of the Data tab.
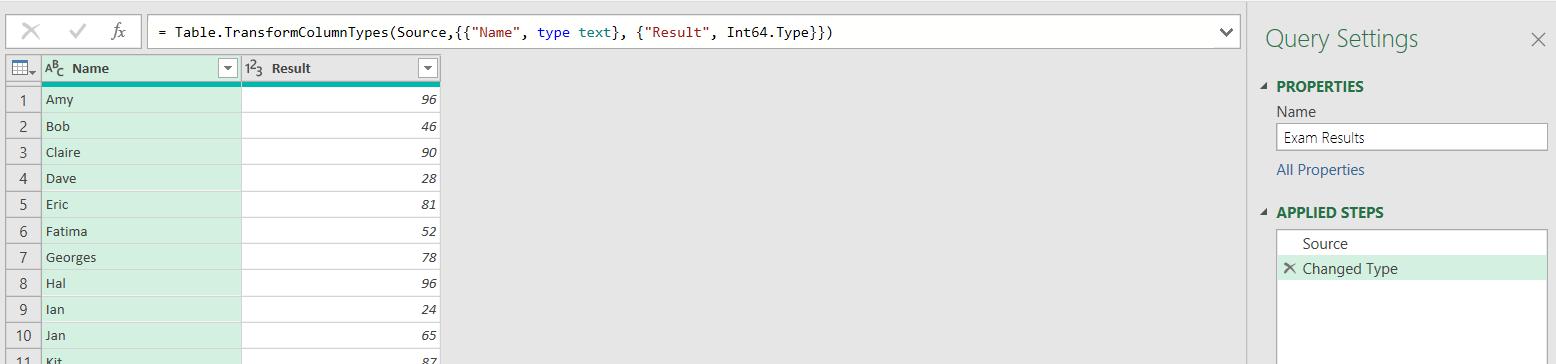
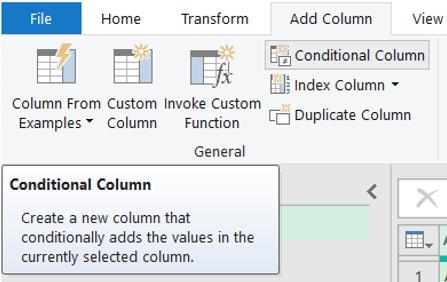
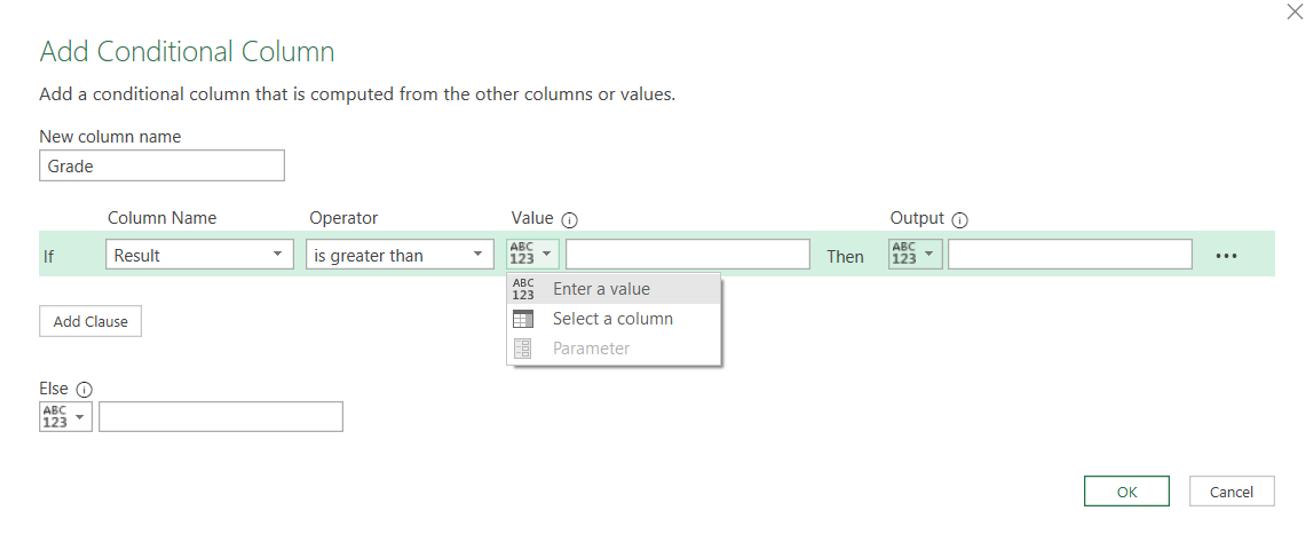
I have called my query Exam Results. I will begin by creating a Conditional Column from the ‘Add Column’ tab:
I call the new column Grade, and create the grade bands for the results. Each Clause will look at whether the Result ‘is greater than’ a Value, and I will start with the highest grade.
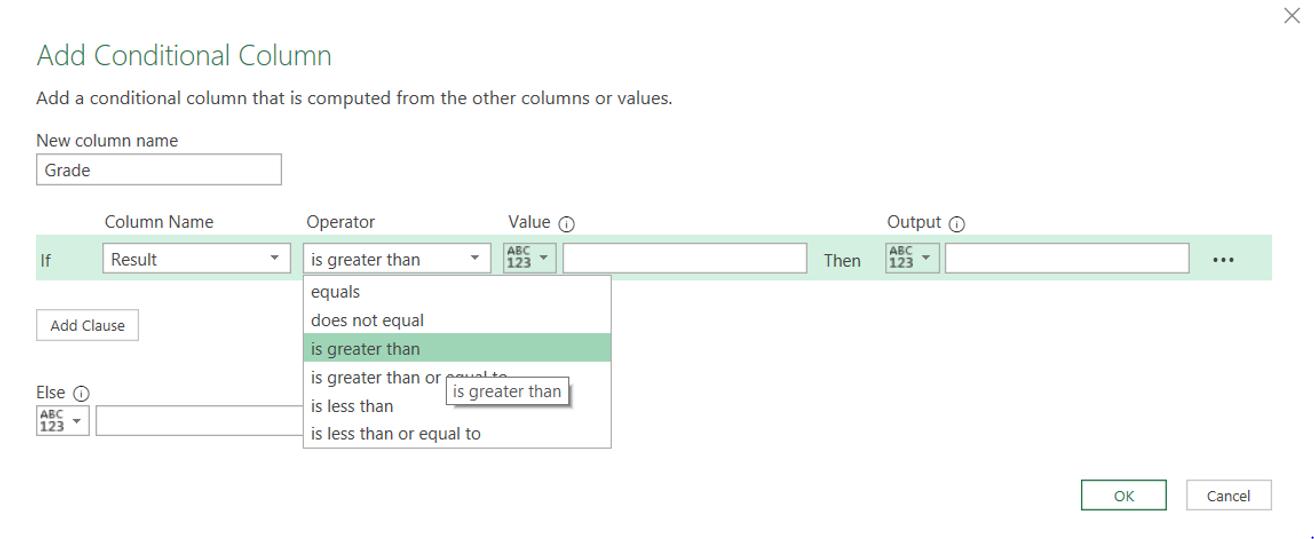
For now, I will be entering values, but I plan to replace this with parameters later.
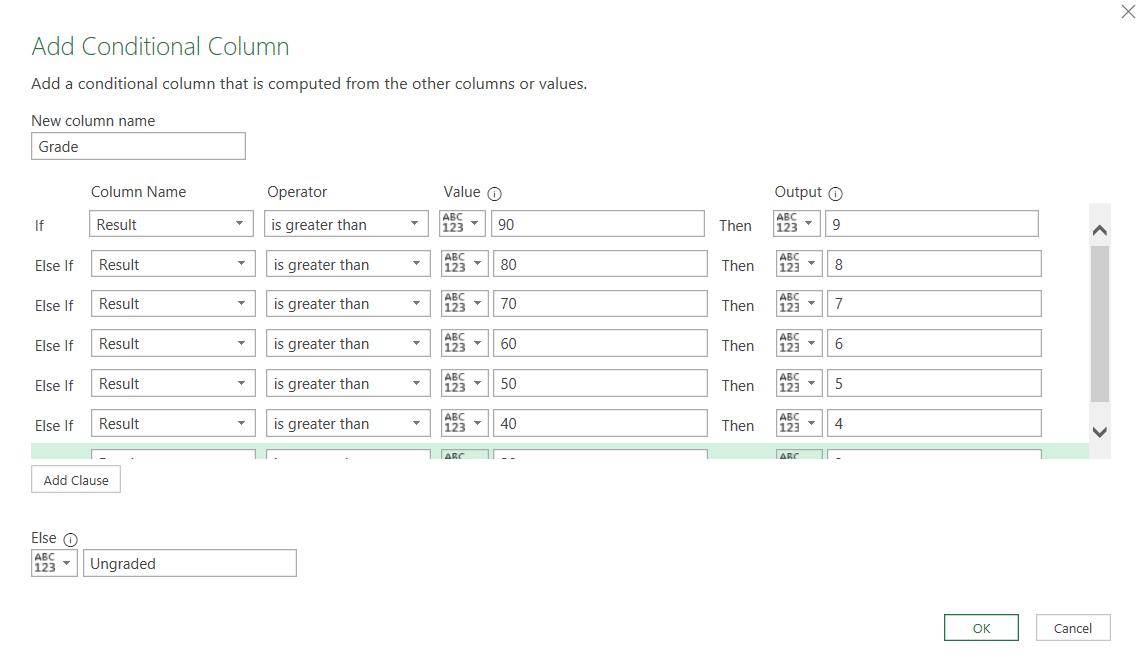
I create a Clause for each band.
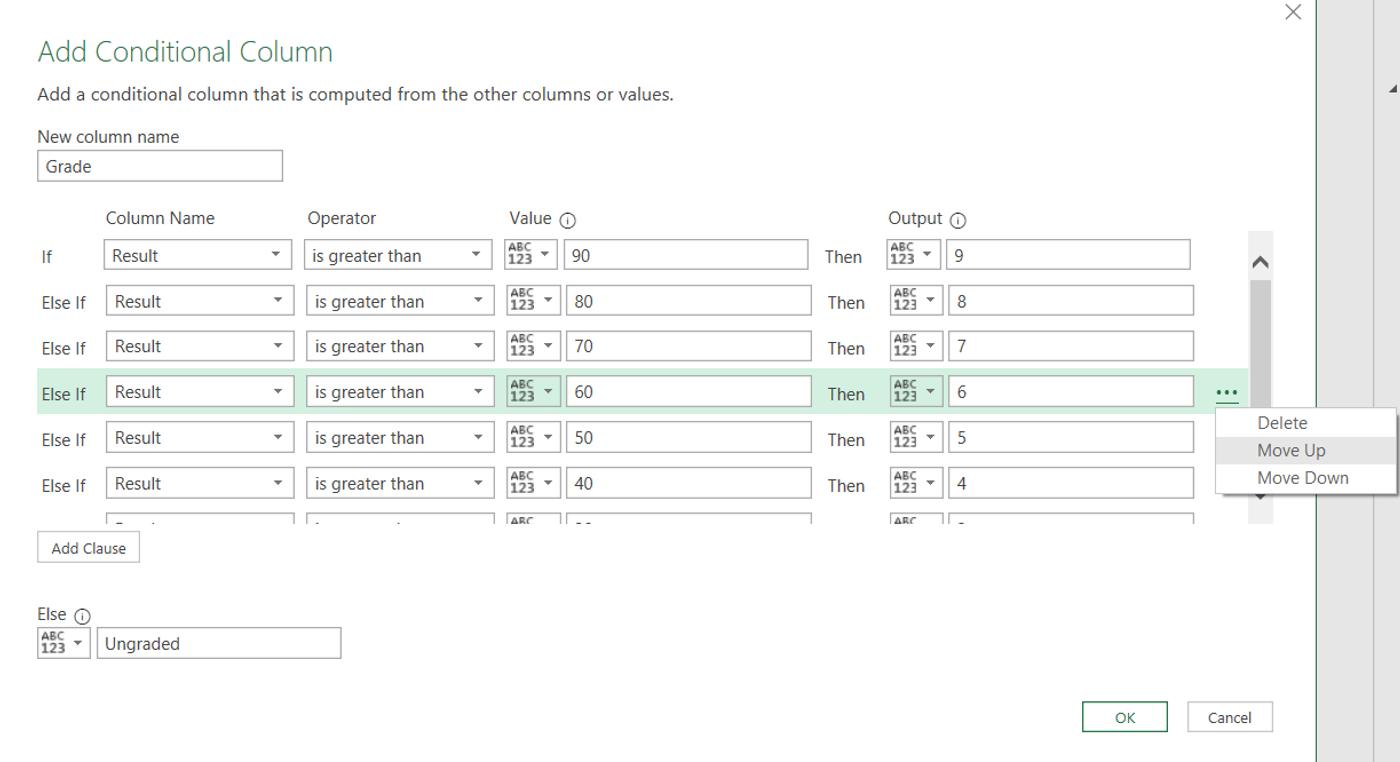
Note that, if I miss one, I can add it later and then change the order using the menu next to each Clause.
I click OK to see the new column:
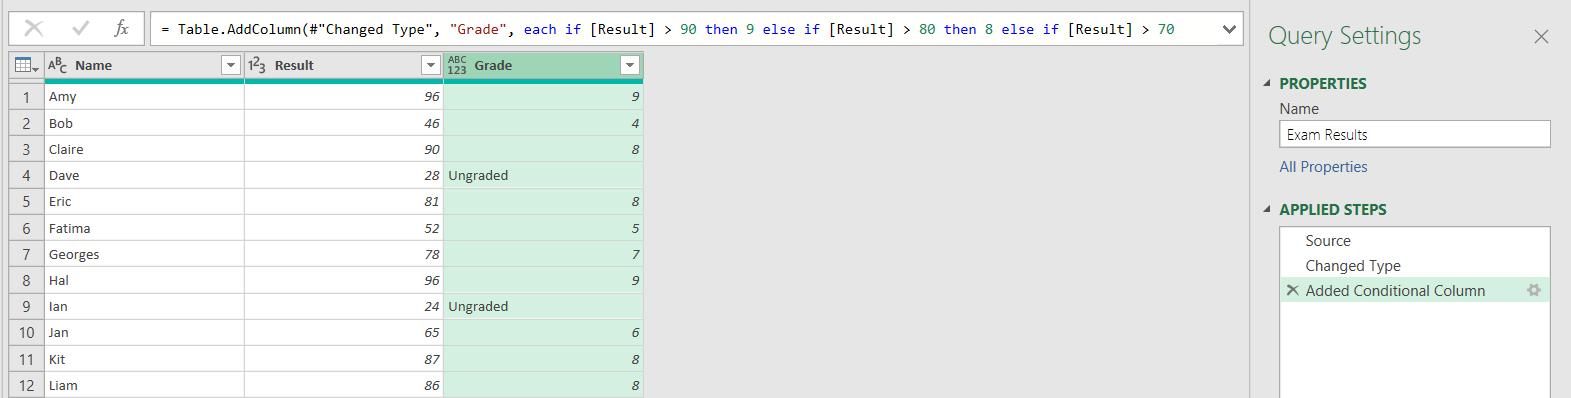
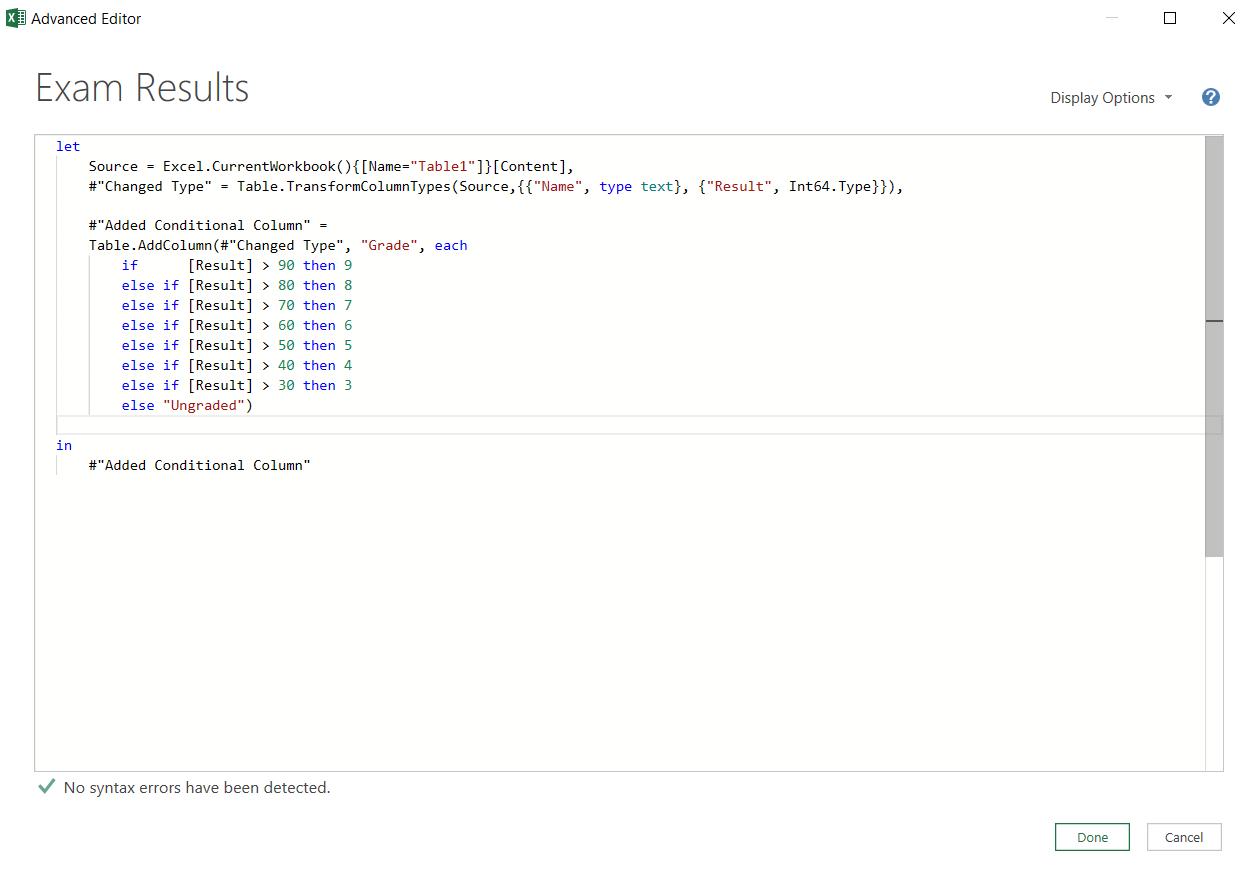
The M code generated for this step is as follows:
Table.AddColumn(#"Changed Type", "Grade", each if [Result] > 90 then 9 else if [Result] > 80 then 8 else if [Result] > 70 then 7 else if [Result] > 60 then 6 else if [Result] > 50 then 5 else if [Result] > 40 then 4 else if [Result] > 30 then 3 else "Ungraded")
I can change this in the Advanced Editor, which I access from the Home tab. I want to format it so that the boundaries are easier to see. I can split each step over any number of lines, a comma (,) or (as in this case) the ‘in’ statement indicates when the step is complete.
I am now ready to create some parameters to decide the grades.
Come back next time for more ways to use Power Query!