
Power Query: Mind the Large Overlap
24 June 2020
Welcome to our Power Query blog. This week, I look at a more efficient method to spot overlapping periods.
I start with the same data as last week. My salespeople have recorded their time spent with suppliers, but there appear to be some discrepancies!
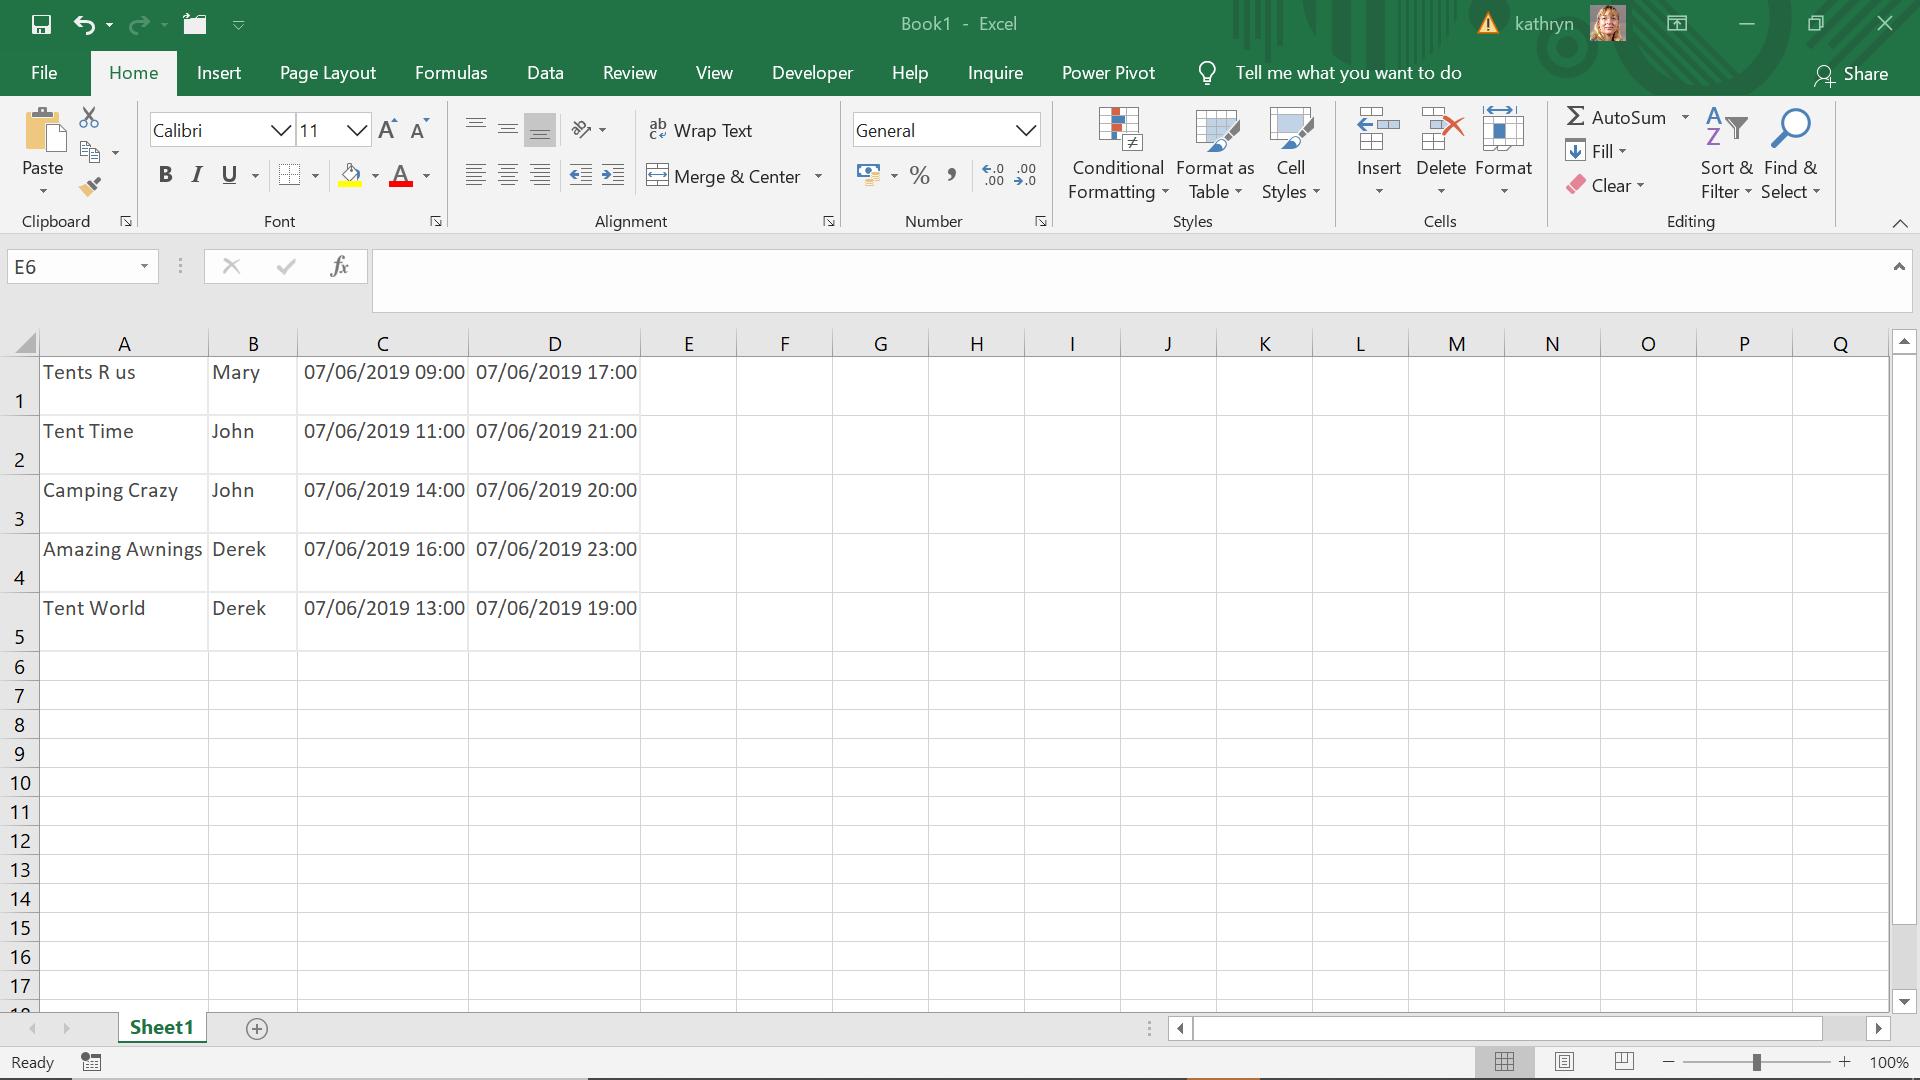
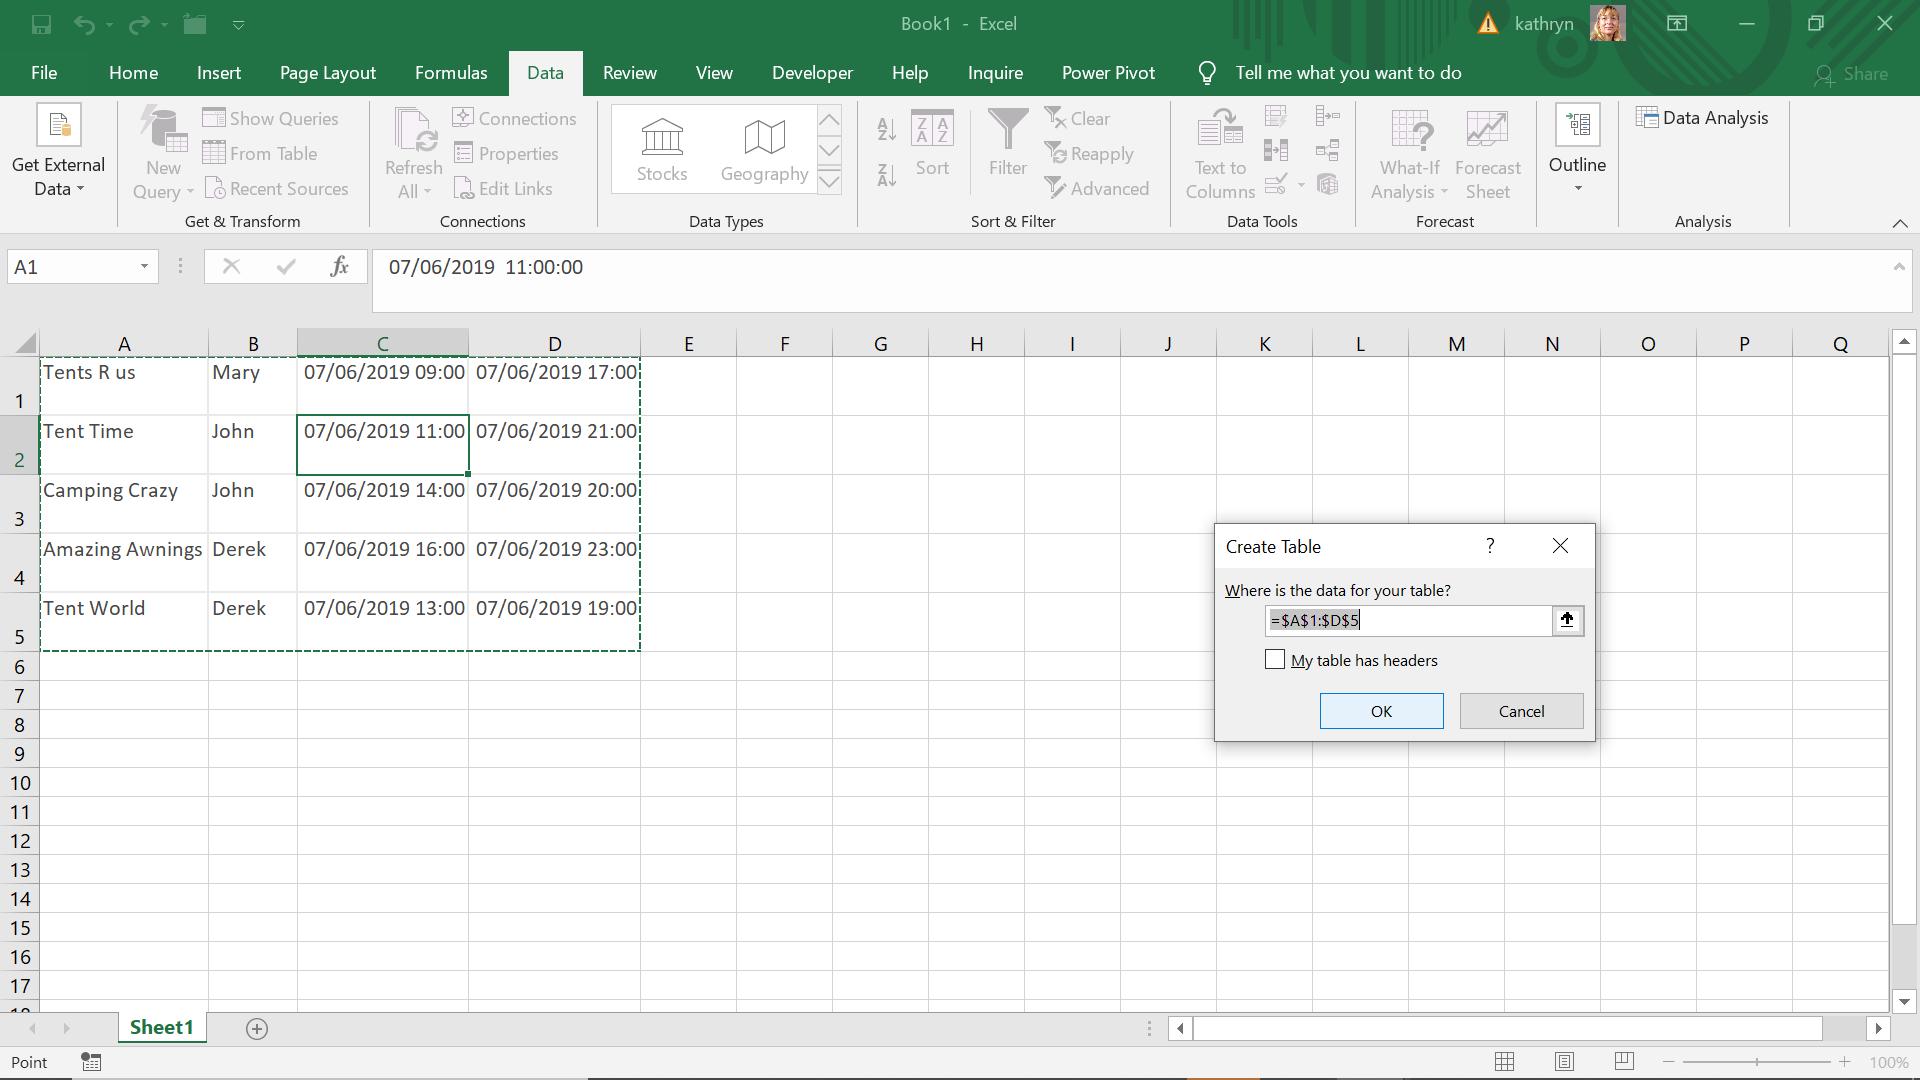
Clearly, there is some overlap, and I intend to show this using Power Query. To begin, I extract my data to Power Query using ‘From Table’ in the ‘Get & Transform’ section of the Data tab.
I will name the headings once I get into Power Query:
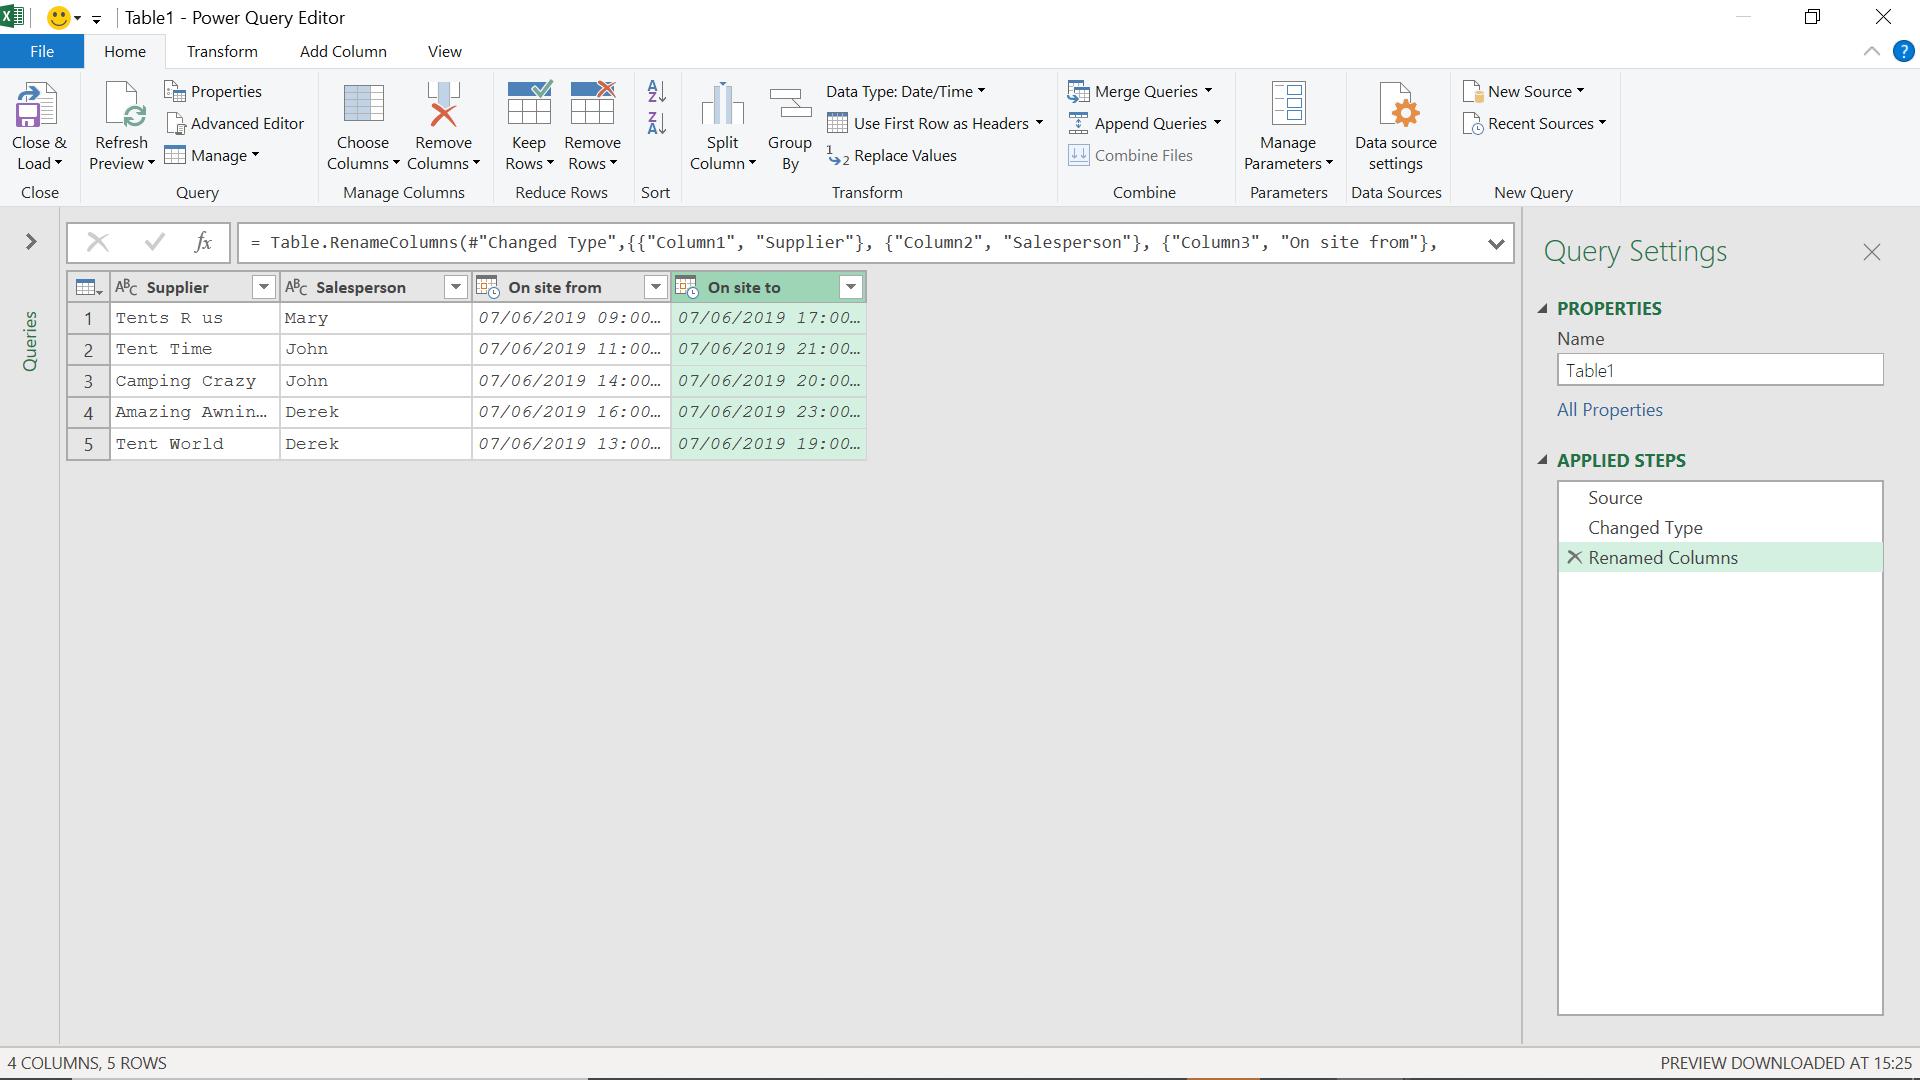
I need to calculate the overlapping time for each salesperson.
This time, instead of following the standard cartesian product method, which took me from five (5) to 25 rows, I am going to use a function which will consider the salesperson and supplier involved at an earlier stage, thereby reducing the number of rows generated.
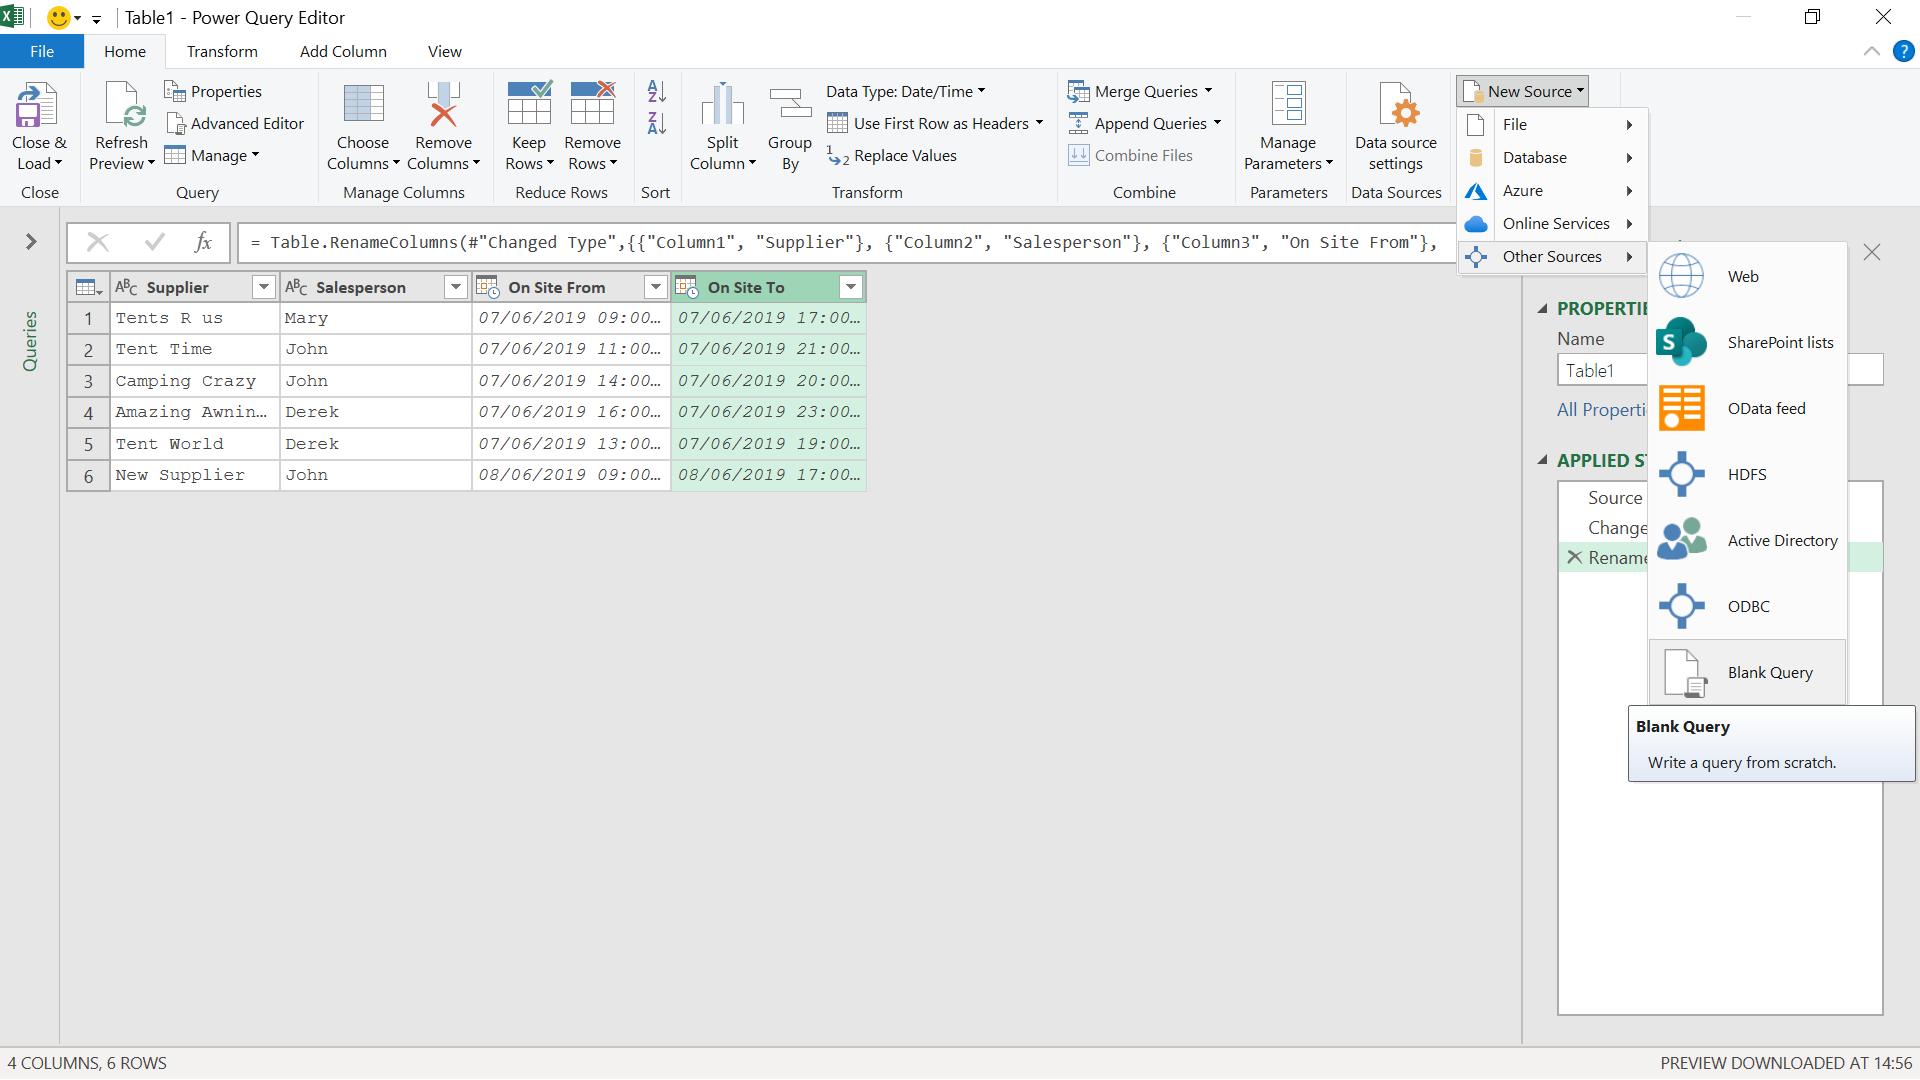
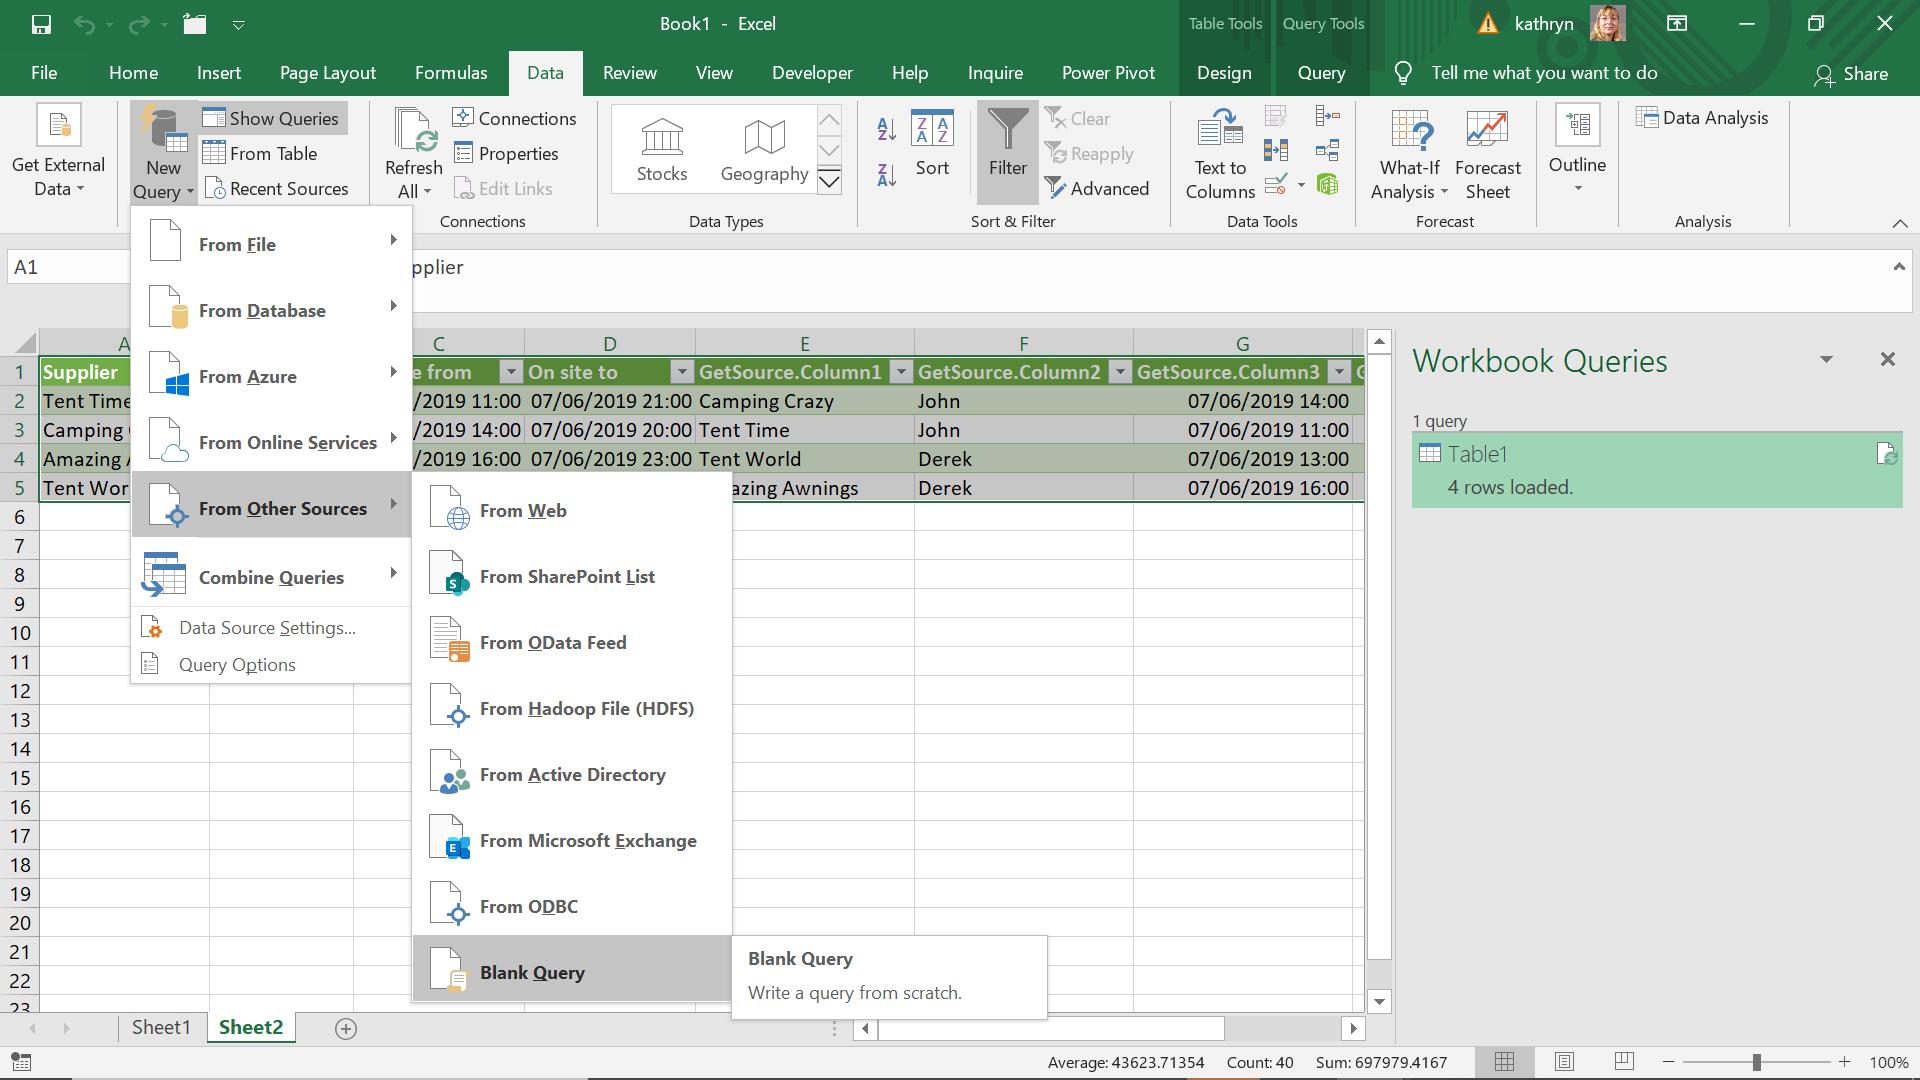
I start with a new blank query, which I can access from the ‘New Query’ section of the Home tab, under the ‘New Source’ option.
I create a new blank query and open the Advanced Editor.
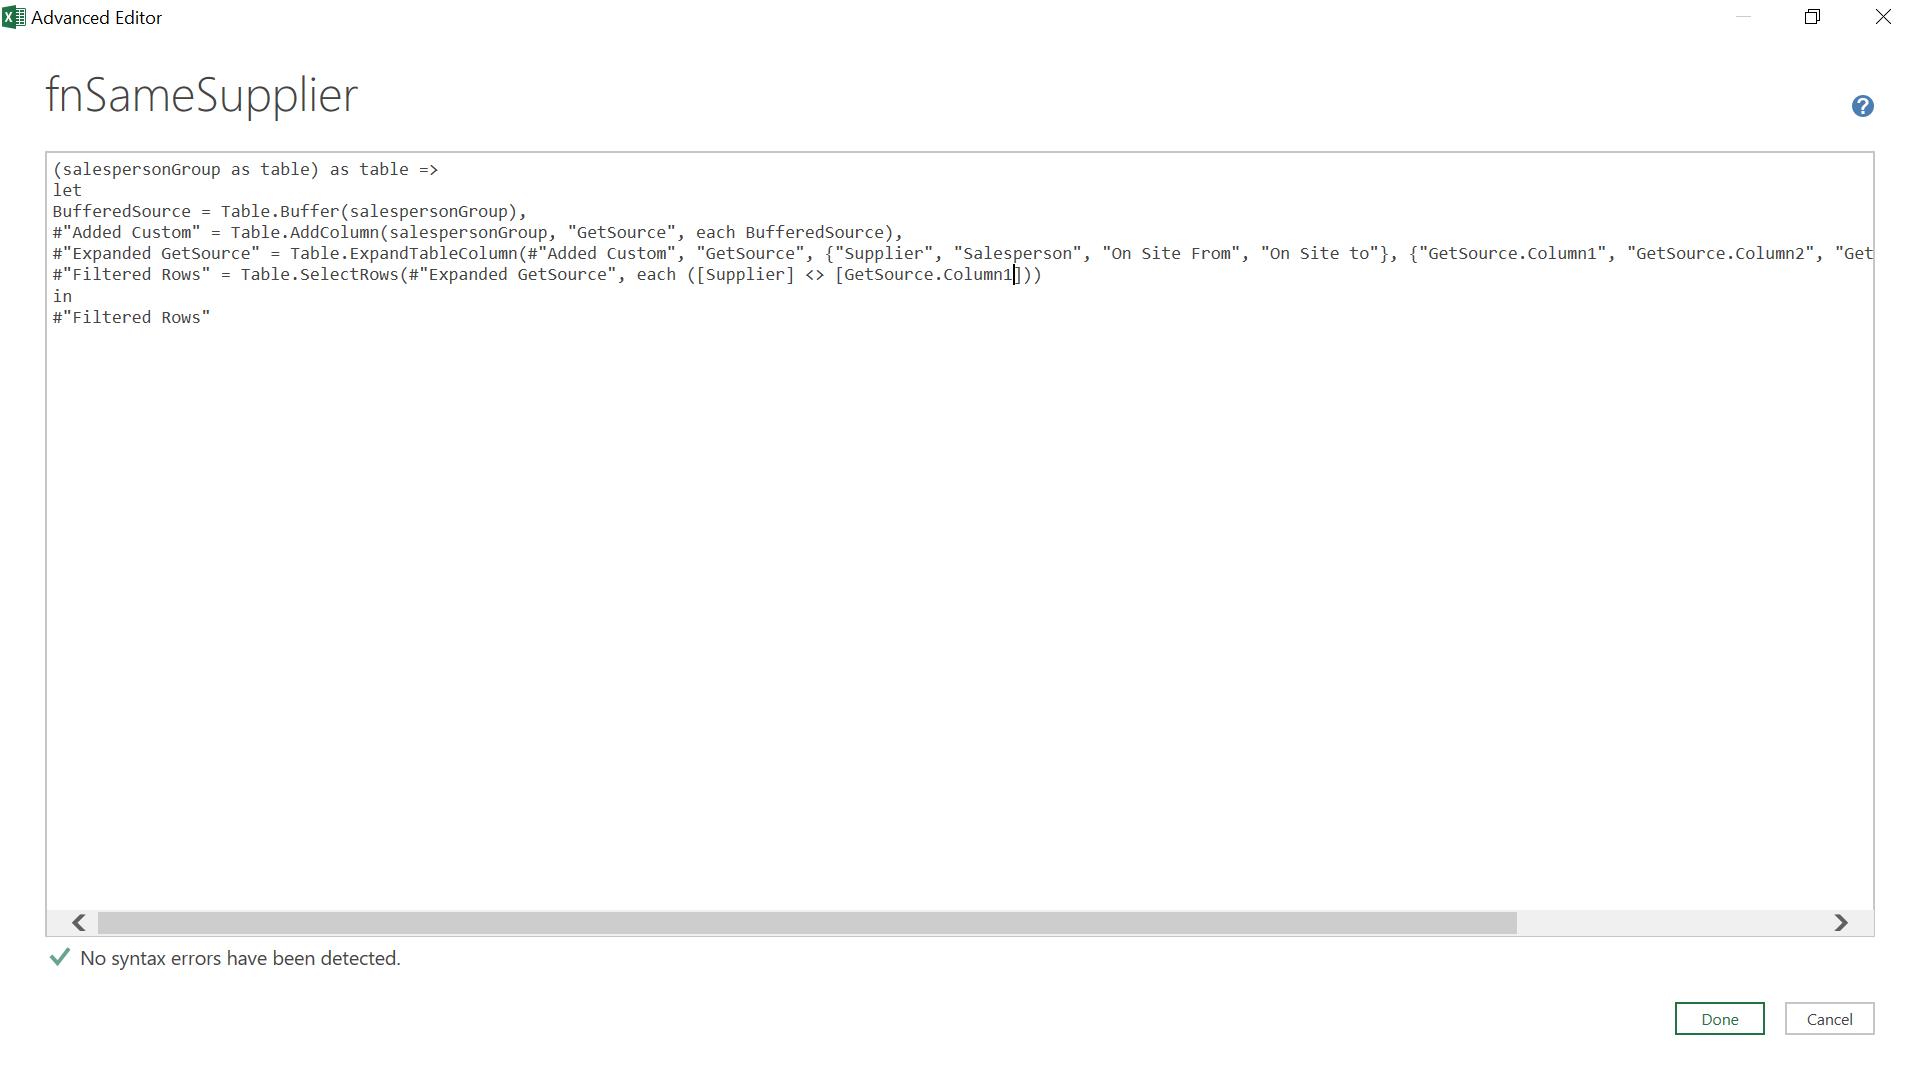
The M code I have used is
(salespersonGroup as table) as table =>
let
BufferedSource = Table.Buffer(salespersonGroup),
#"Added Custom" = Table.AddColumn(salespersonGroup, "GetSource", each BufferedSource),
#"Expanded GetSource" = Table.ExpandTableColumn(#"Added Custom", "GetSource", {"Supplier", "Salesperson", "On Site From", "On Site to"}, {"GetSource.Column1", "GetSource.Column2", "GetSource.Column3", "GetSource.Column4"}),
#"Filtered Rows" = Table.SelectRows(#"Expanded GetSource", each ([Supplier] <> [GetSource.Column1]))
in
#"Filtered Rows"
This creates a new function:
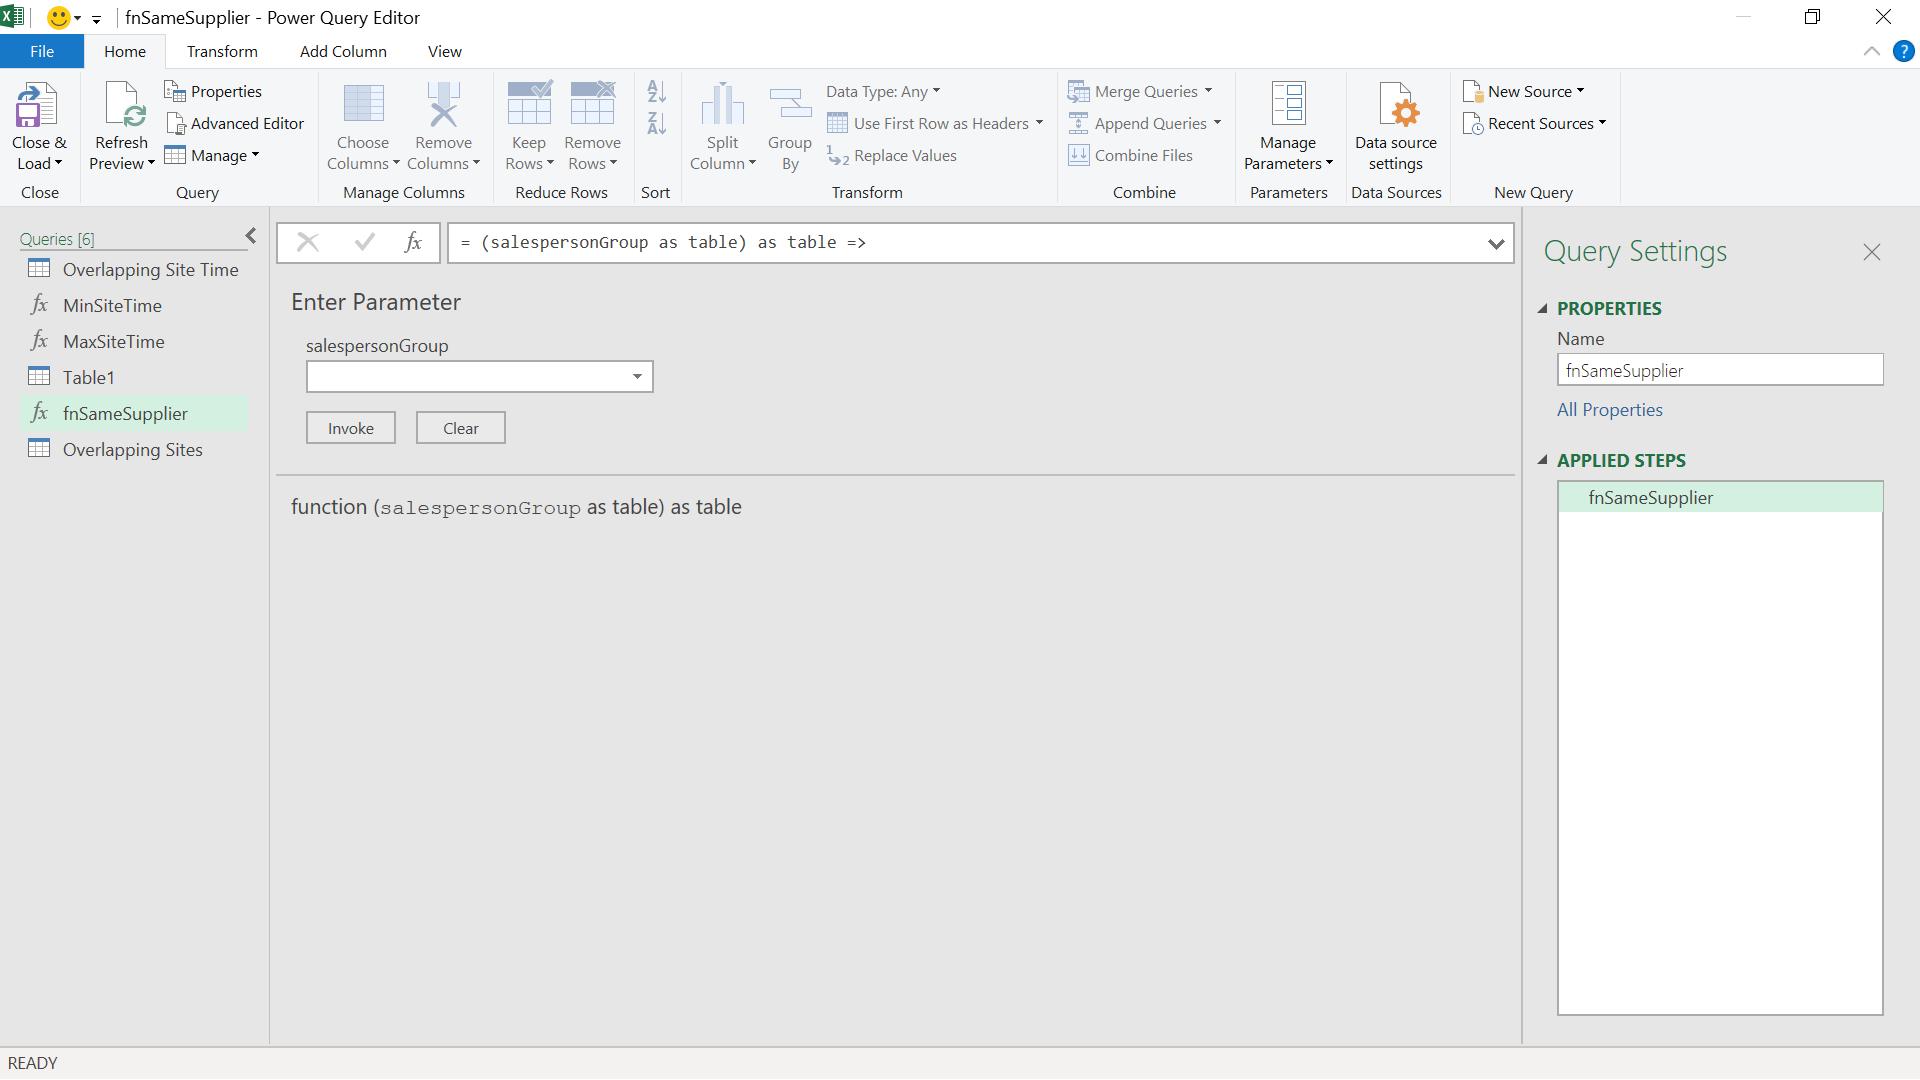
I call my new query fnSameSupplier, as I am carrying out the same steps that I did last week by creating a link to GetSource, but I am doing this in a buffer and not actually creating the rows. I then select those rows with the same supplier. Having created my function, I go back to my original query.
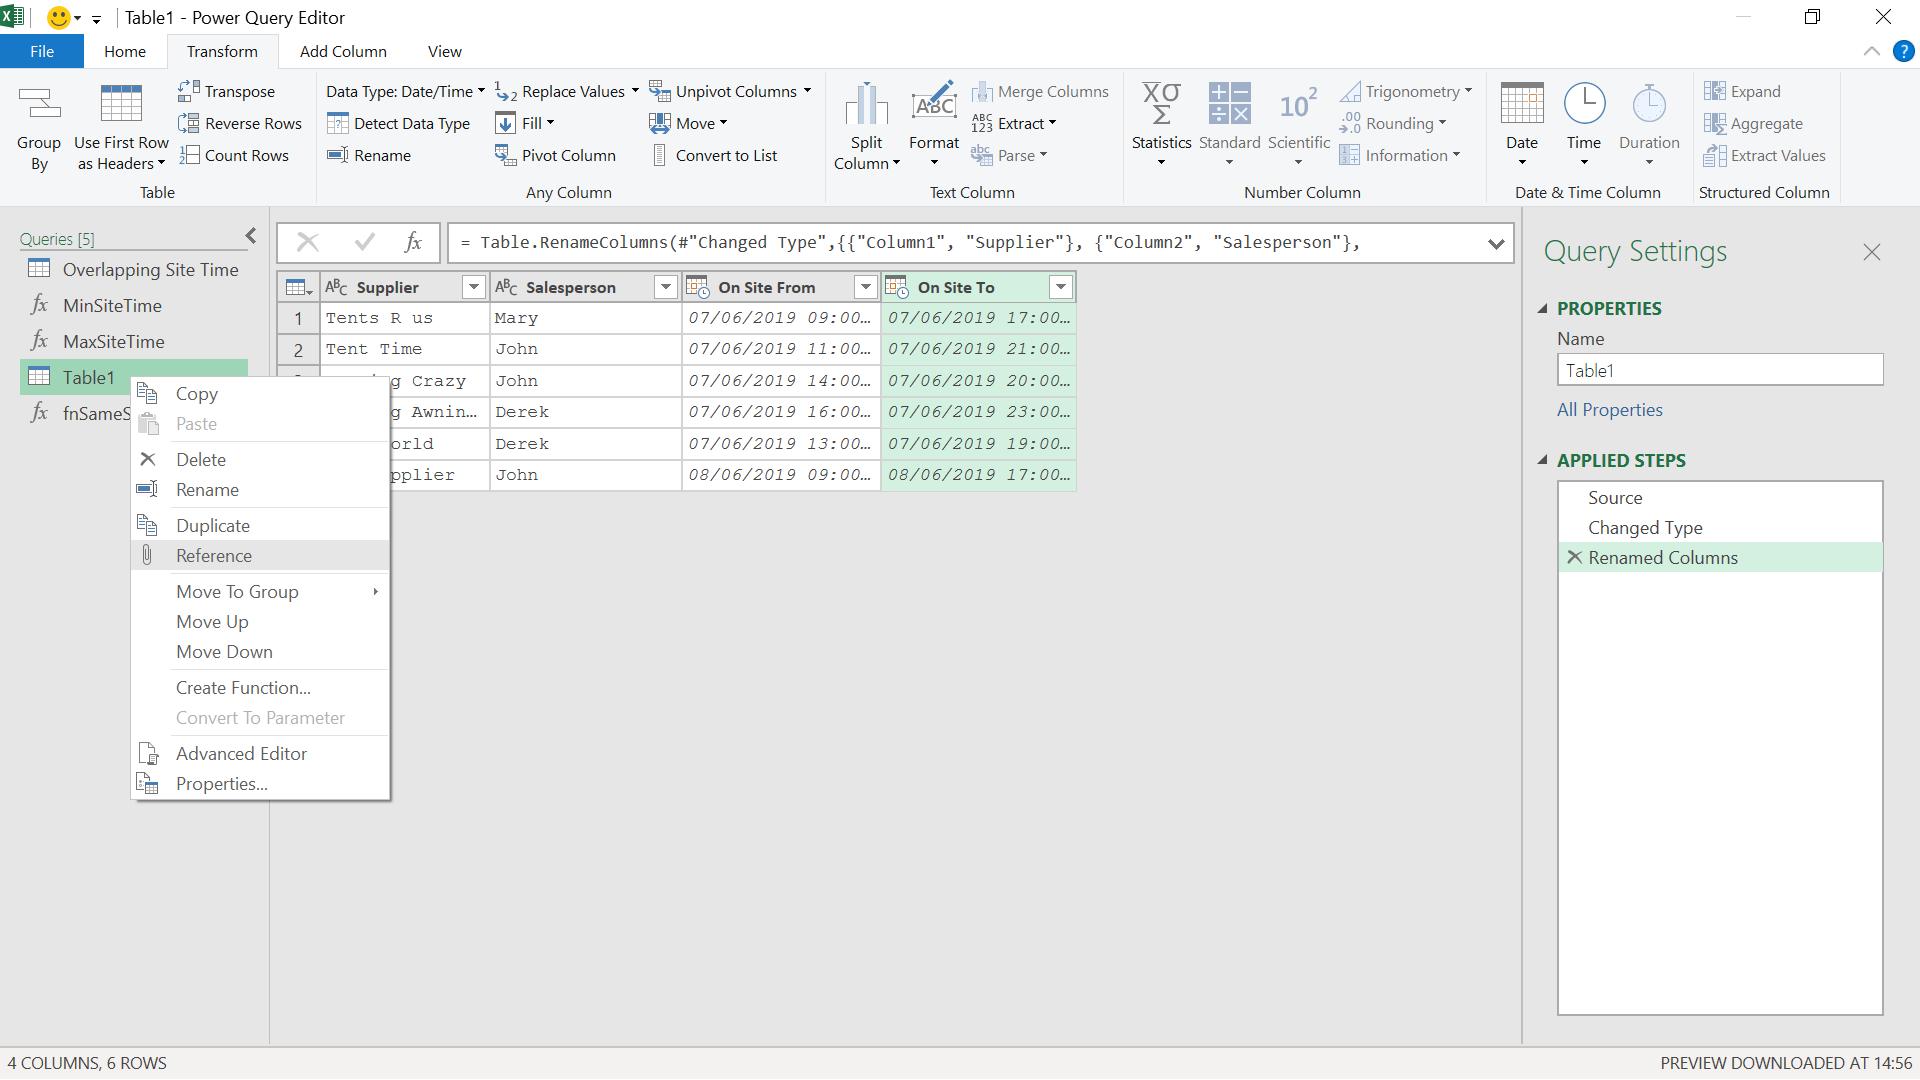
I am going to create a reference query which I will group according to Salesperson. I call my reference query ‘Overlapping Sites’.
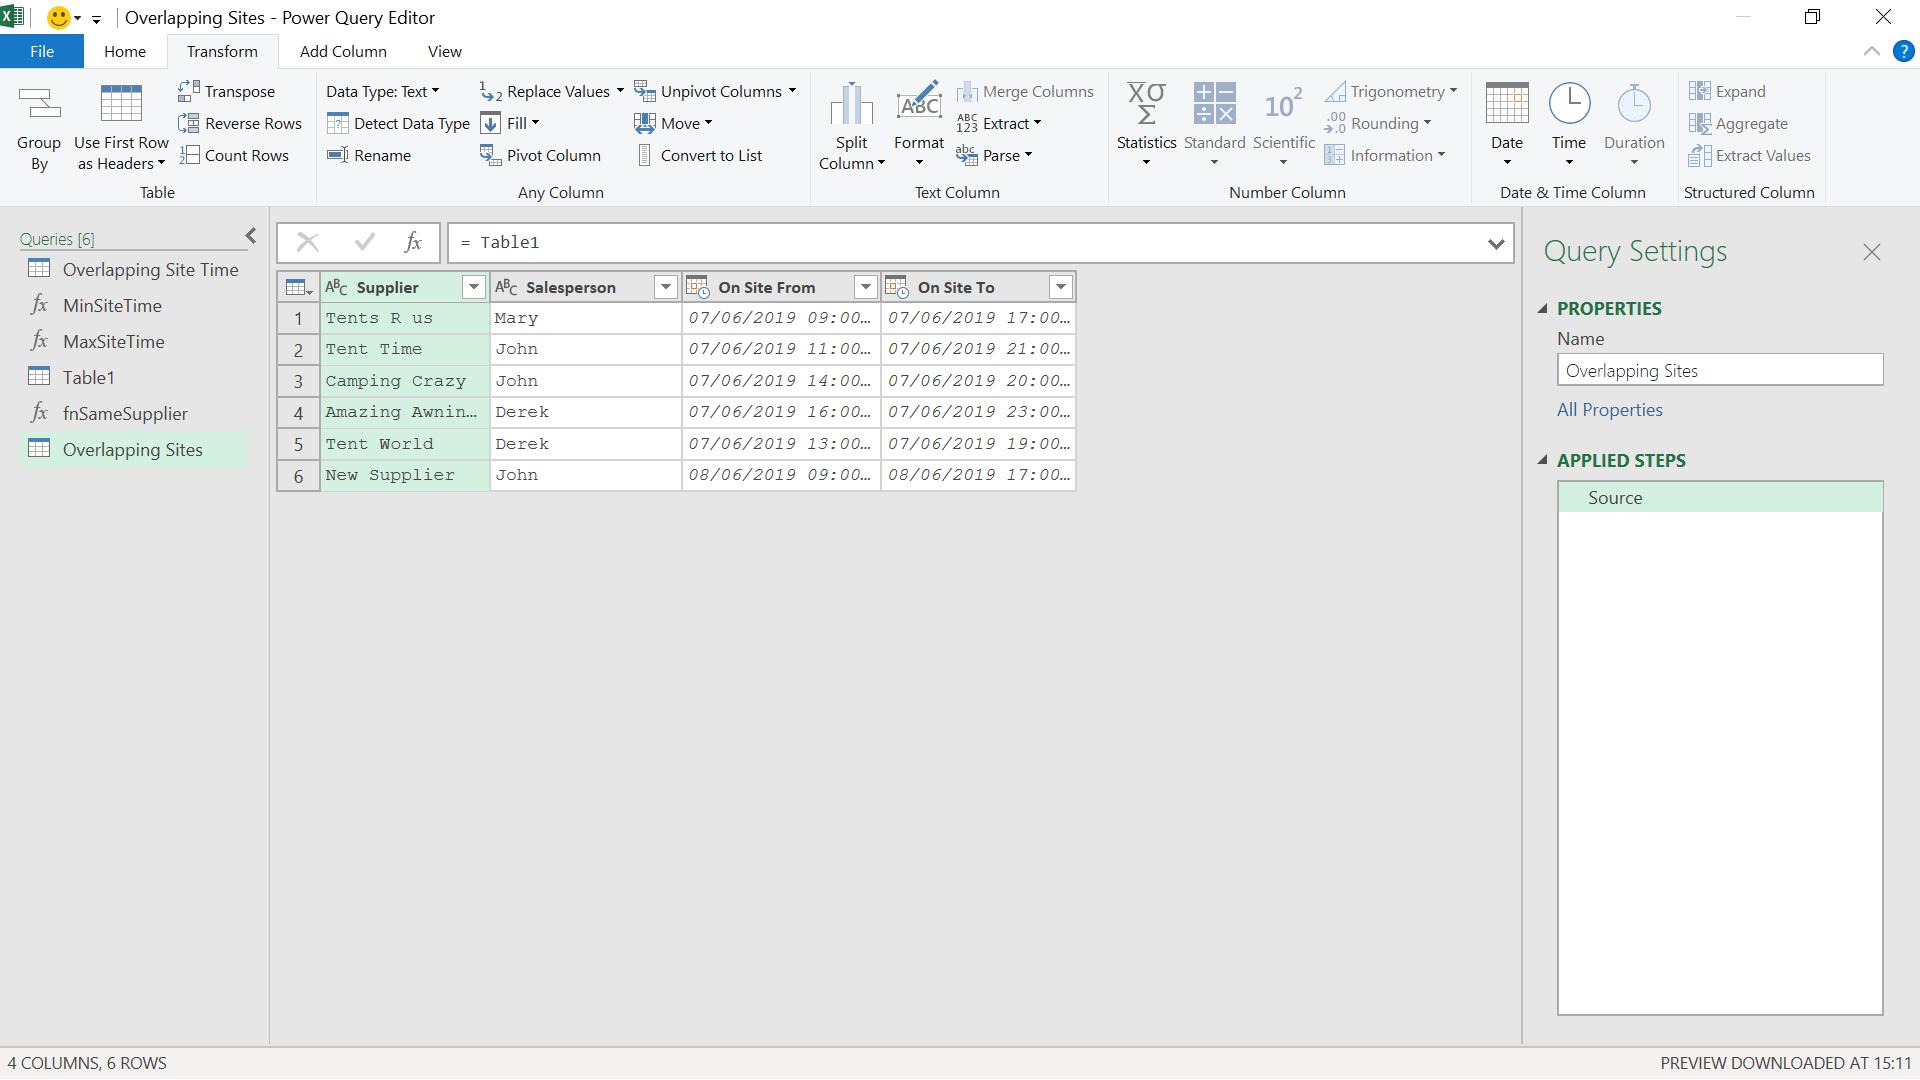
I will group ‘Overlapping Sites’ by Salesperson.
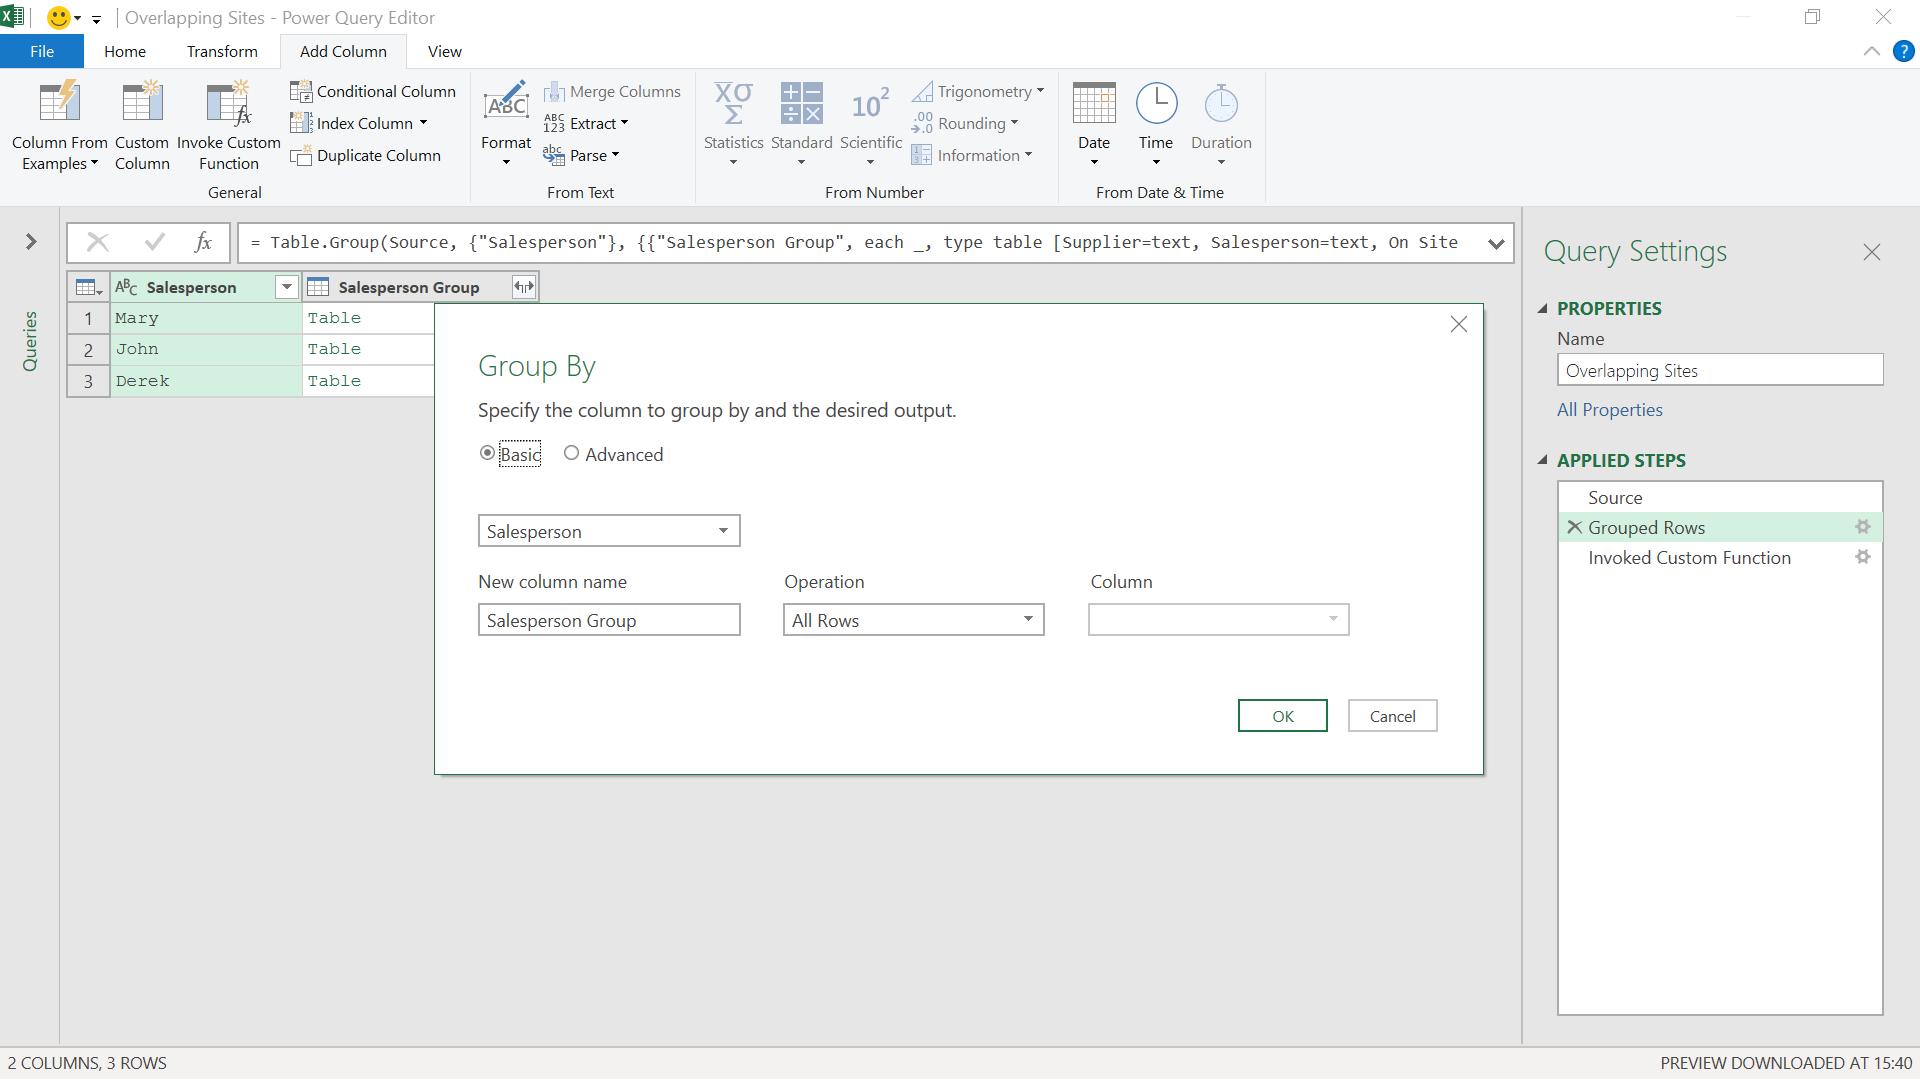
Using the ‘Group By’ option on the Transform tab, I group all rows by Salesperson and call the new column ‘Salesperson Group’.
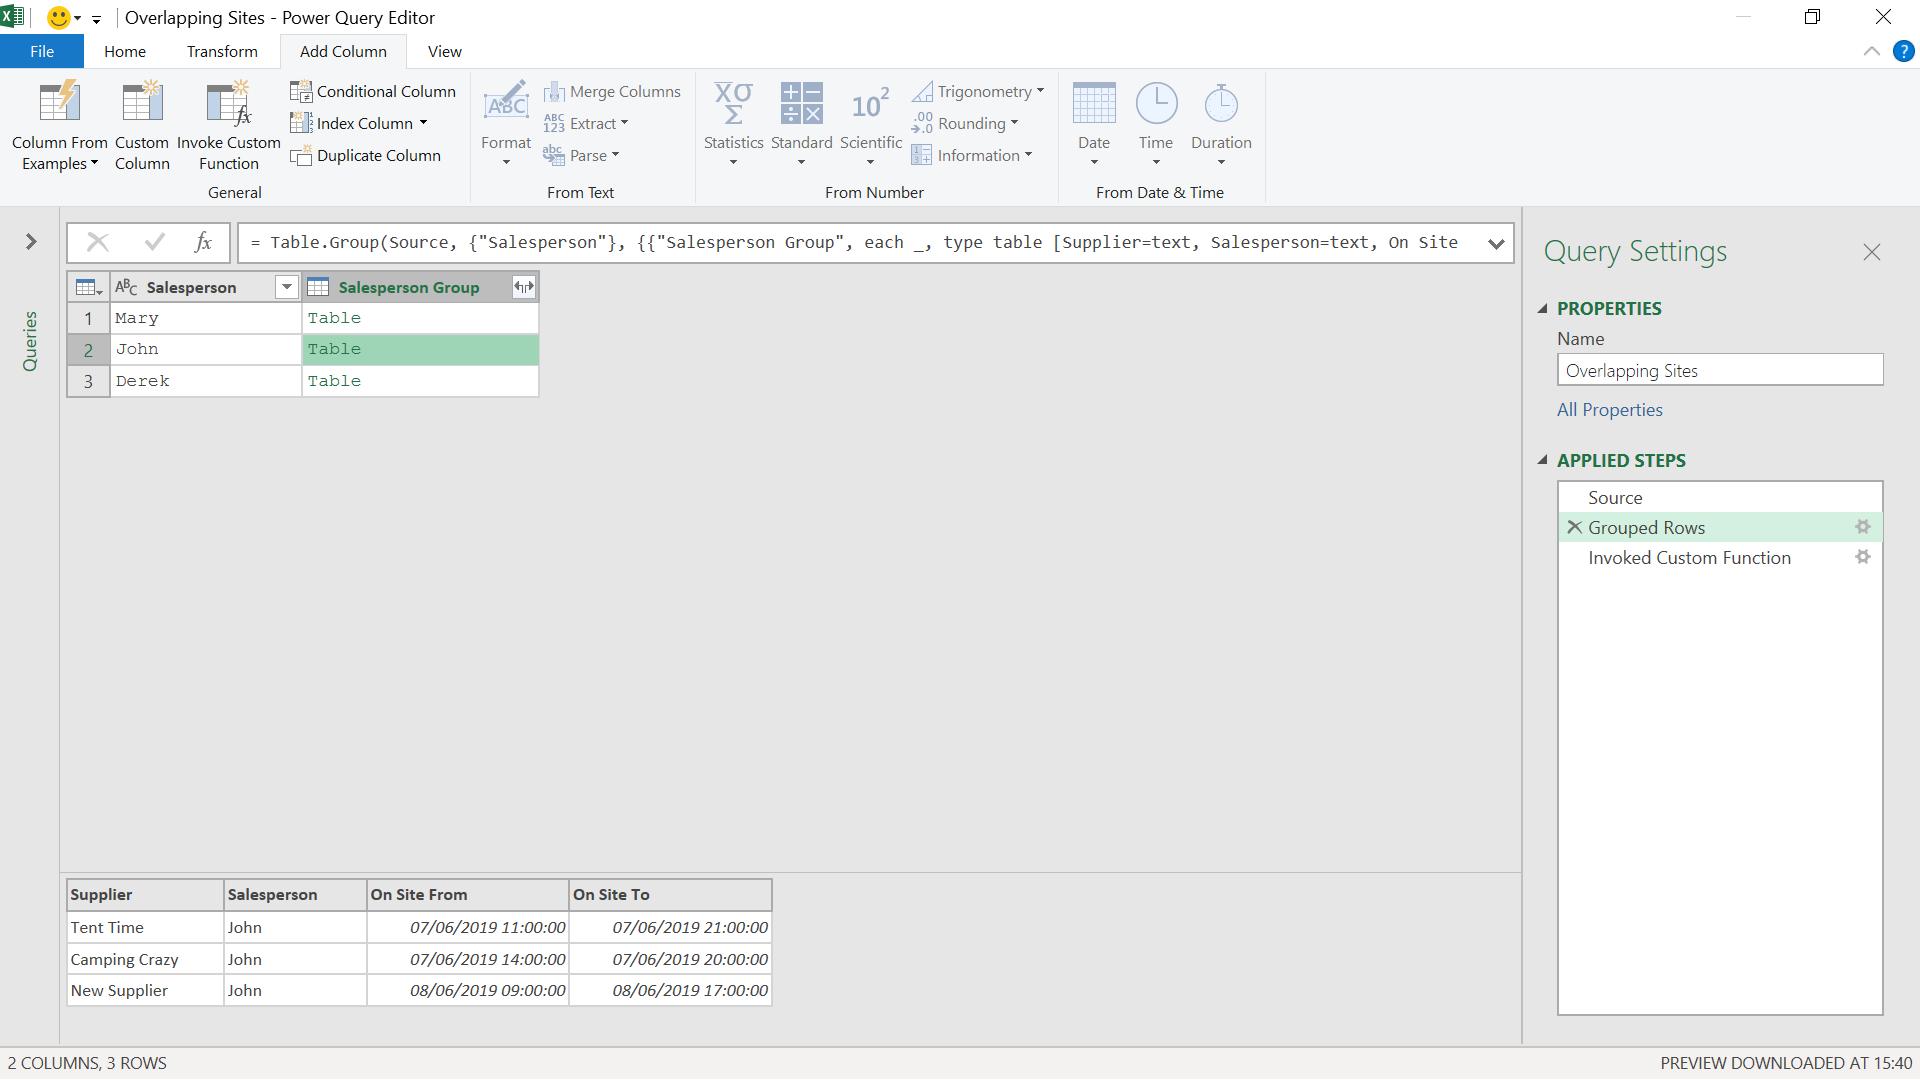
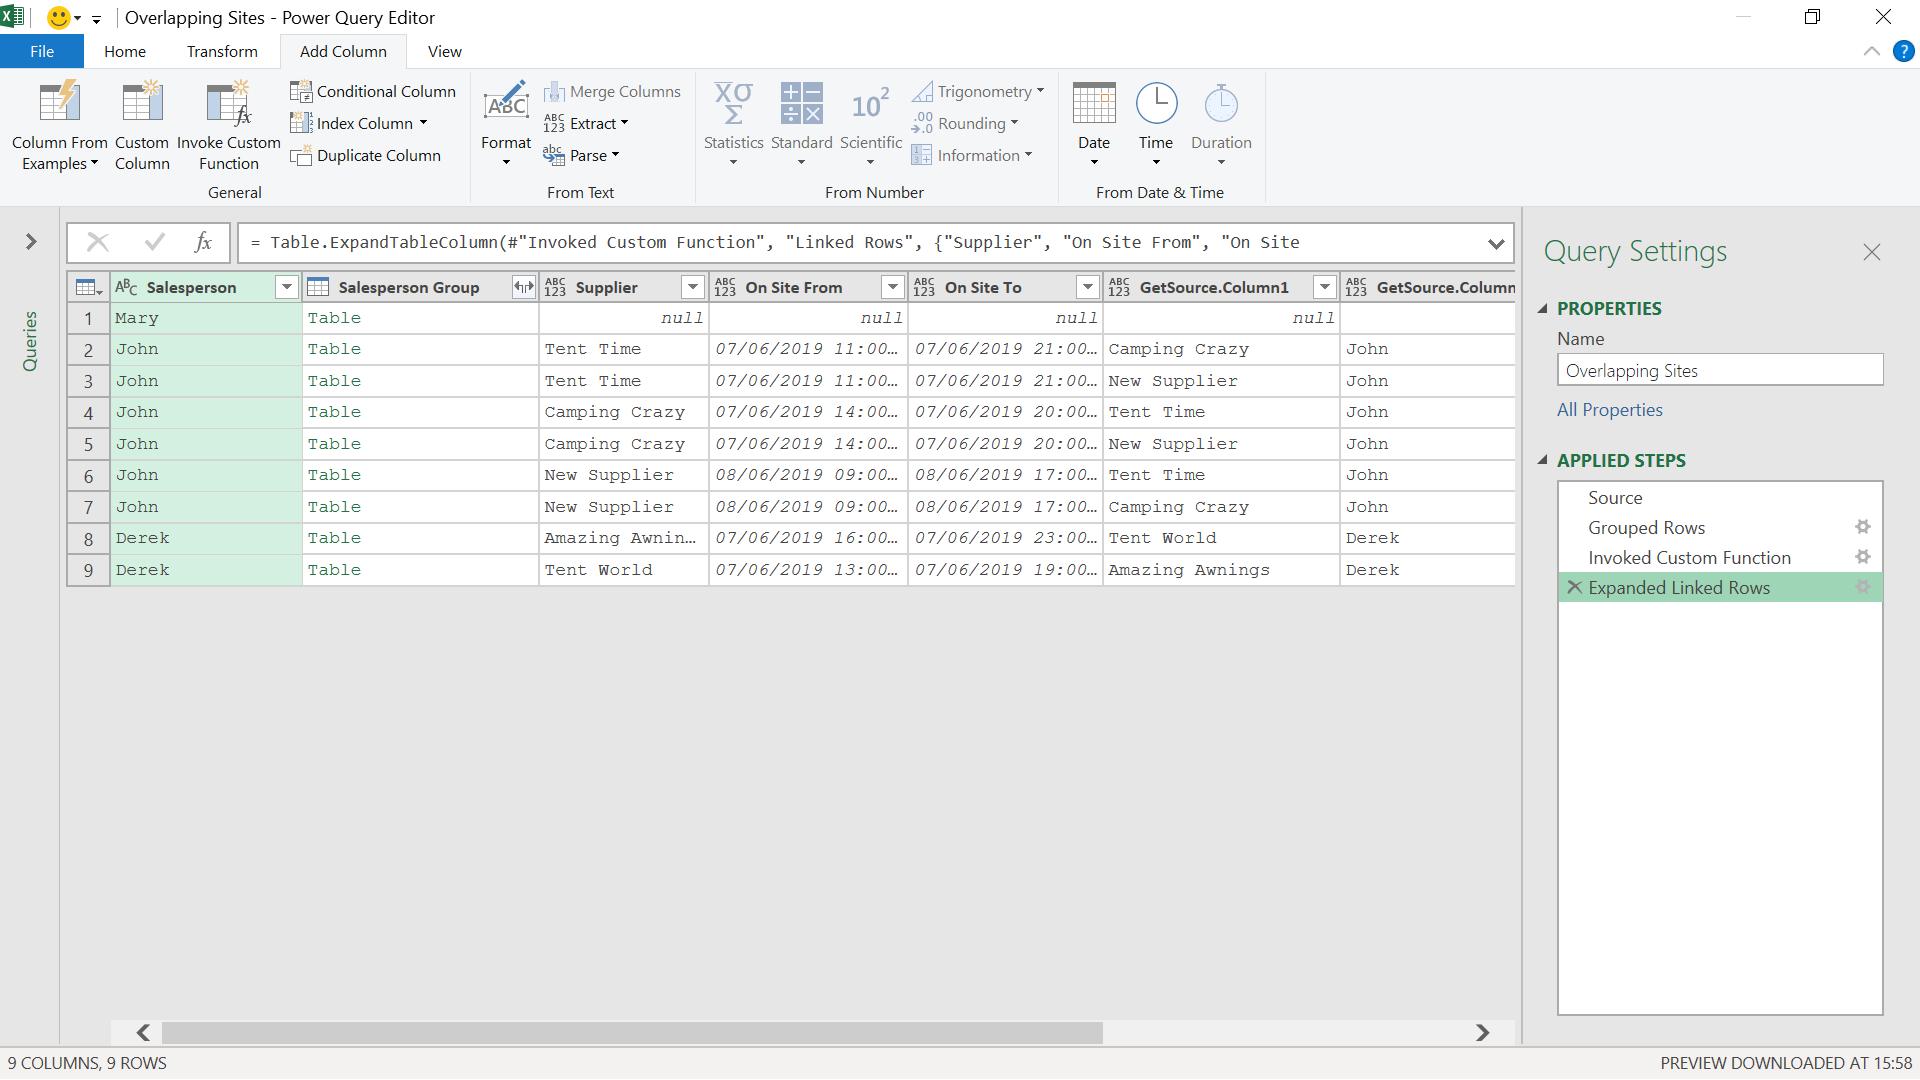
I have a table against each row containing the other data. Next, I create a new column from the ‘Add Column’ tab using ‘Invoke Custom Function’.
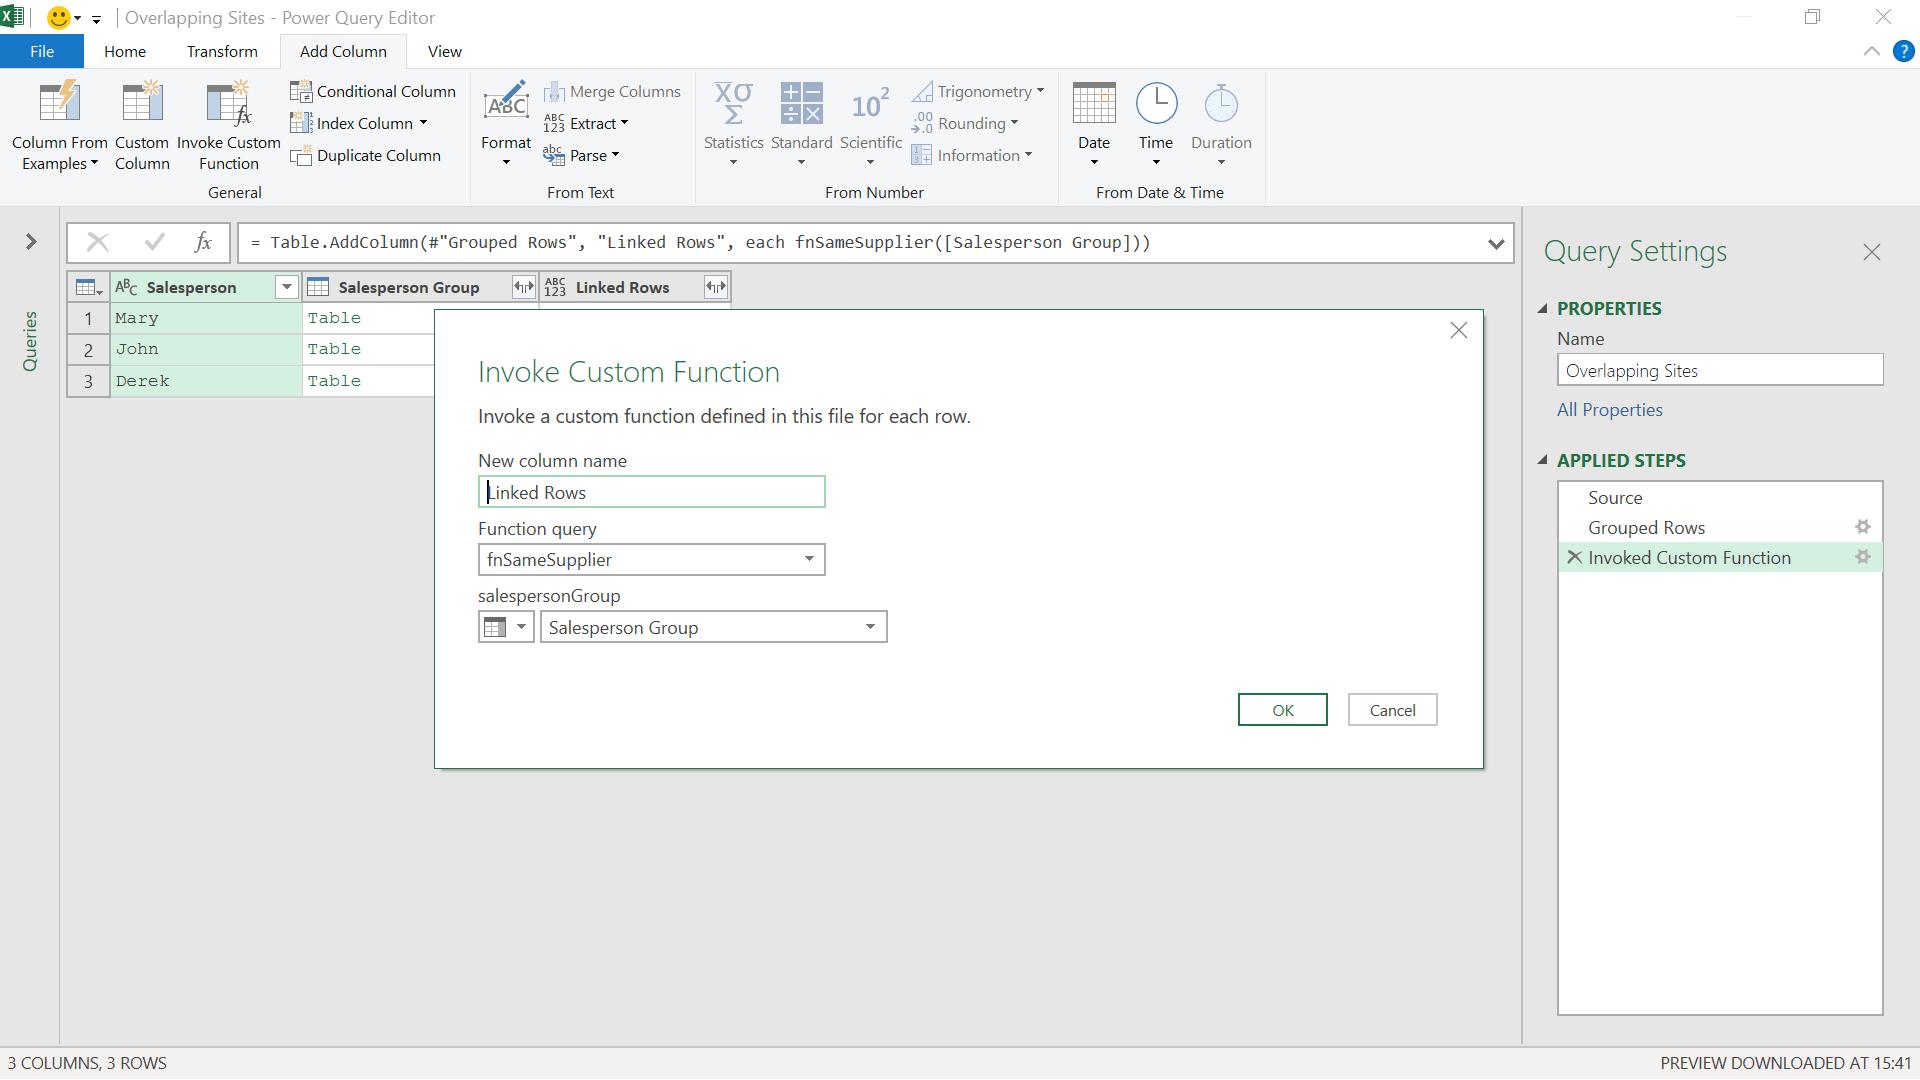
I apply fnSameSupplier to the column Salesperson Group.
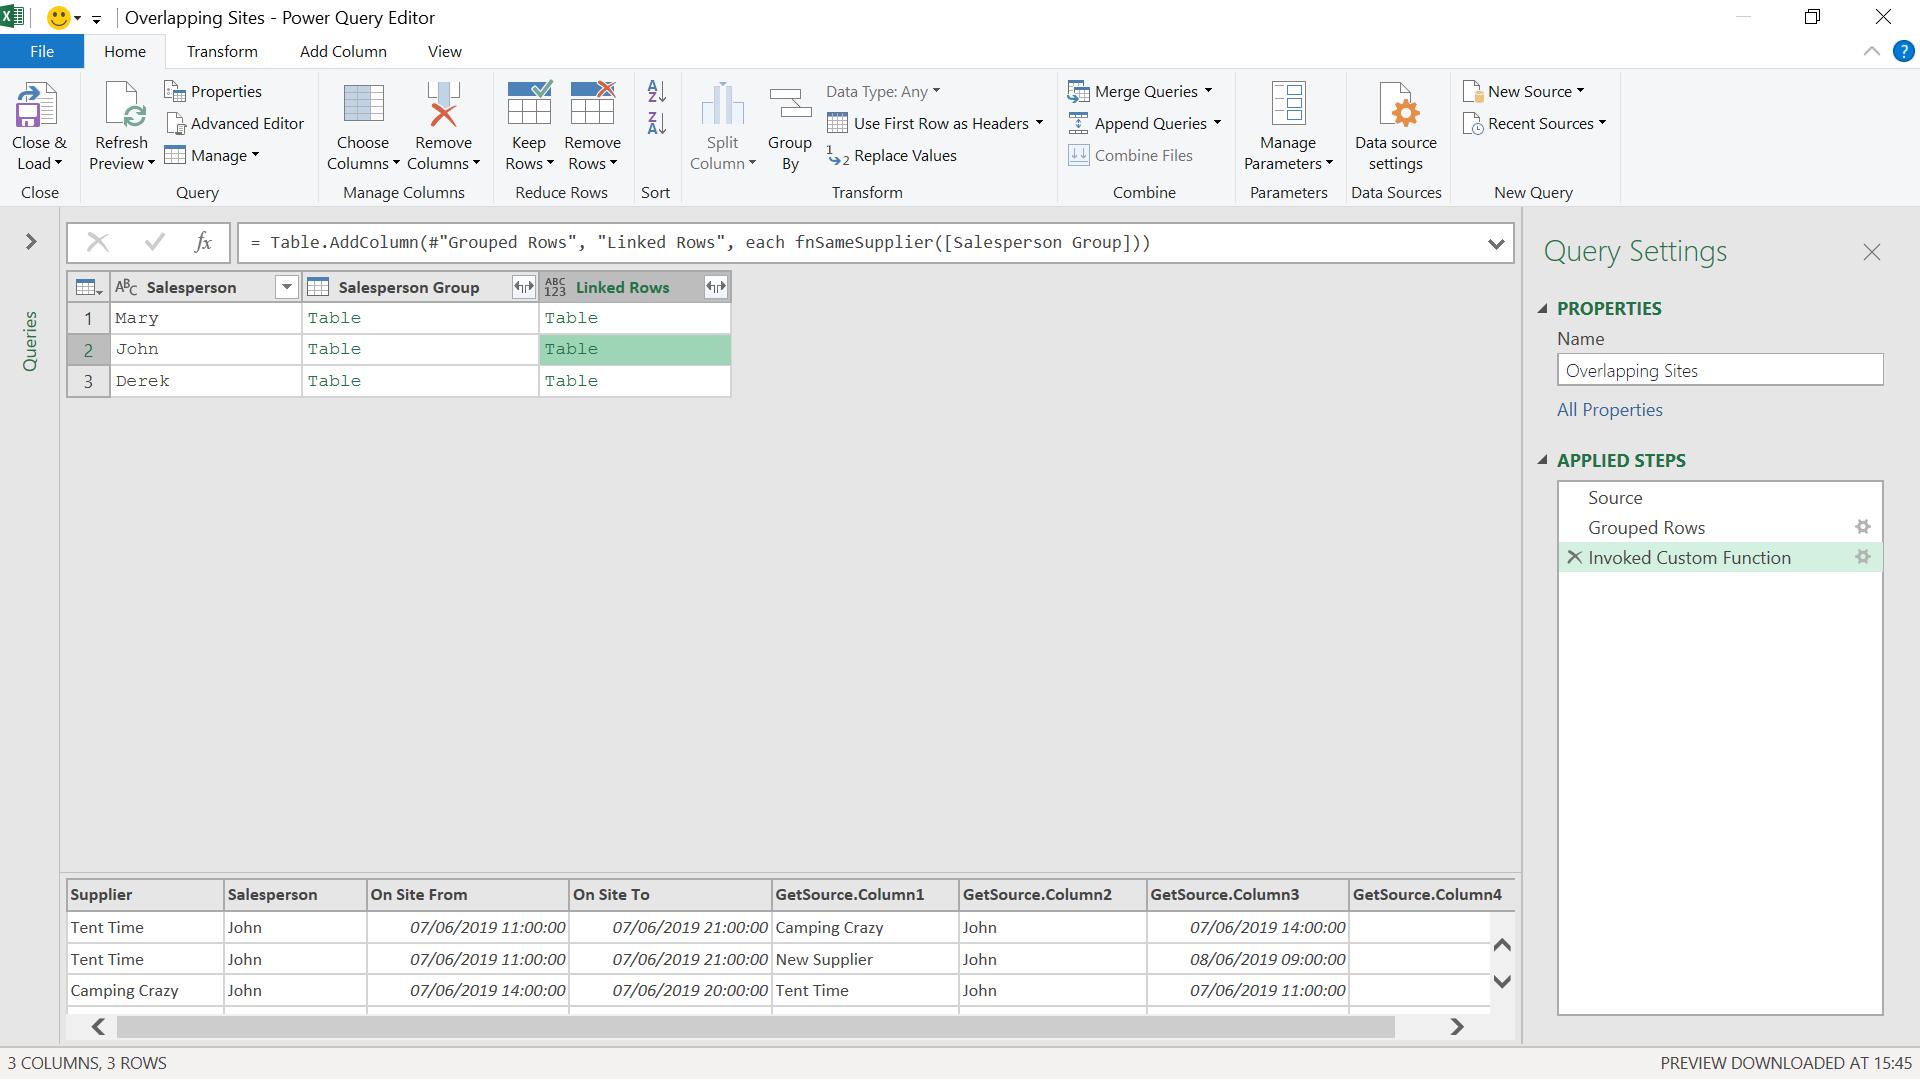
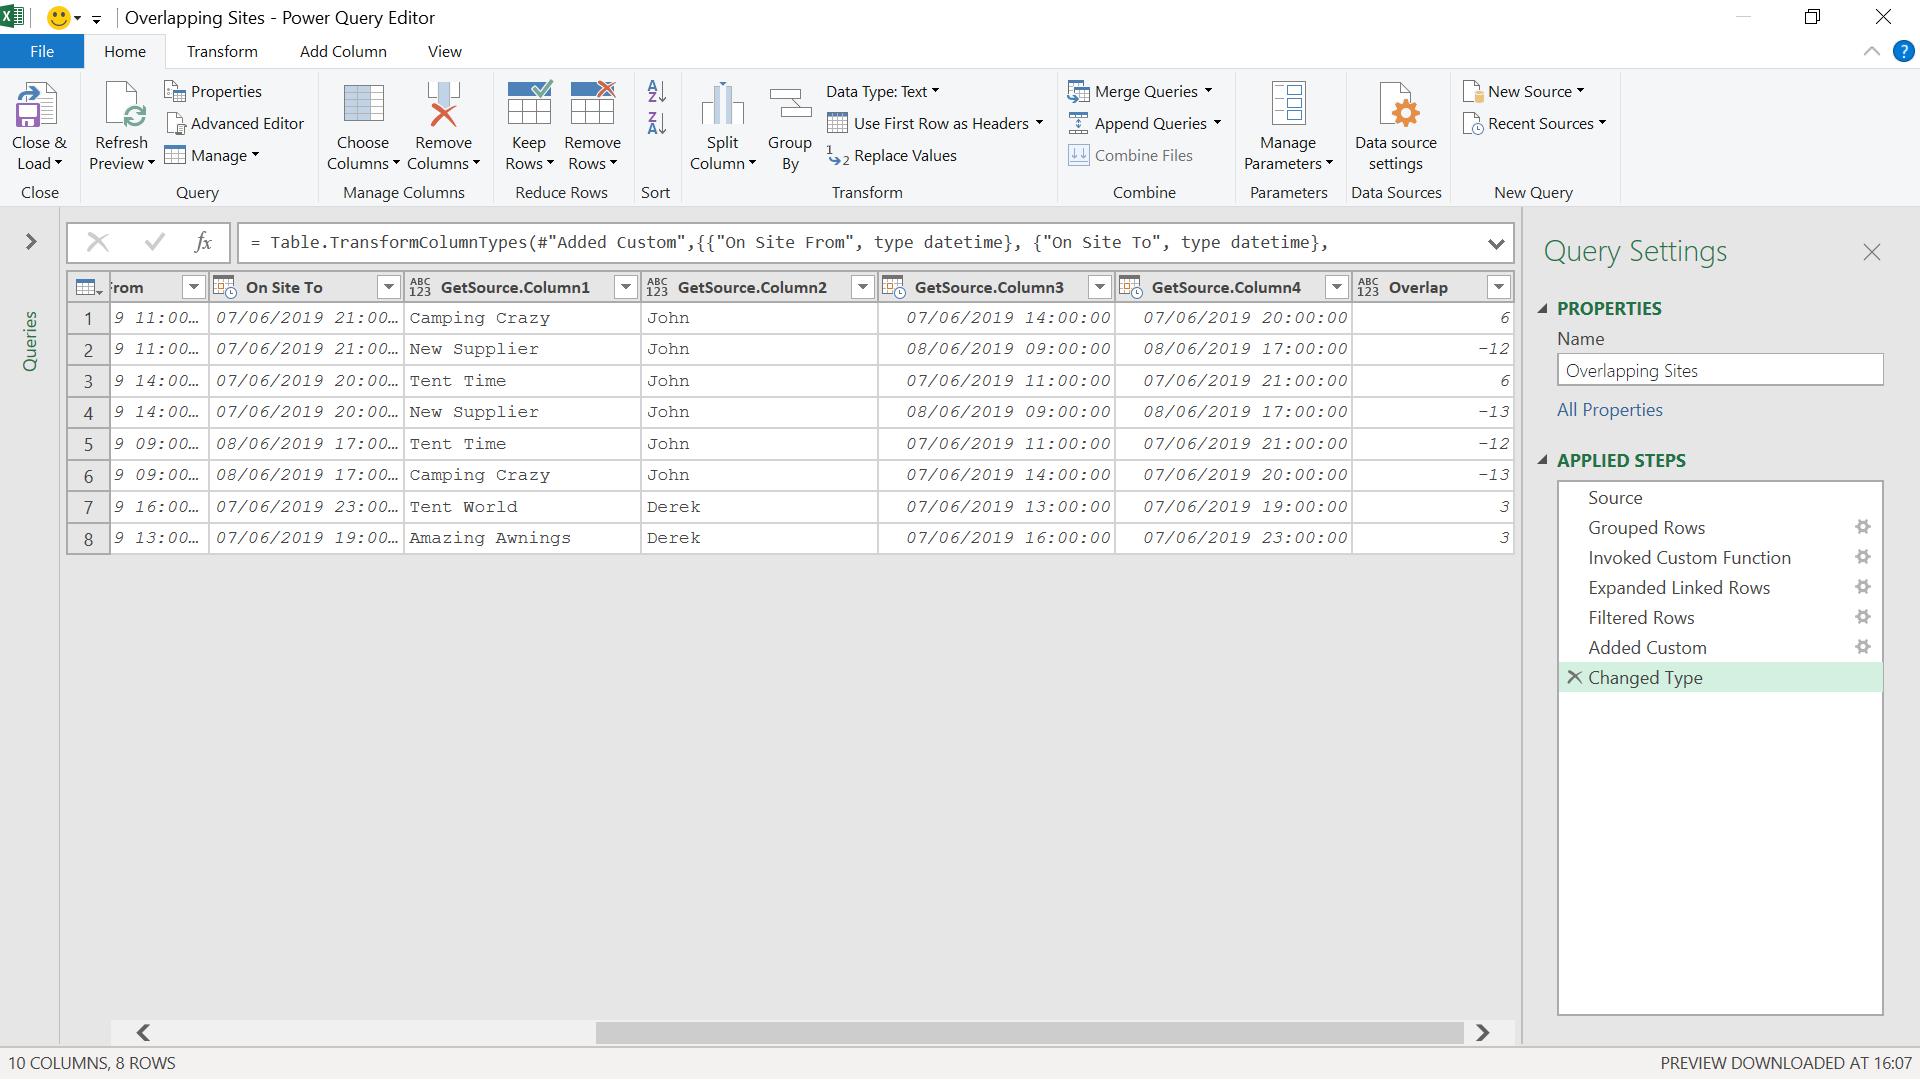
I can now expand Linked Rows.
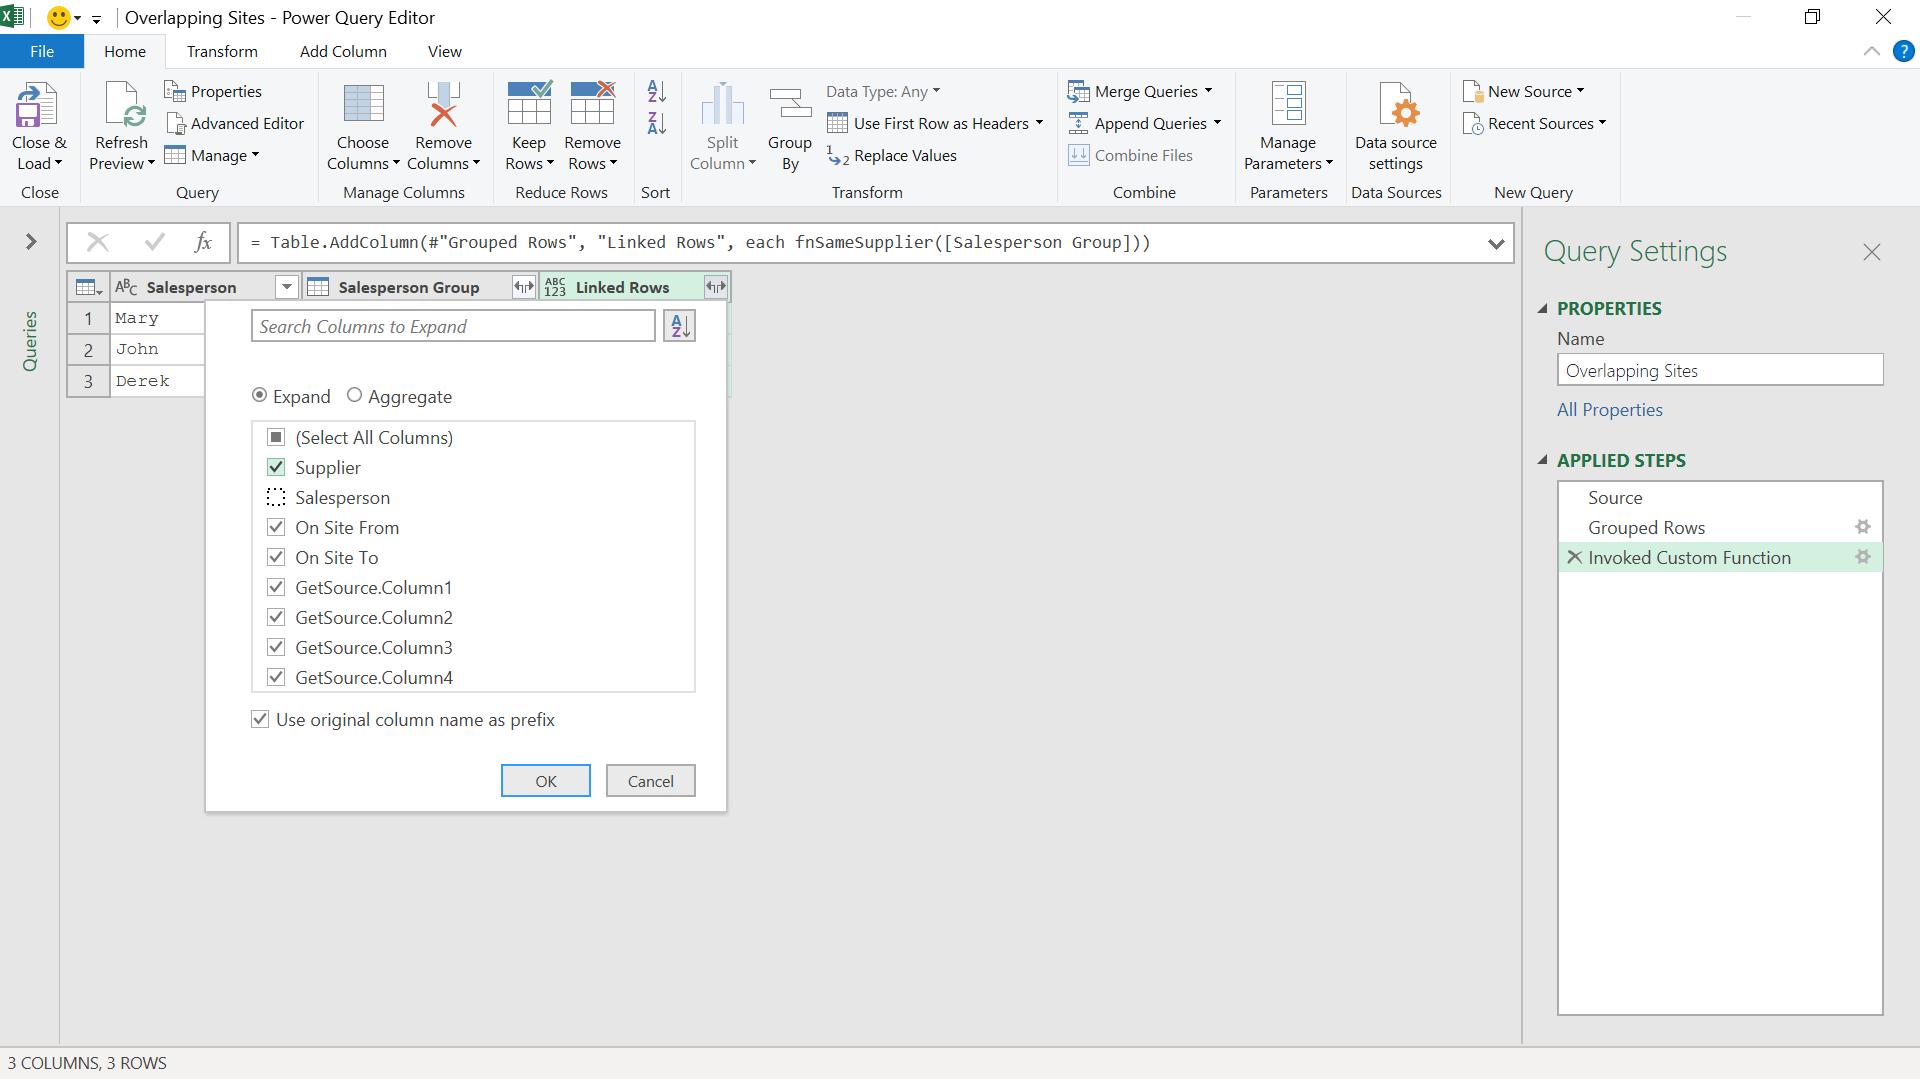
I want all the columns apart from Salesperson (since I already have that). I uncheck the ‘Use original column name as prefix’.
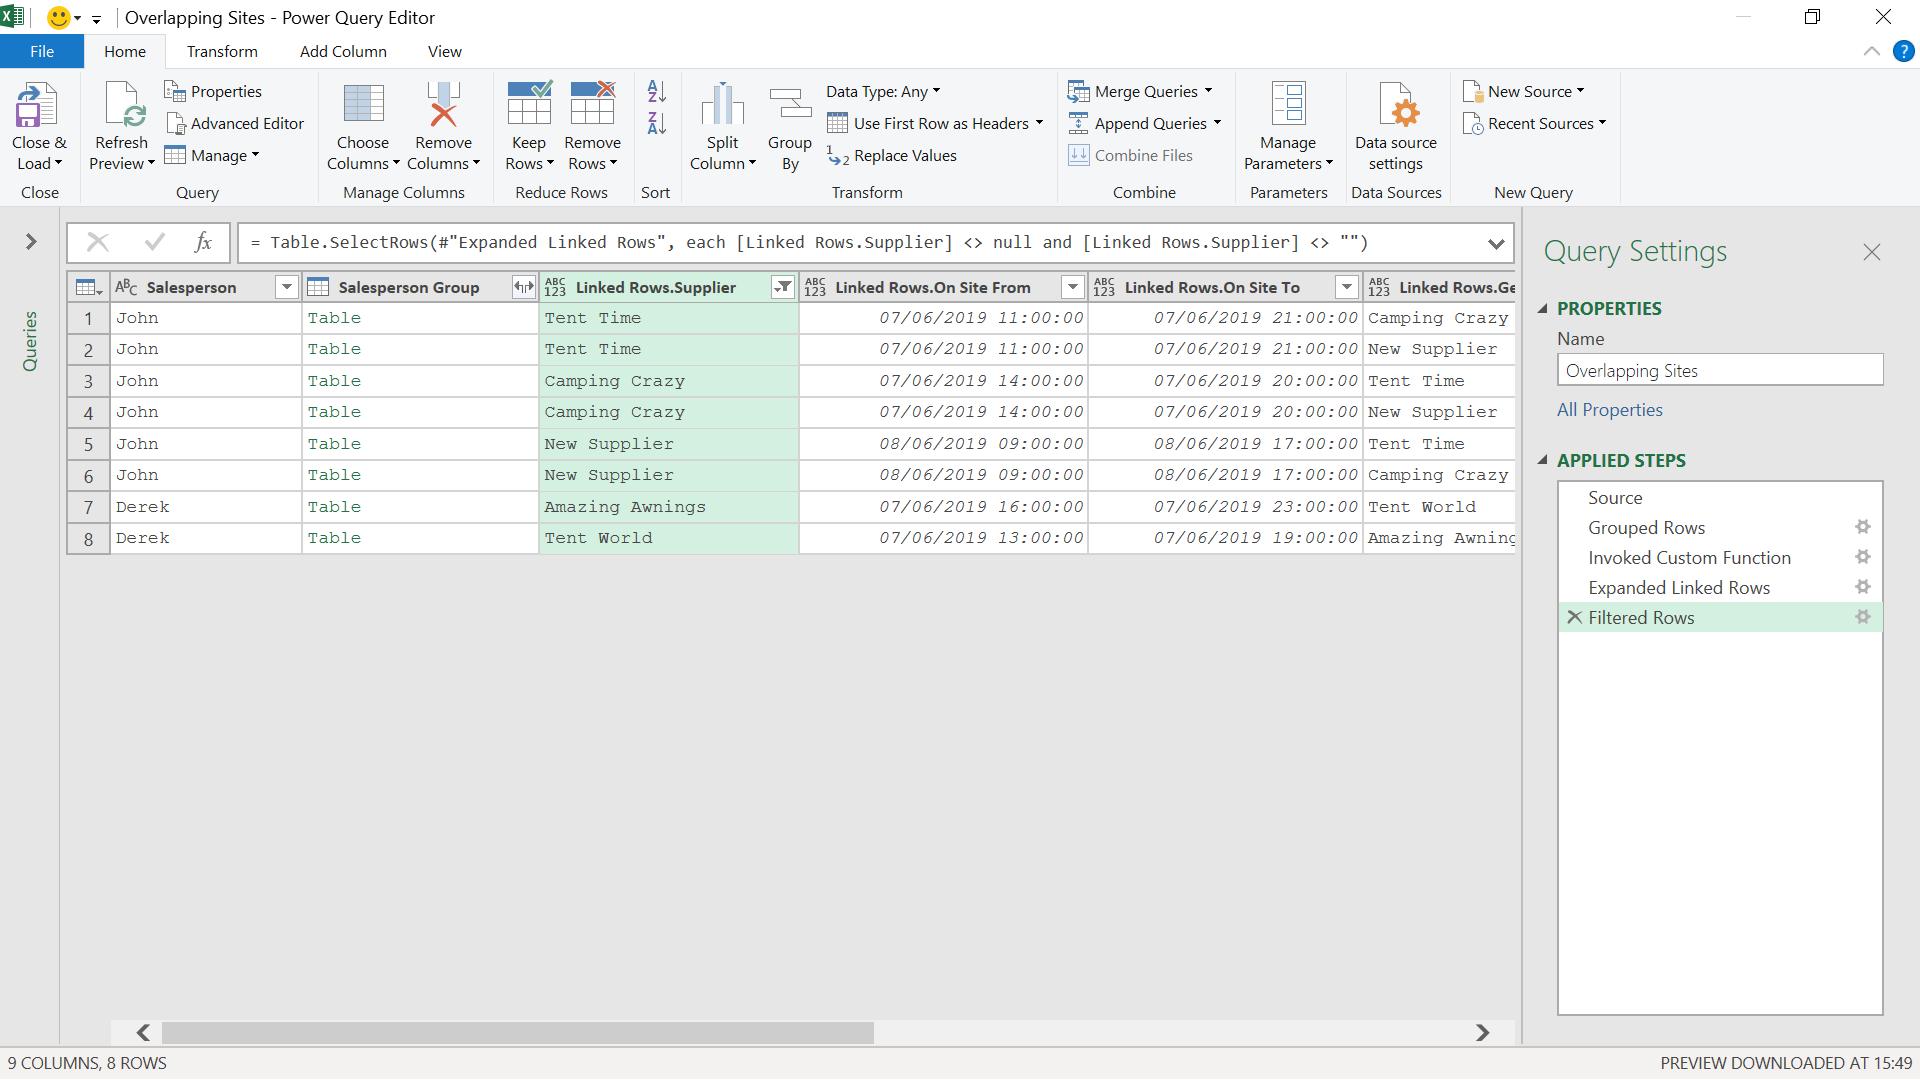
I remove the empty rows.
In order to calculate the overlapping time on site, I will create functions to find the MinSiteTime and MaxSiteTime to apply to my ‘on site’ columns.
I close and load my current query, and create a new blank query from the ‘New Query’ dropdown.
In the advanced editor of my new blank query, I add some M code:
The M code I have added is
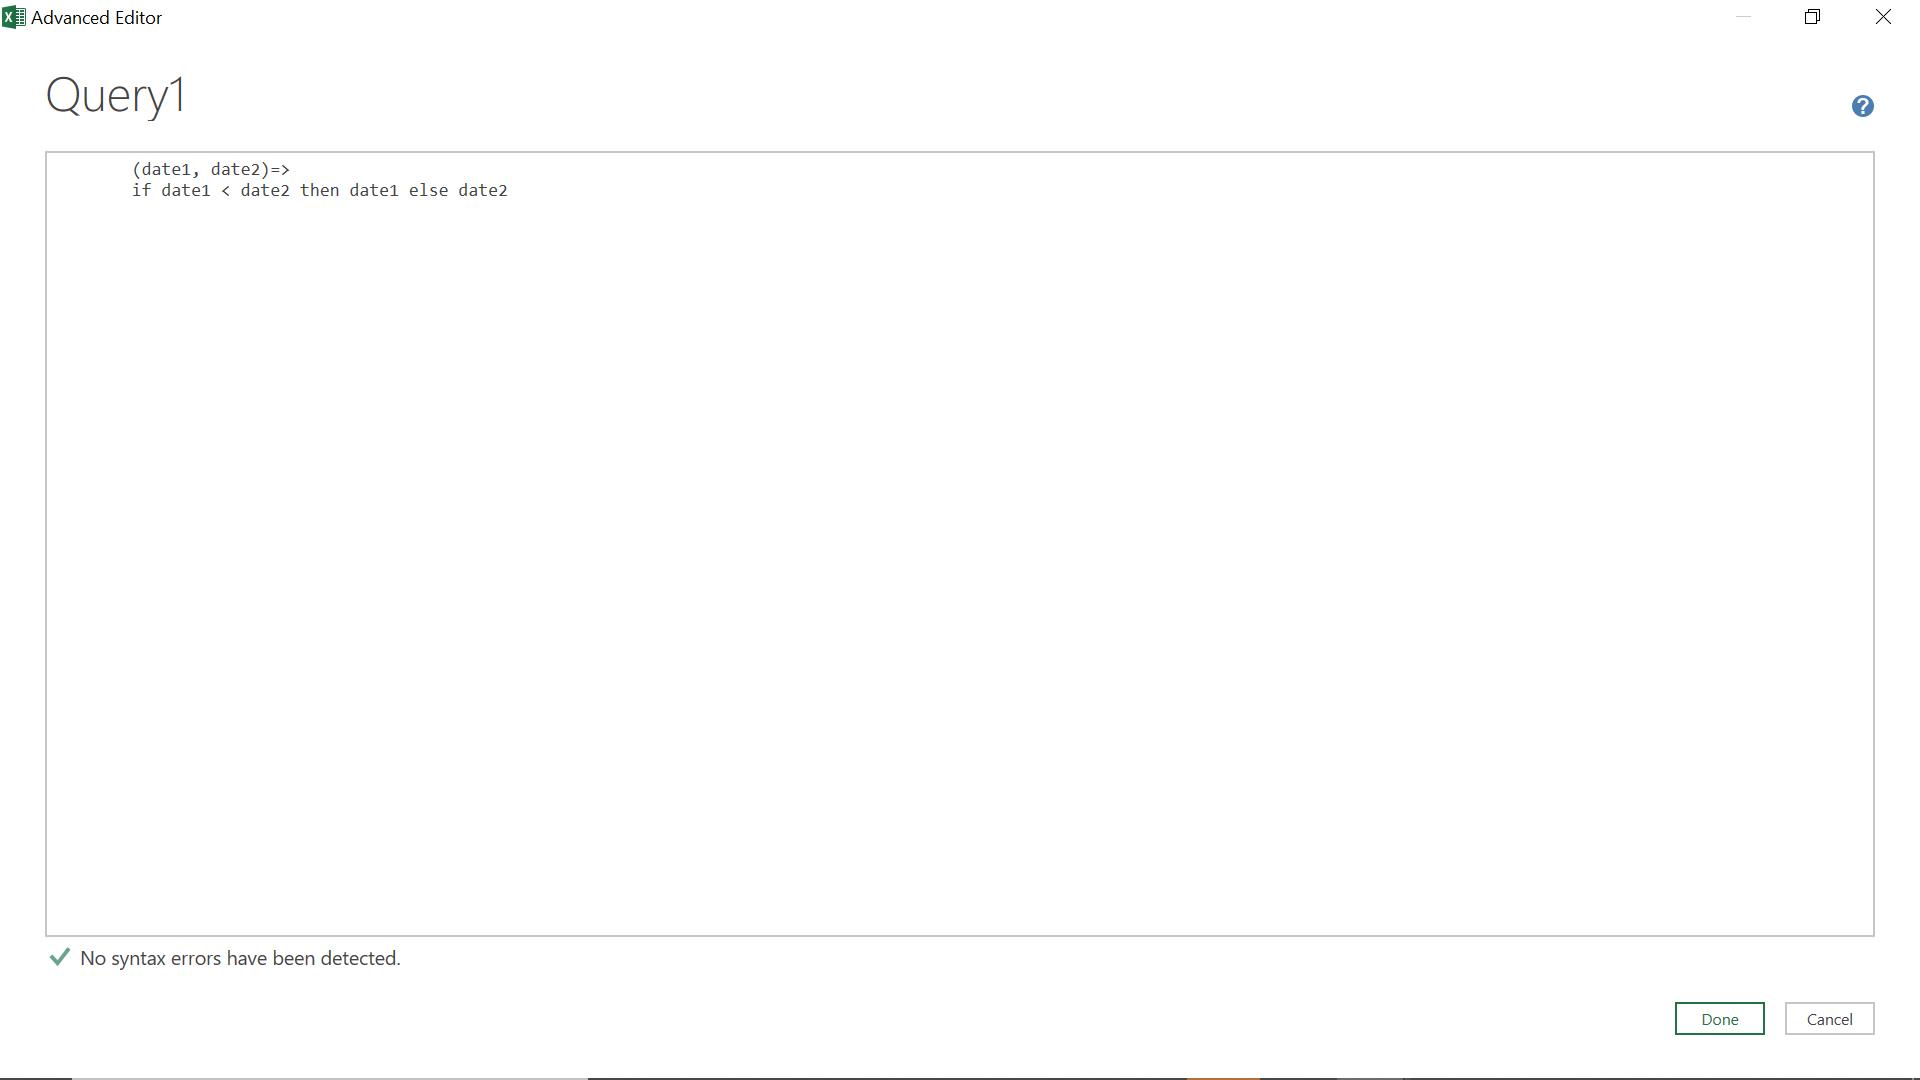
(date1, date2) =>
if date1 < date2 then date1 else date2
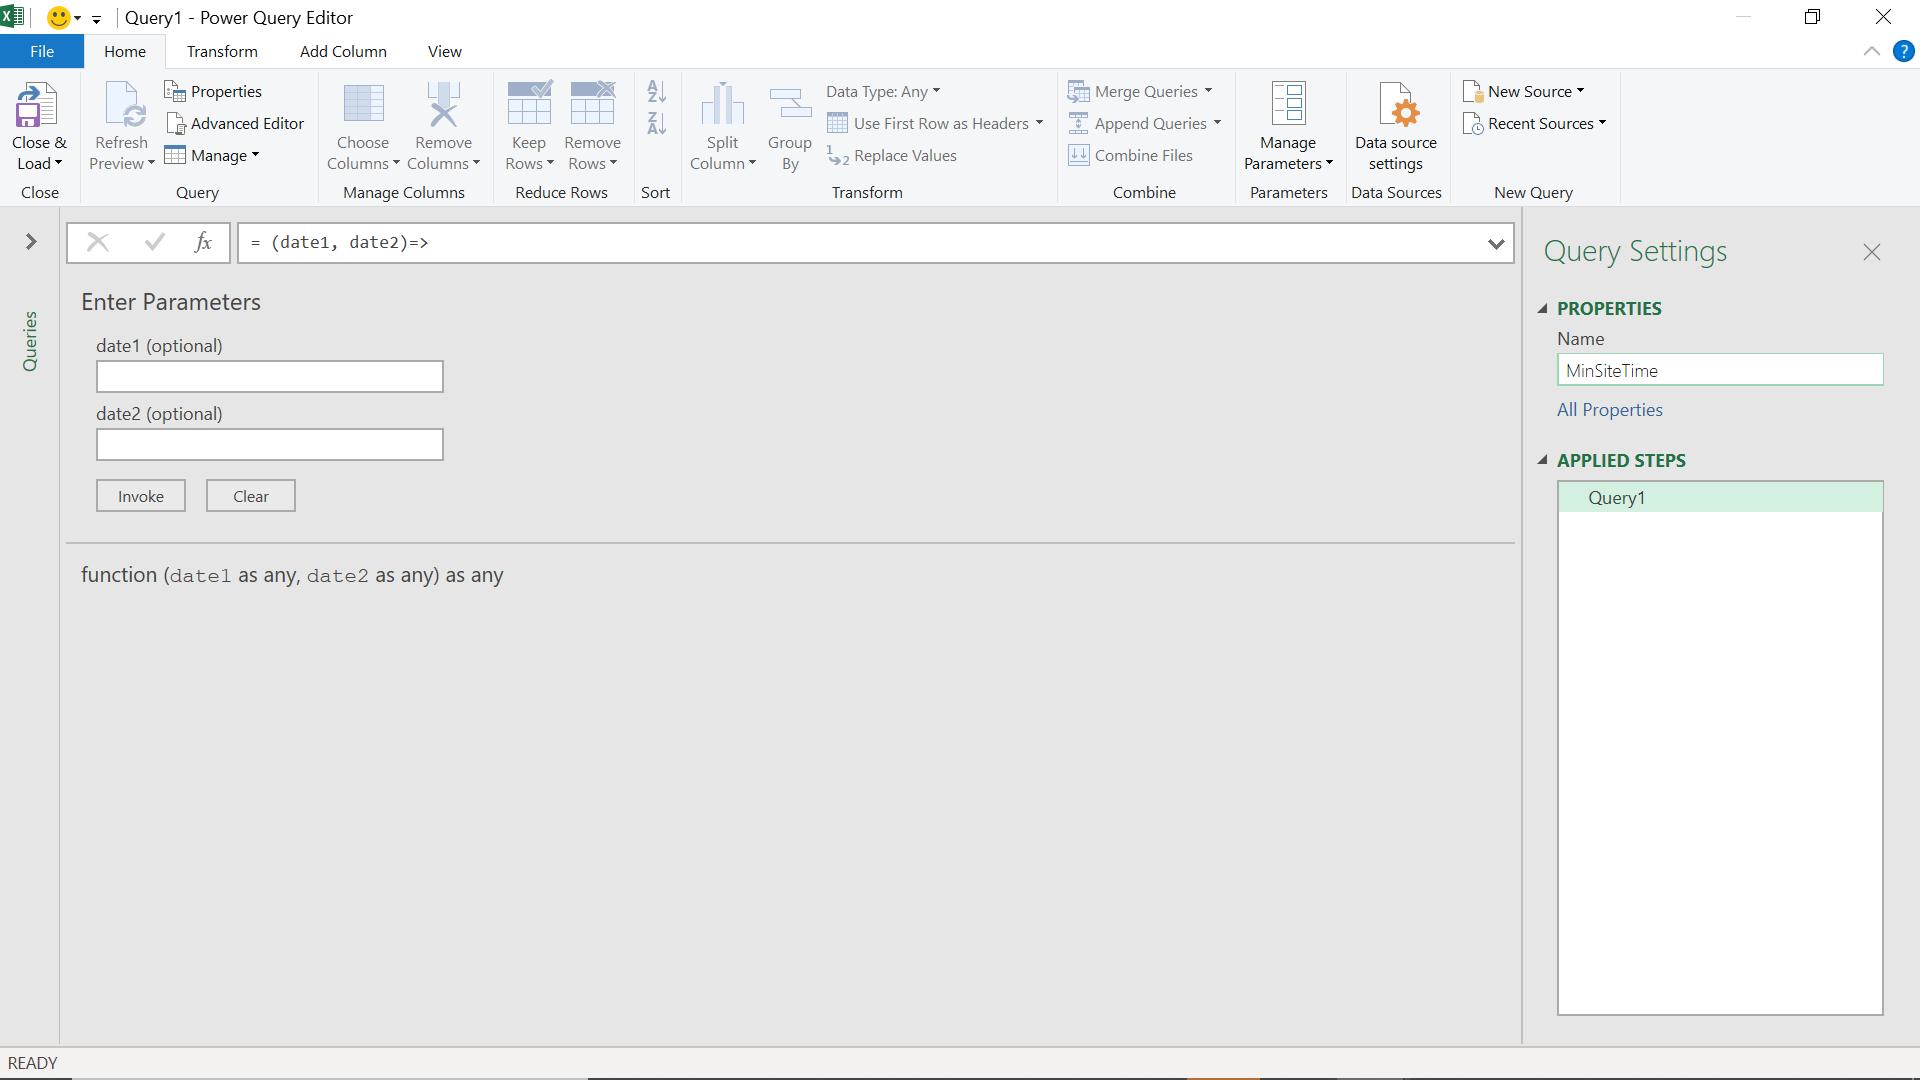
I save my function as ‘MinSiteTime’ and create a new blank query.
This time, the M code is:
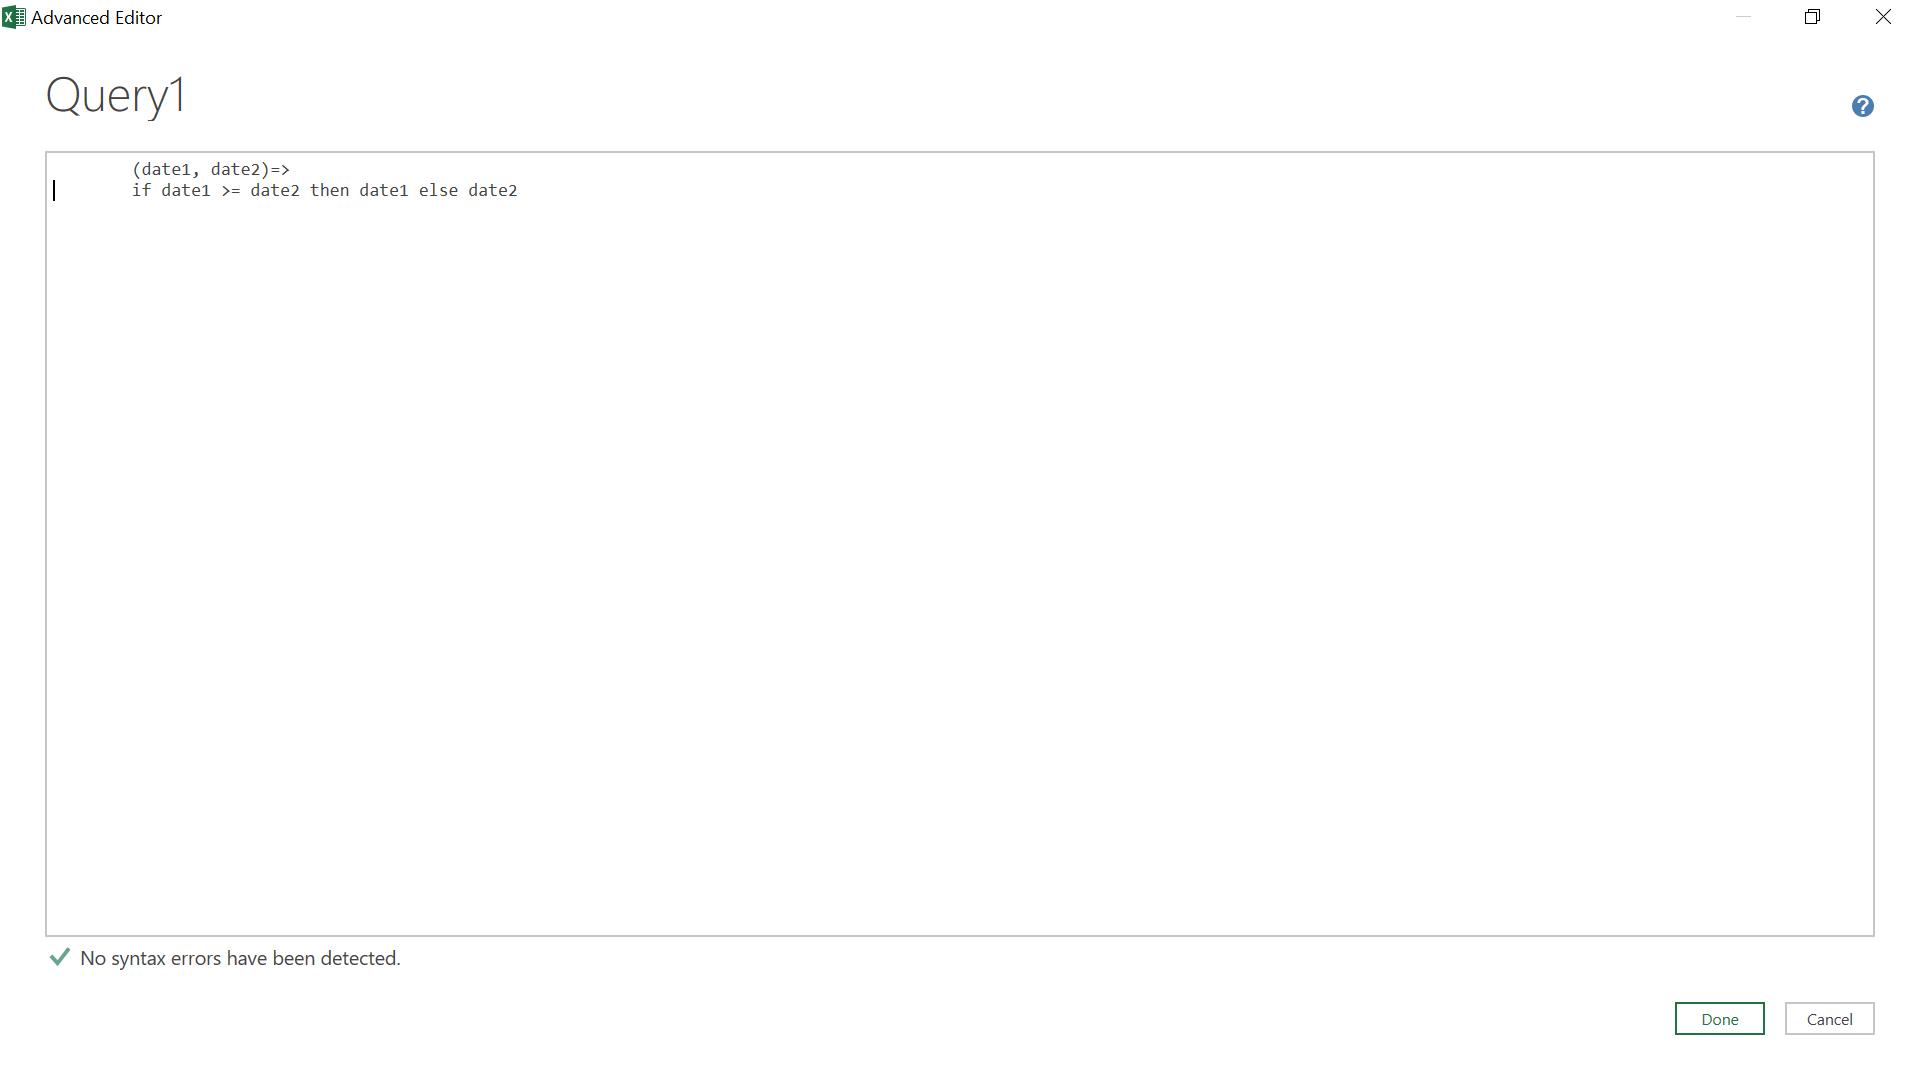
(date1, date2) =>
if date1 >= date2 then date1 else date2
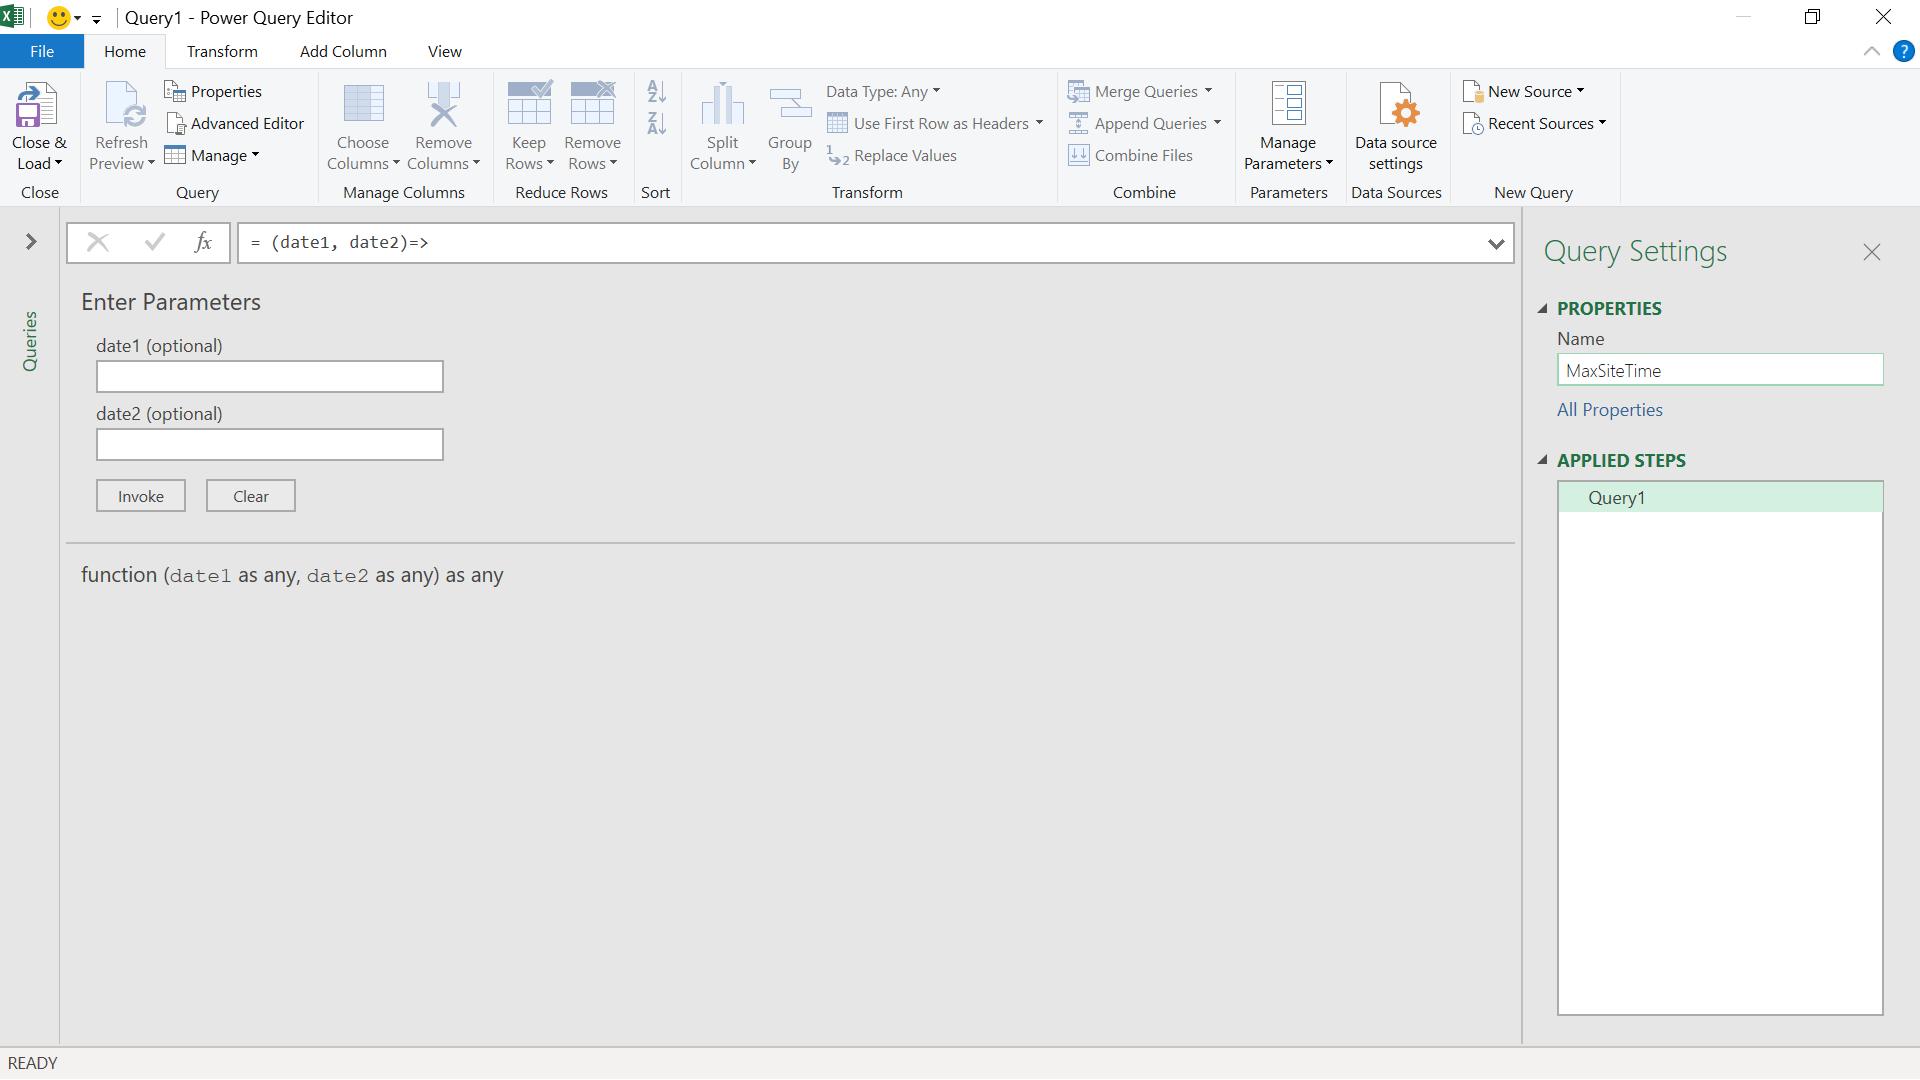
I save ‘MaxSiteTime’.
Going back to my original query, I can now create a new custom column from the ‘Add Column’ tab. I call my new column Overlap.
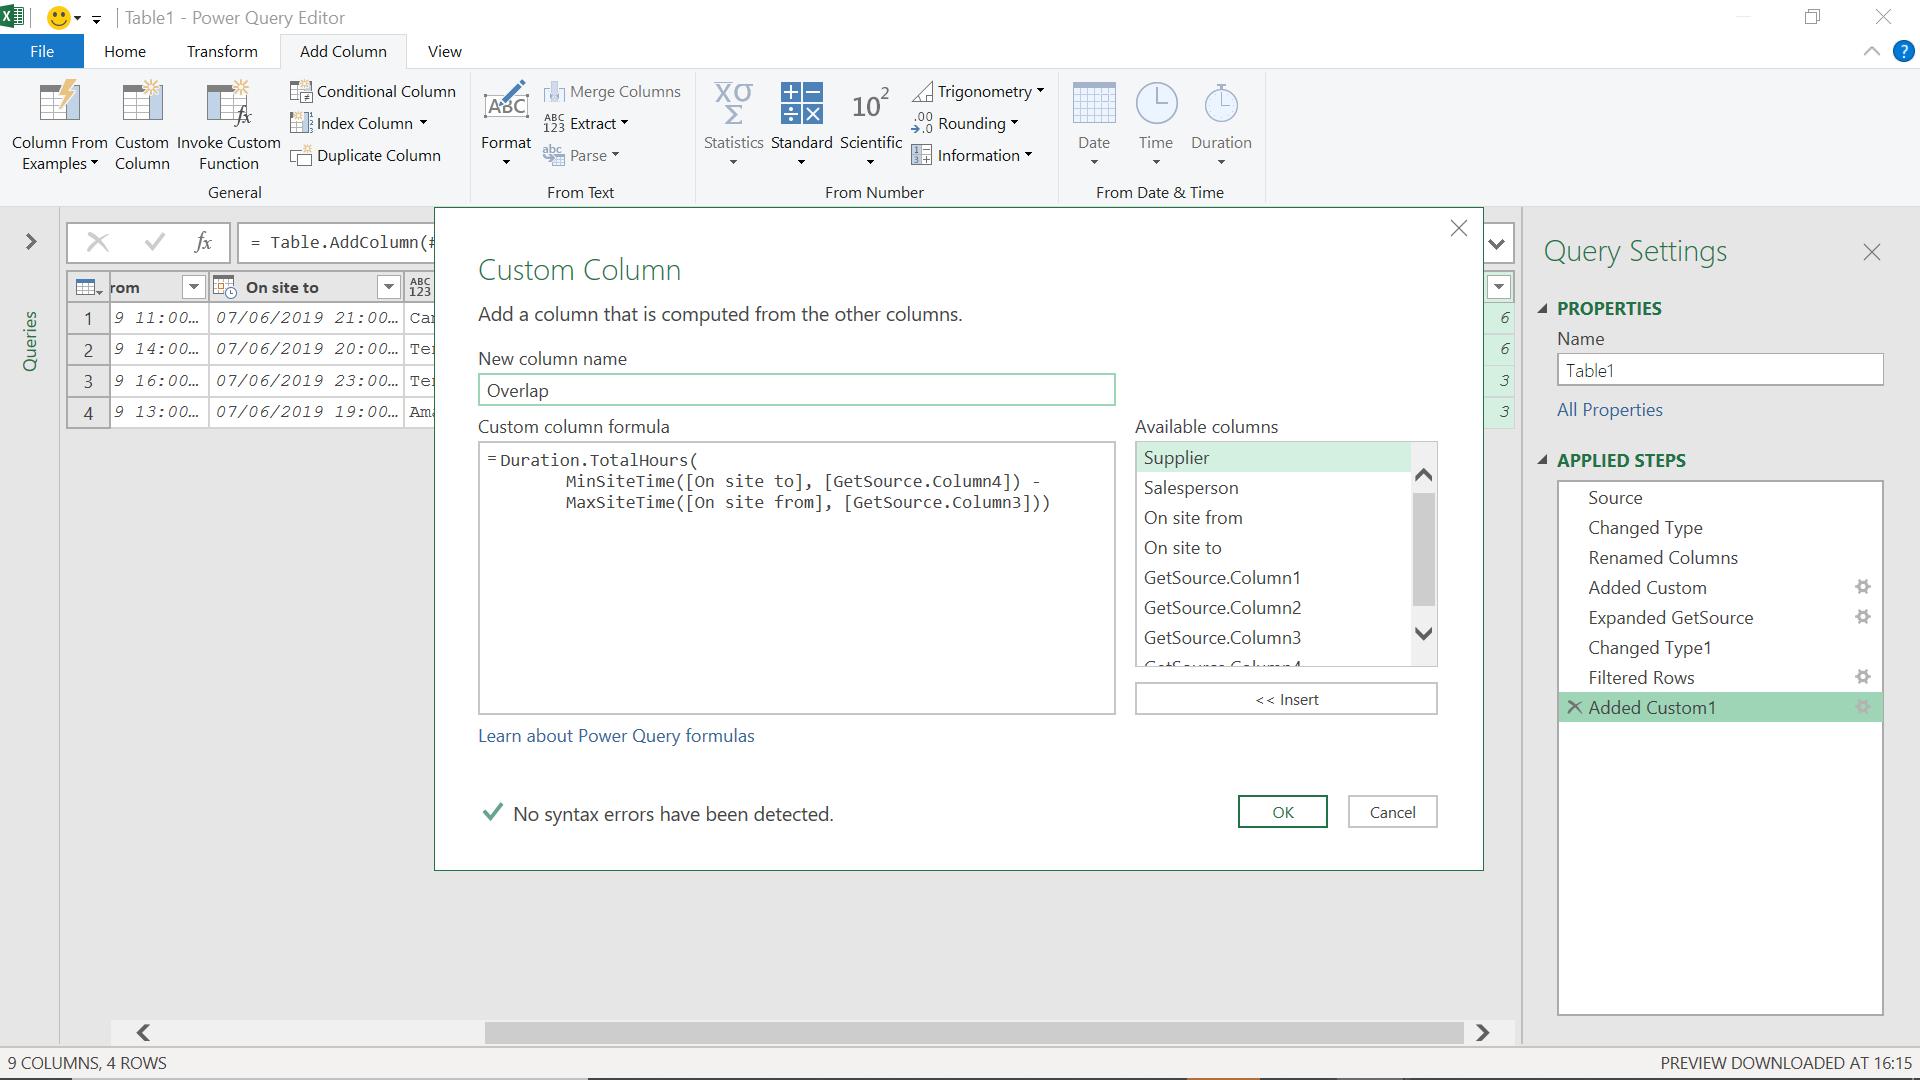
The M code I have used is:
= Duration.TotalHours(
MinSiteTime([On Site To], [Linked Rows.On Site To]) -
MaxSiteTime([On Site From], [Linked Rows. On Site From]))
This formula will give me the number of hours overlapping; if the result is negative, then there is no overlap.
I can filter on Overlap to remove the negative values.
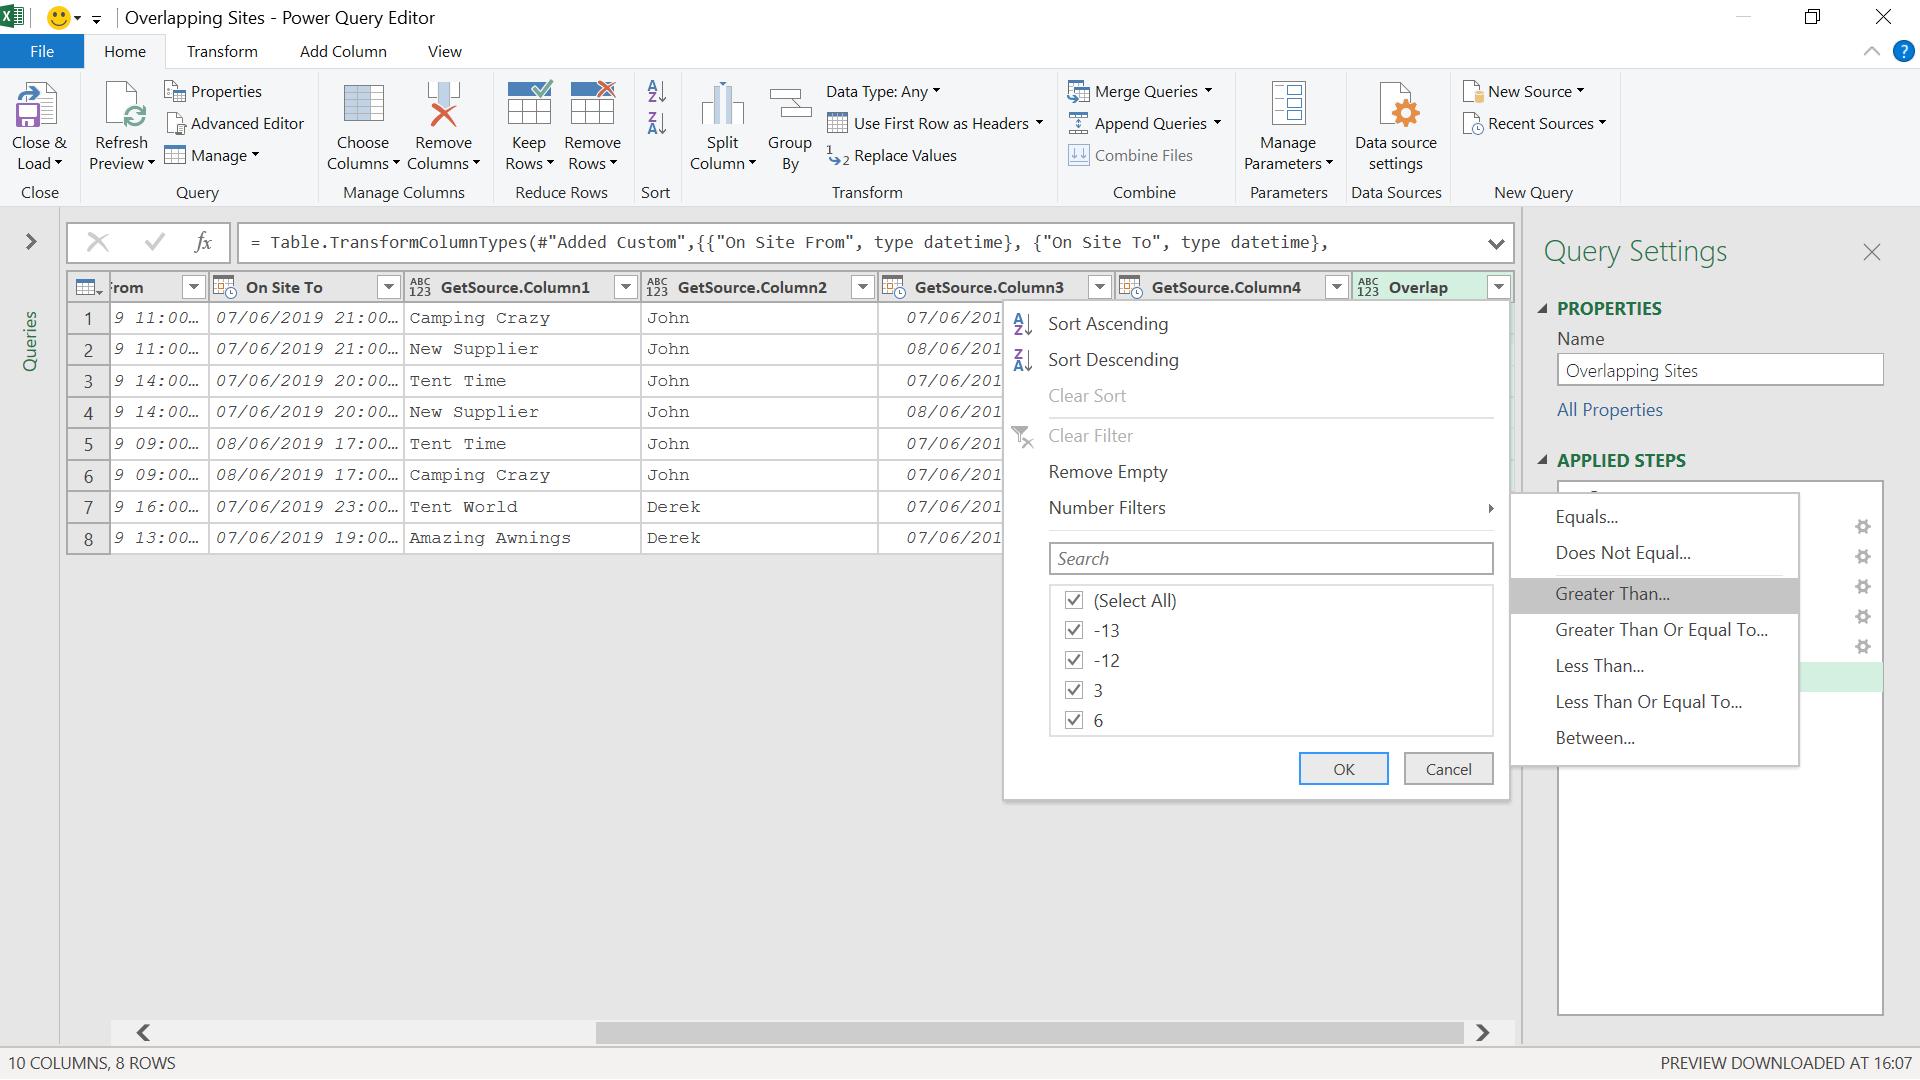
I choose values greater than zero (0).
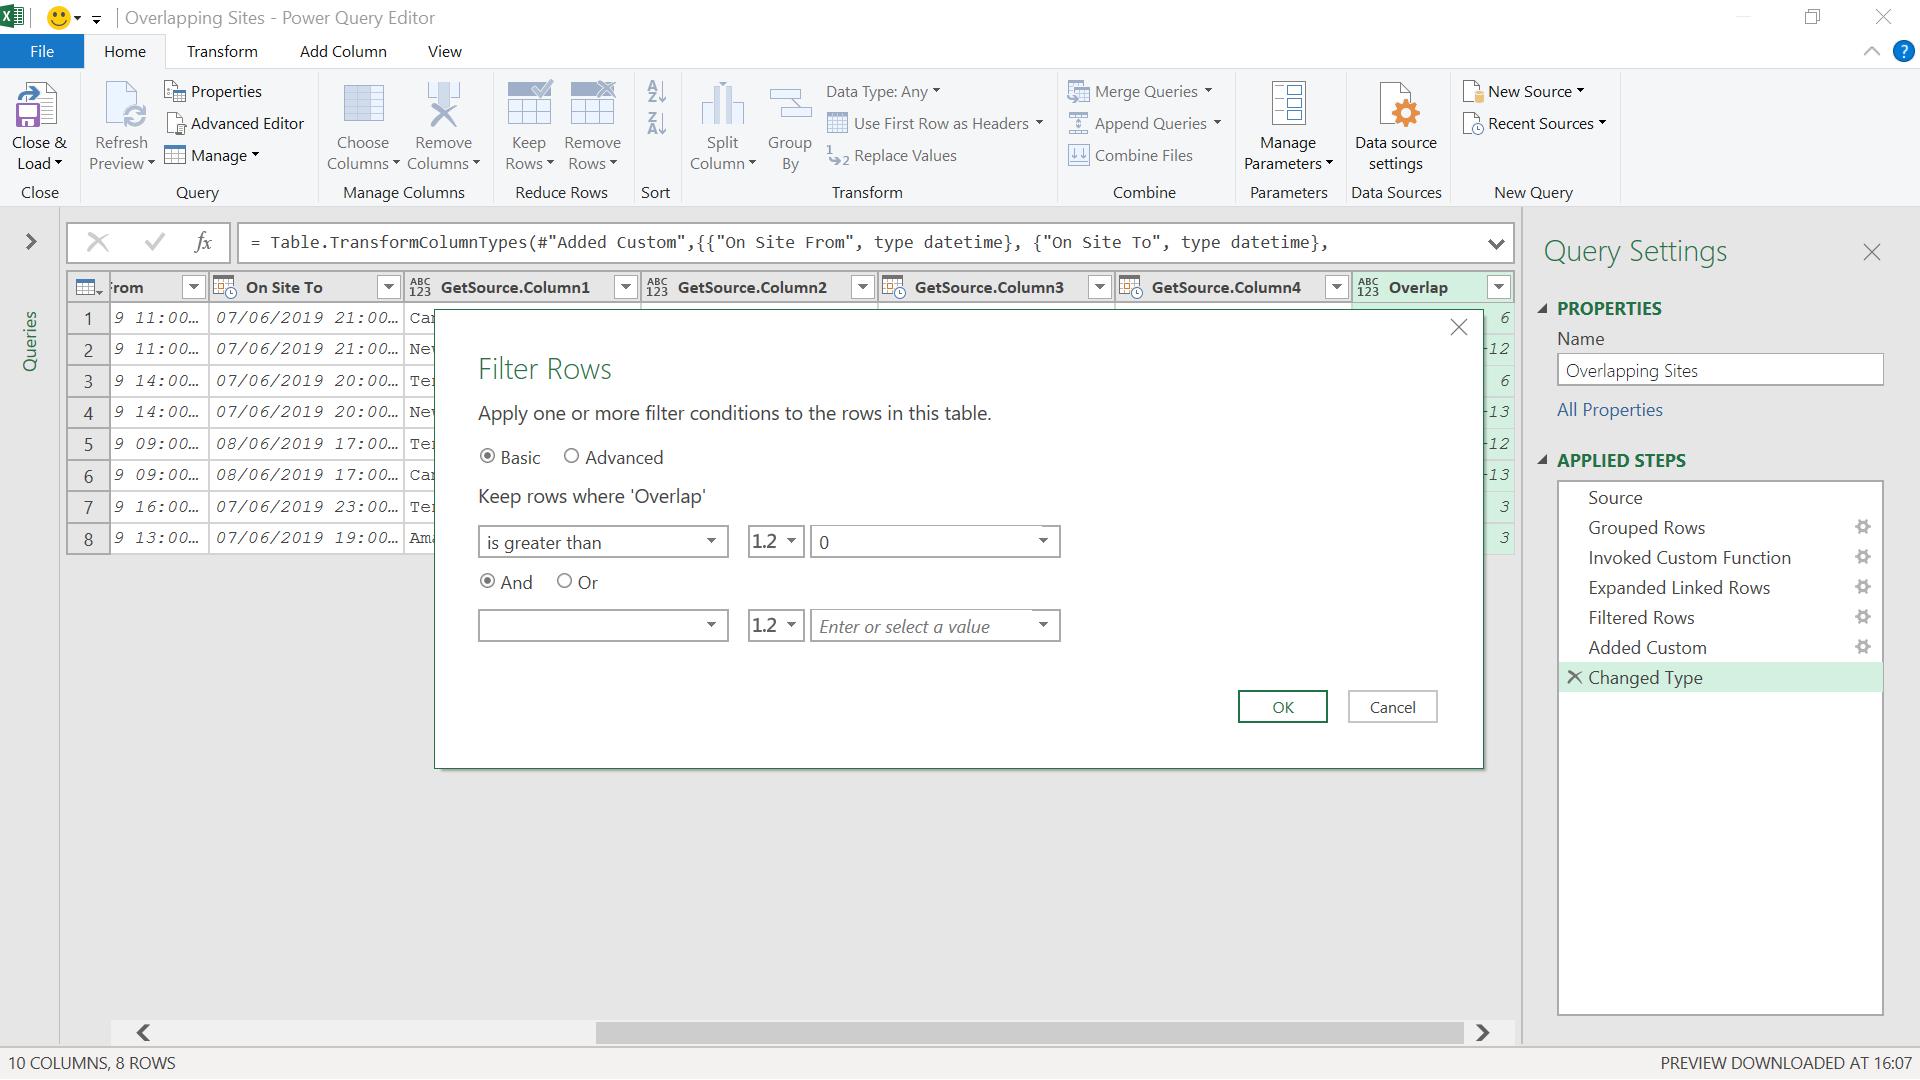
I can see the filter applied:
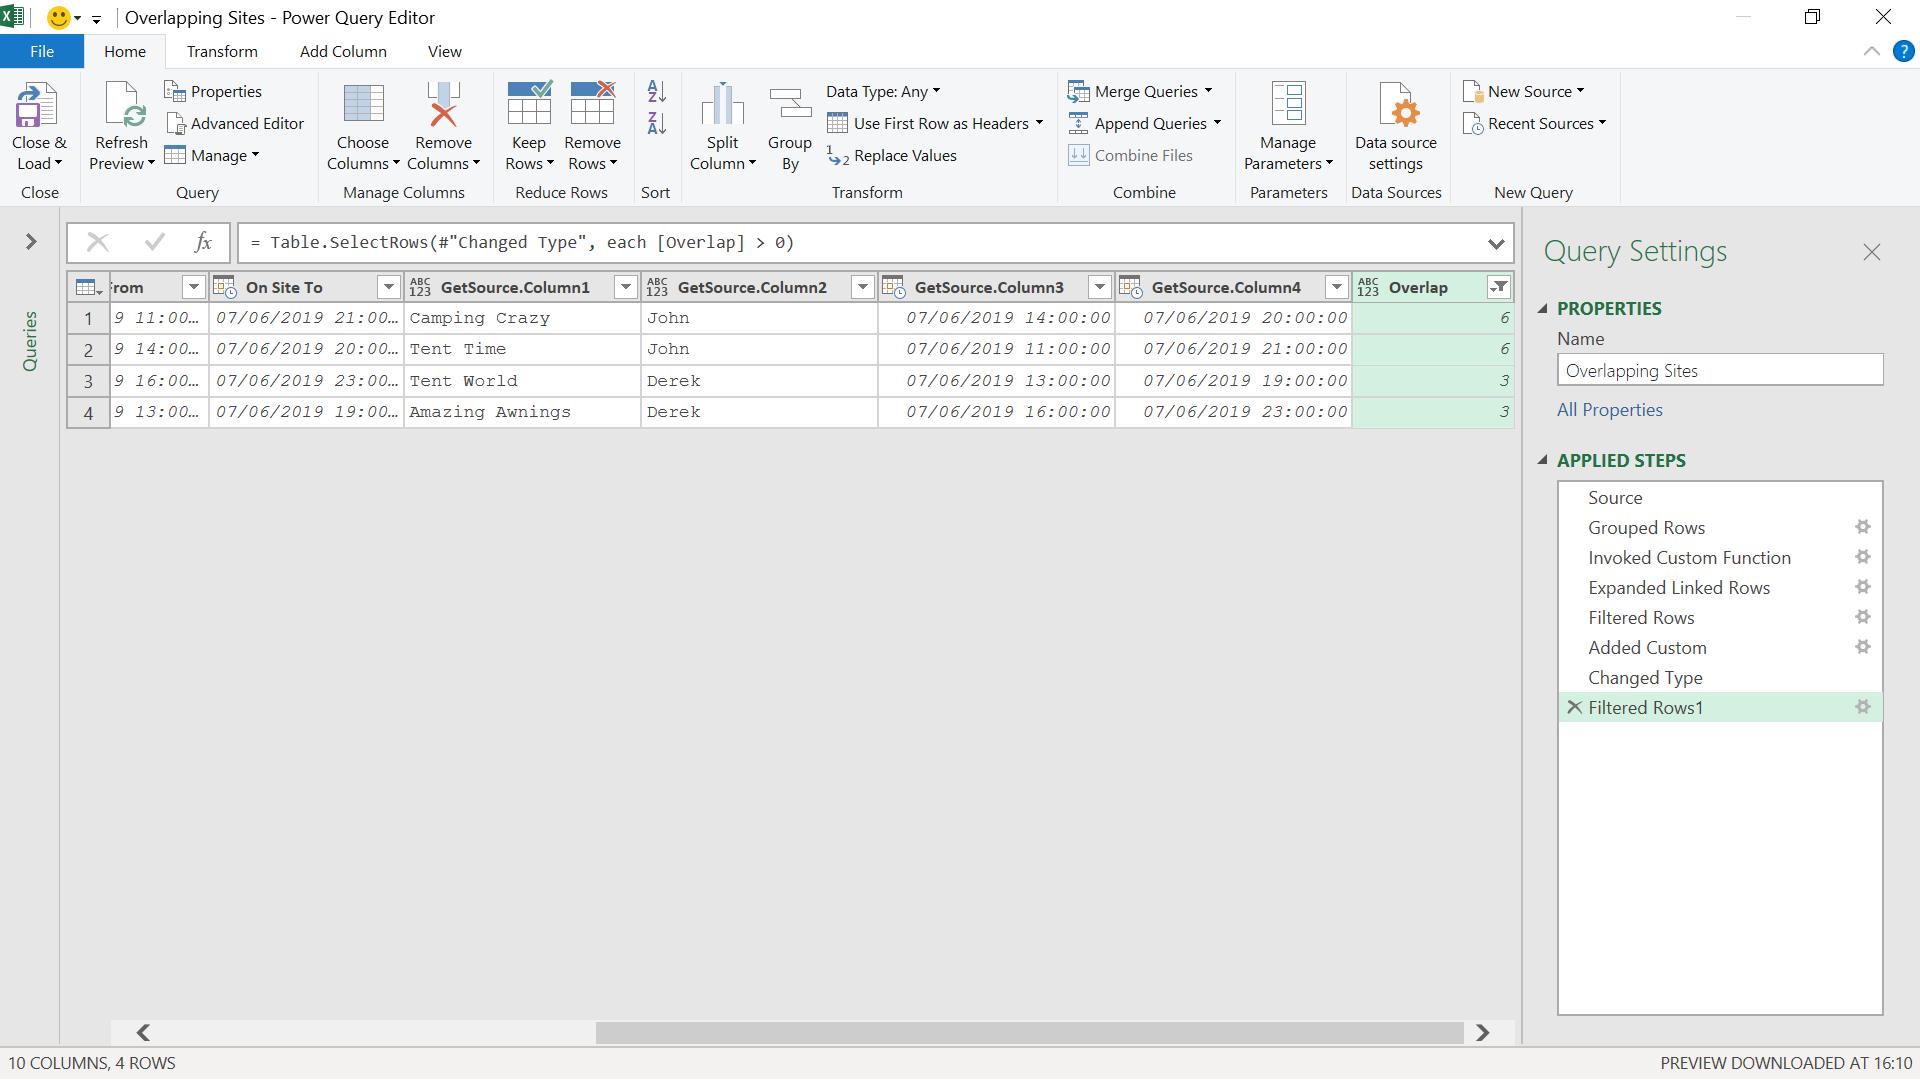
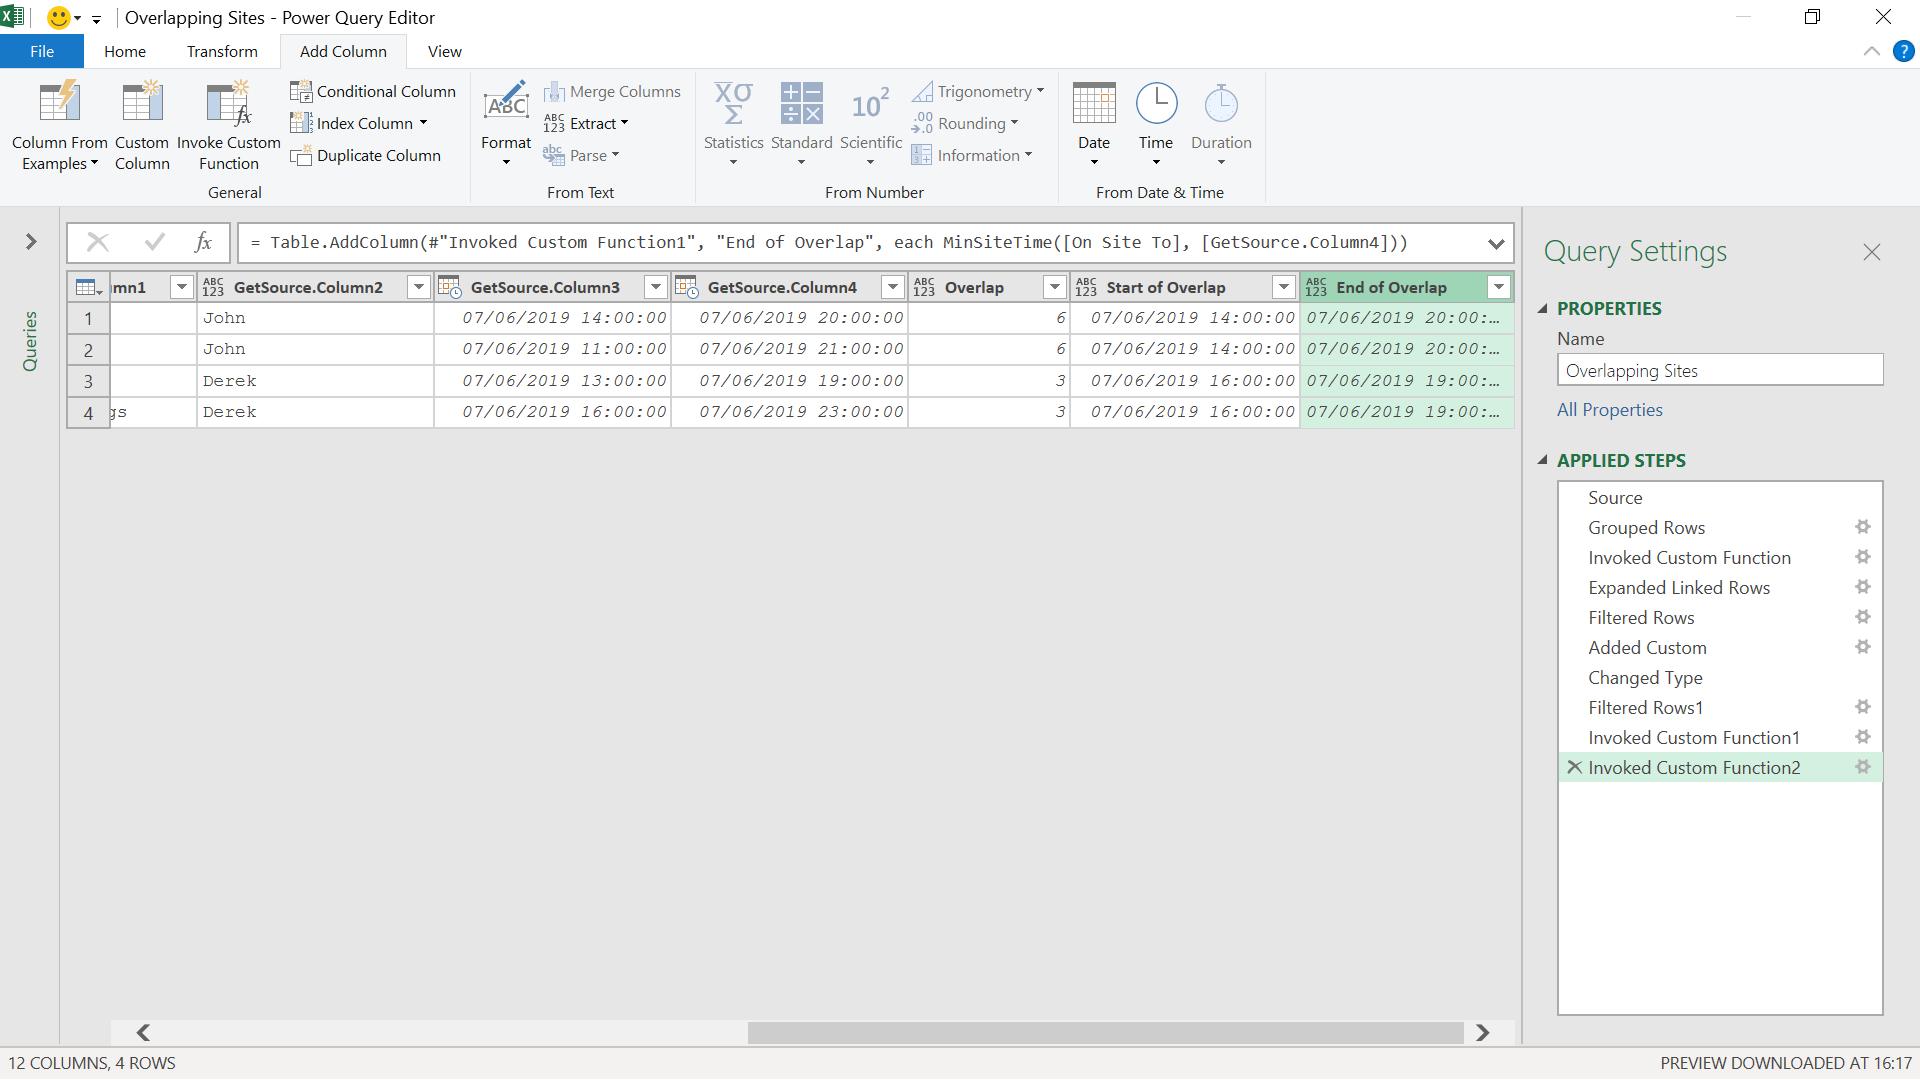
I only see those rows where there’s an overlap. If I wish, I can show the overlap in more detail by creating columns to show the beginning and end of the overlap. To do this, I add two custom columns and use my MaxSiteTime and MinSiteTime functions. I use the ‘Invoke Custom Function’ button on the ‘Add Column’ tab to do this.
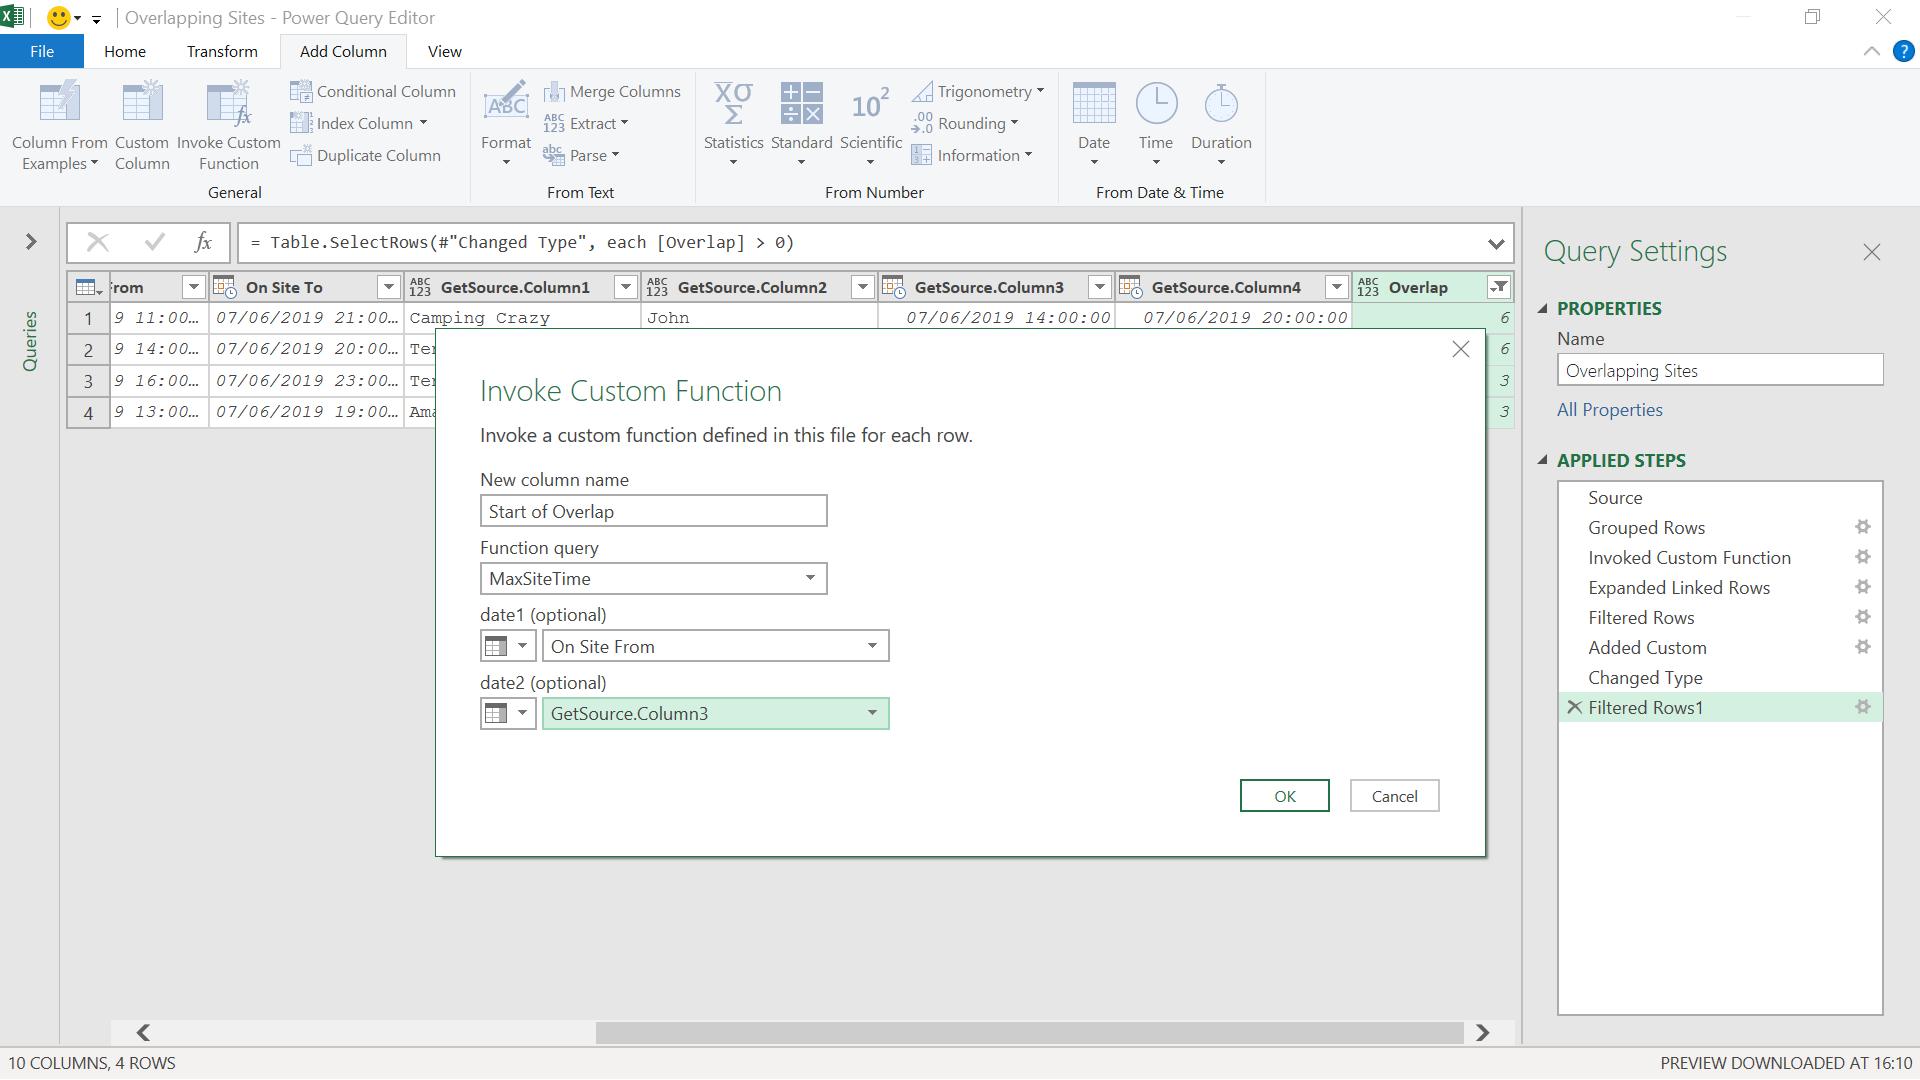
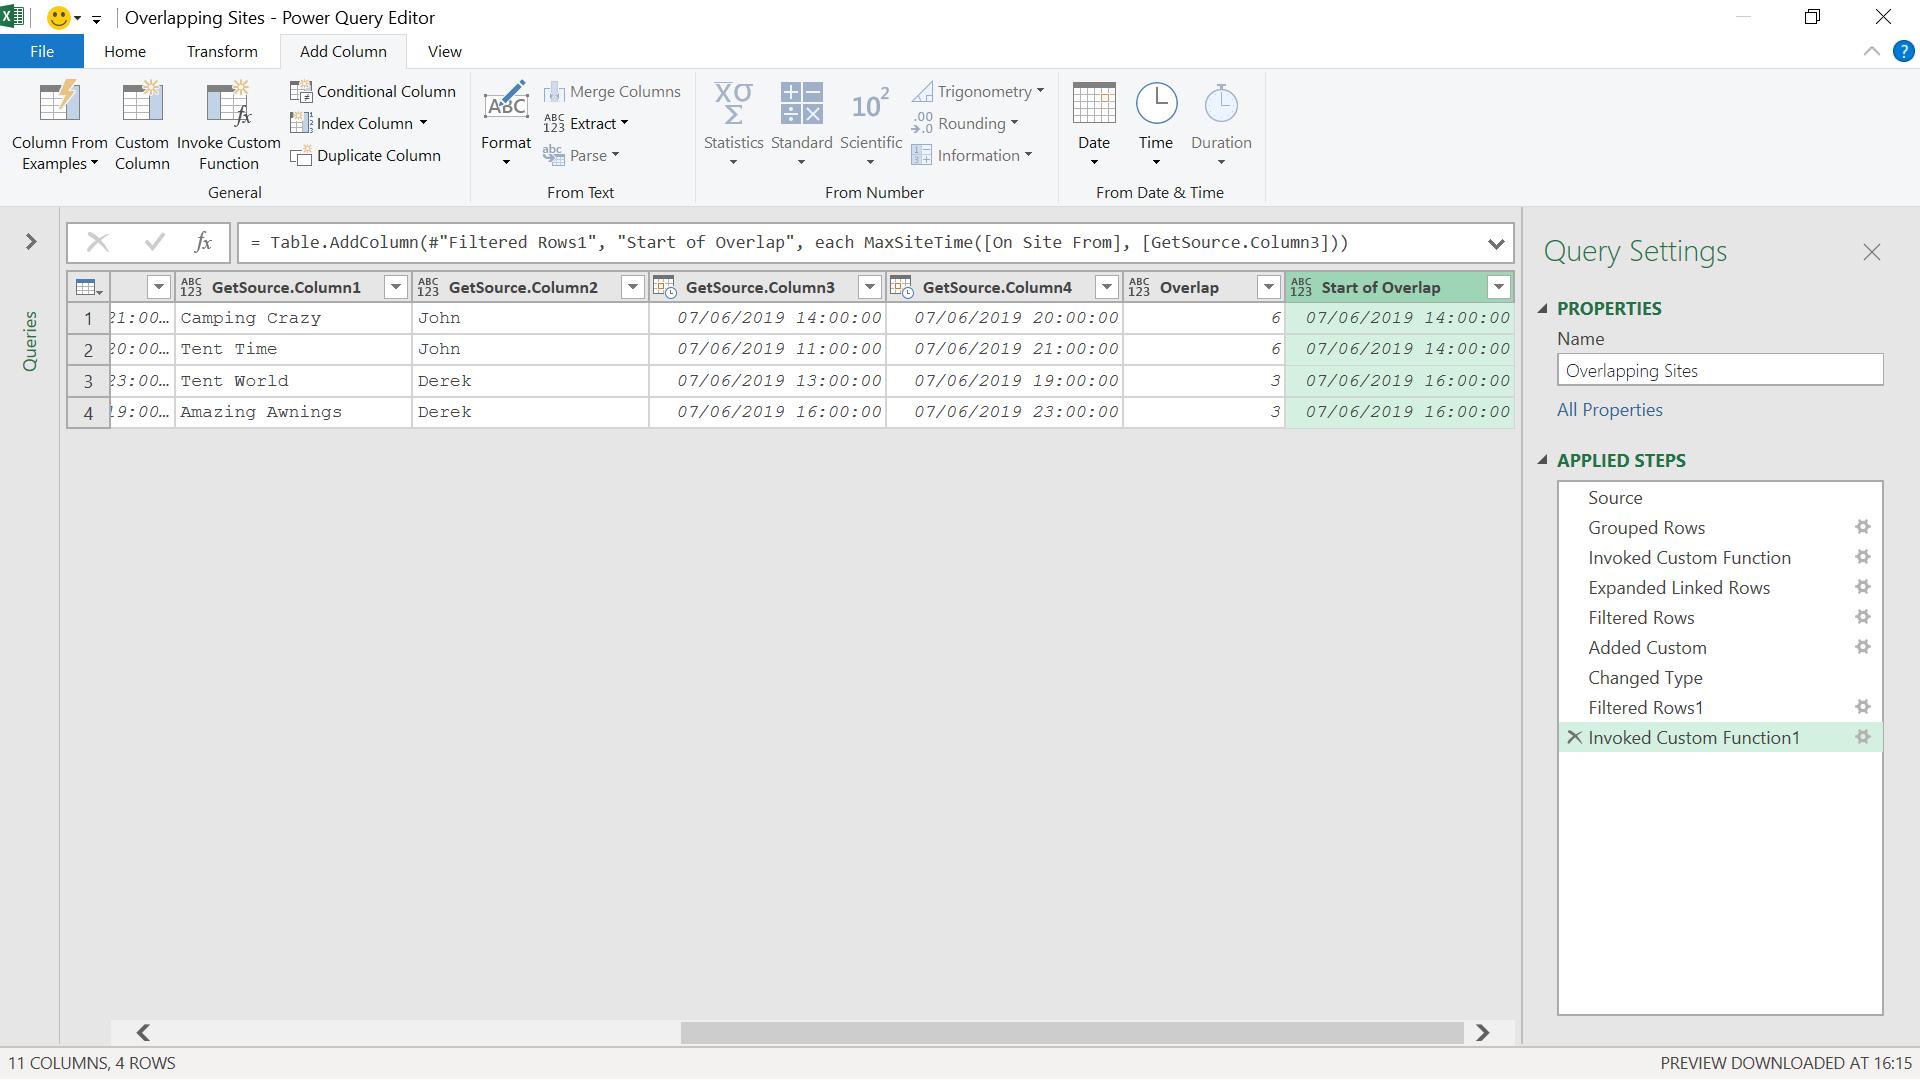
I take the On Site From and GetSource.Column3 (i.e. the linked On Site From), and find the later of the two.
I create another column for the end of the overlap using a similar method.
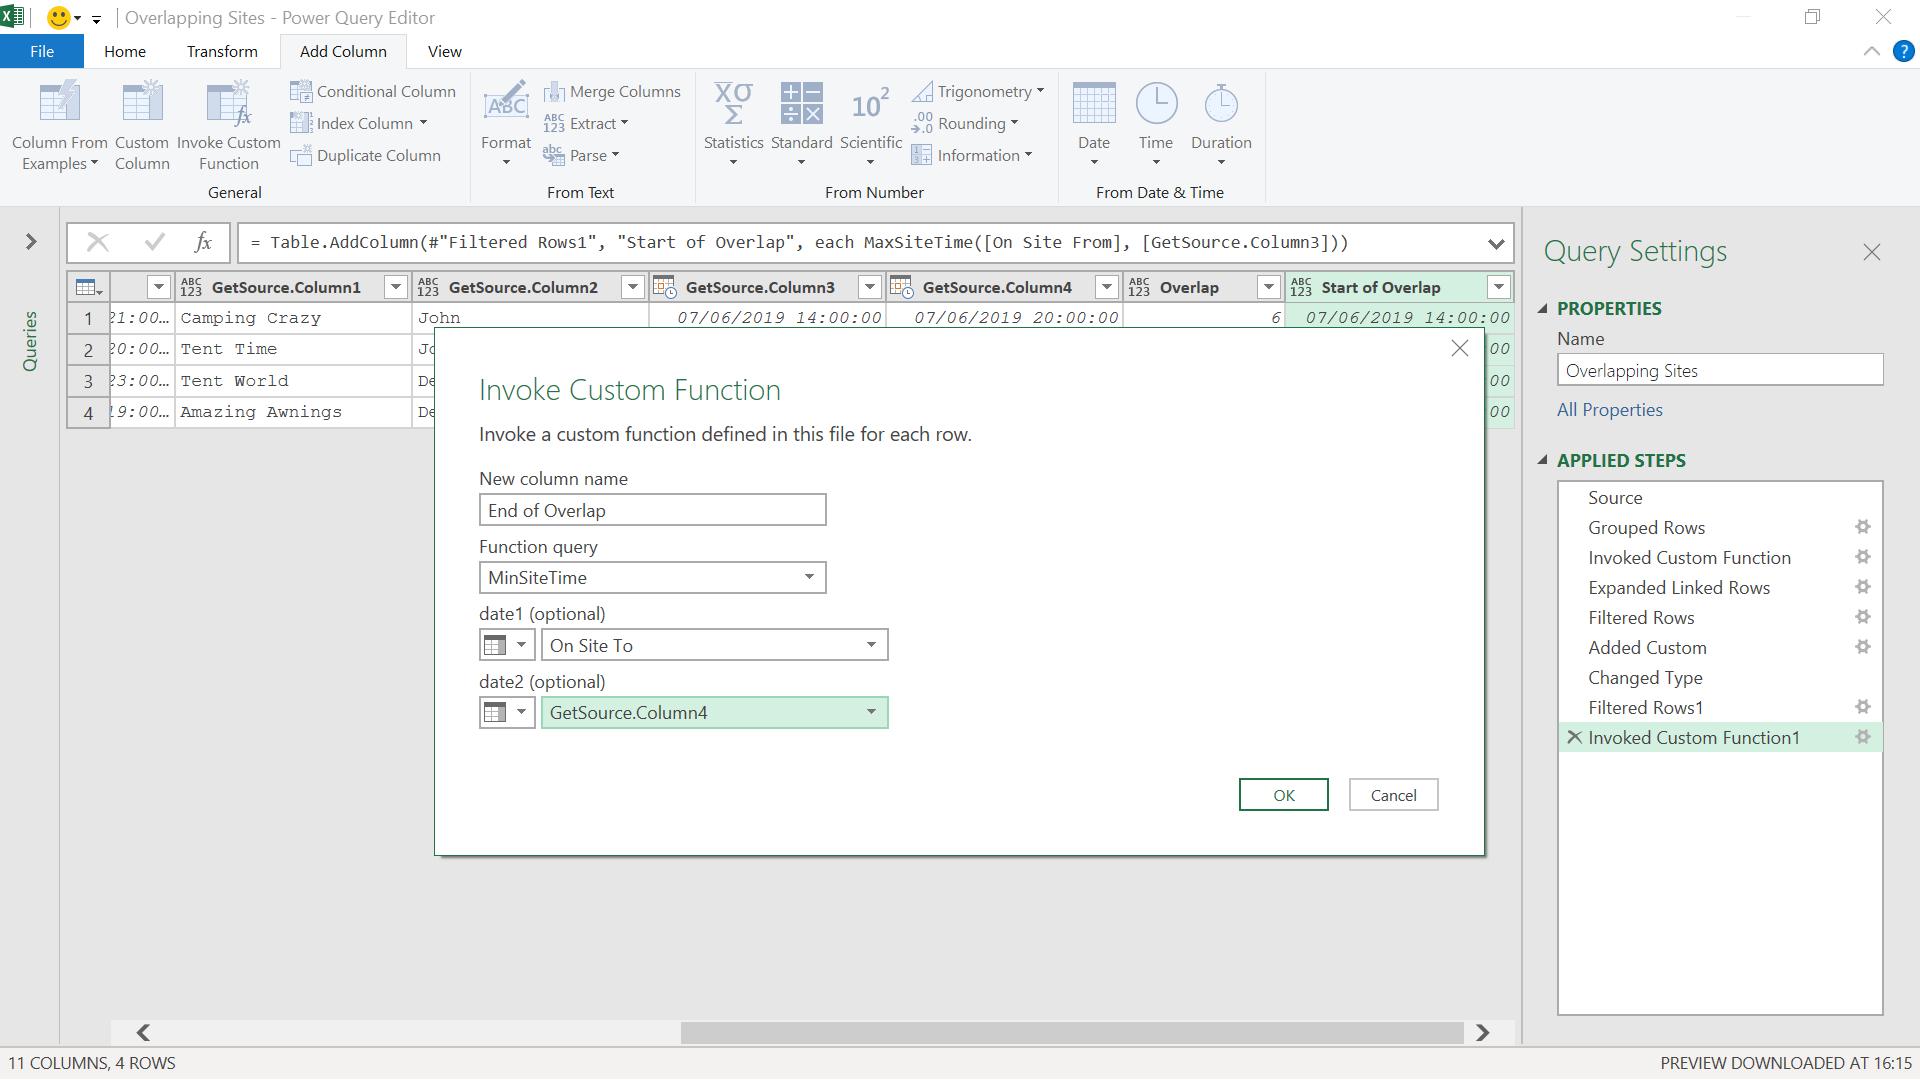
I take the On Site To and GetSource.Column4 (i.e. the linked On Site To), and find the earlier of the two.
I can now remove the GetSource columns and the Salesperson Group column to see my results:
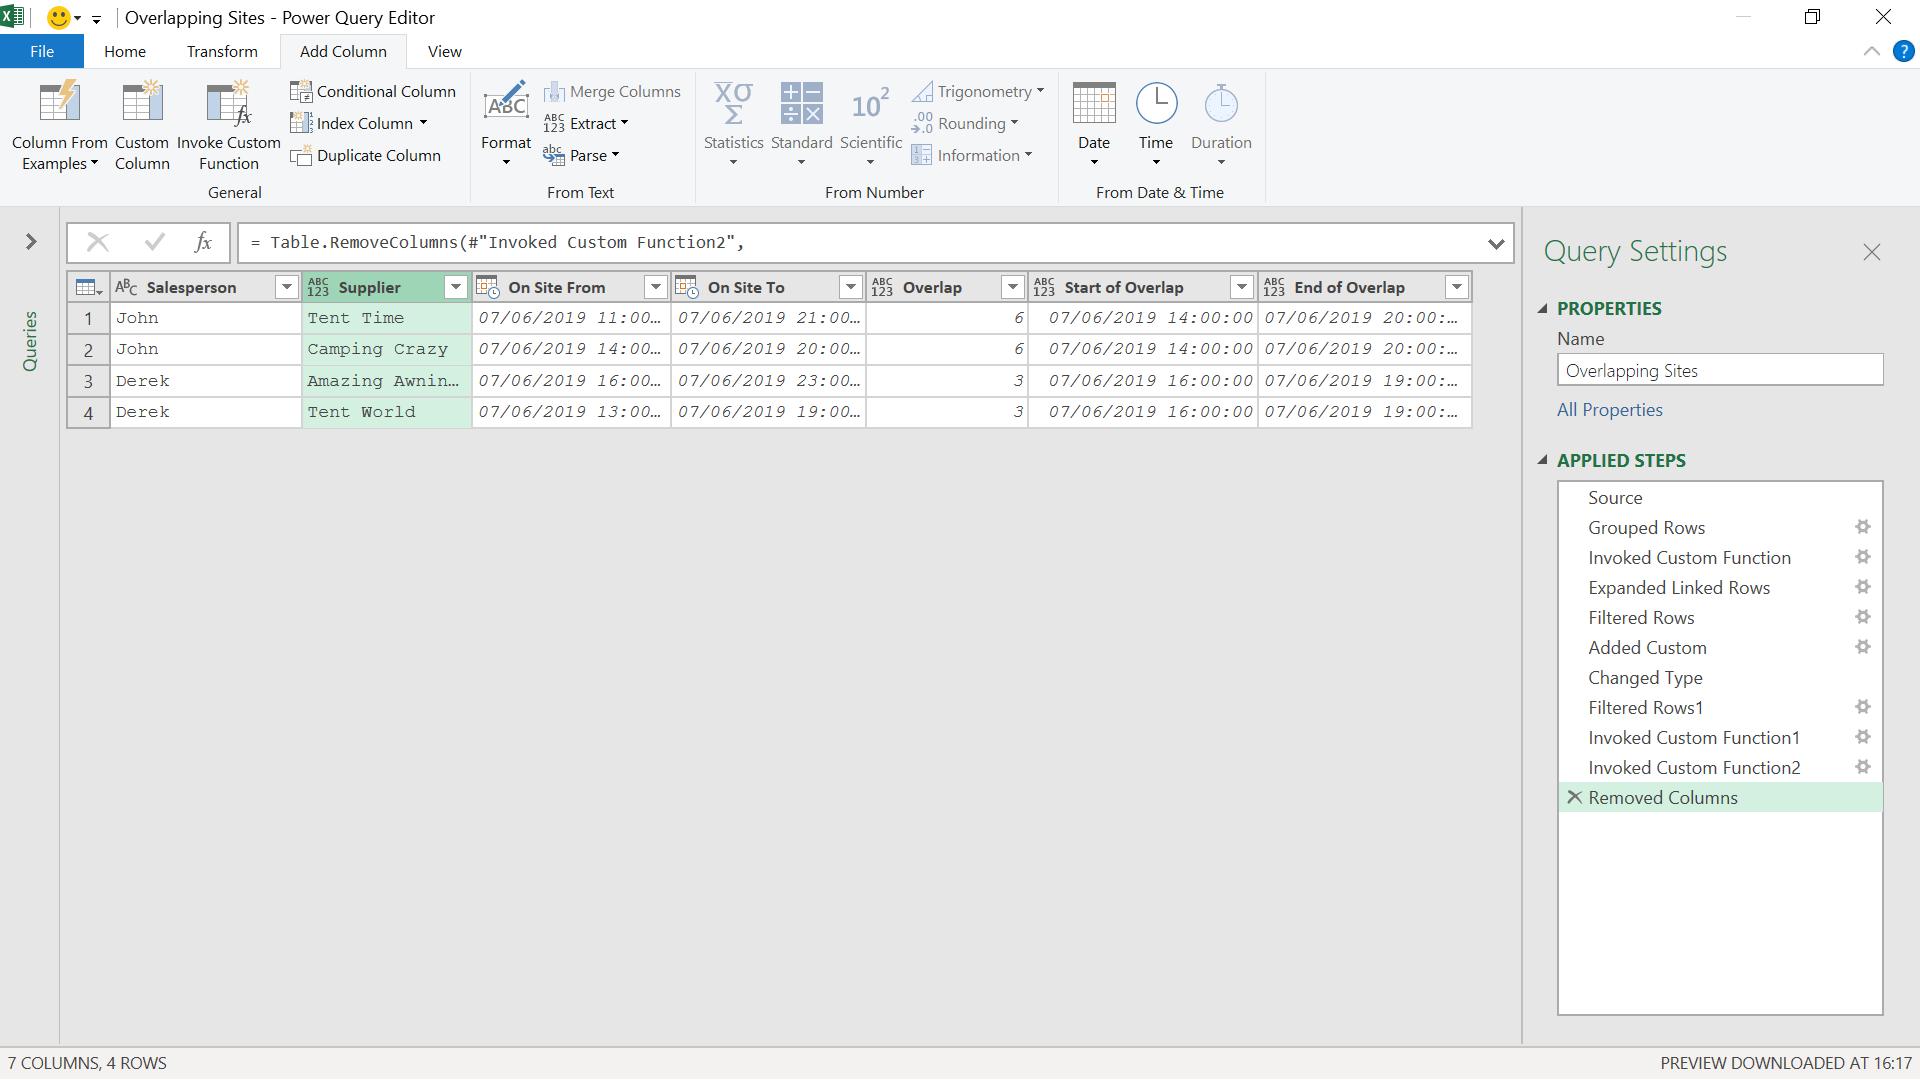
I can now see the overlapping site time in the records for my salespeople and can chase up to see what the recorded times should have been.
Come back next time for more ways to use Power Query!