
Power Query: Group Functions
15 January 2020
Welcome to our Power Query blog. This week, I look at using some M functions on grouped data.
I have some data detailing the commissions that my salespeople have generated this year.
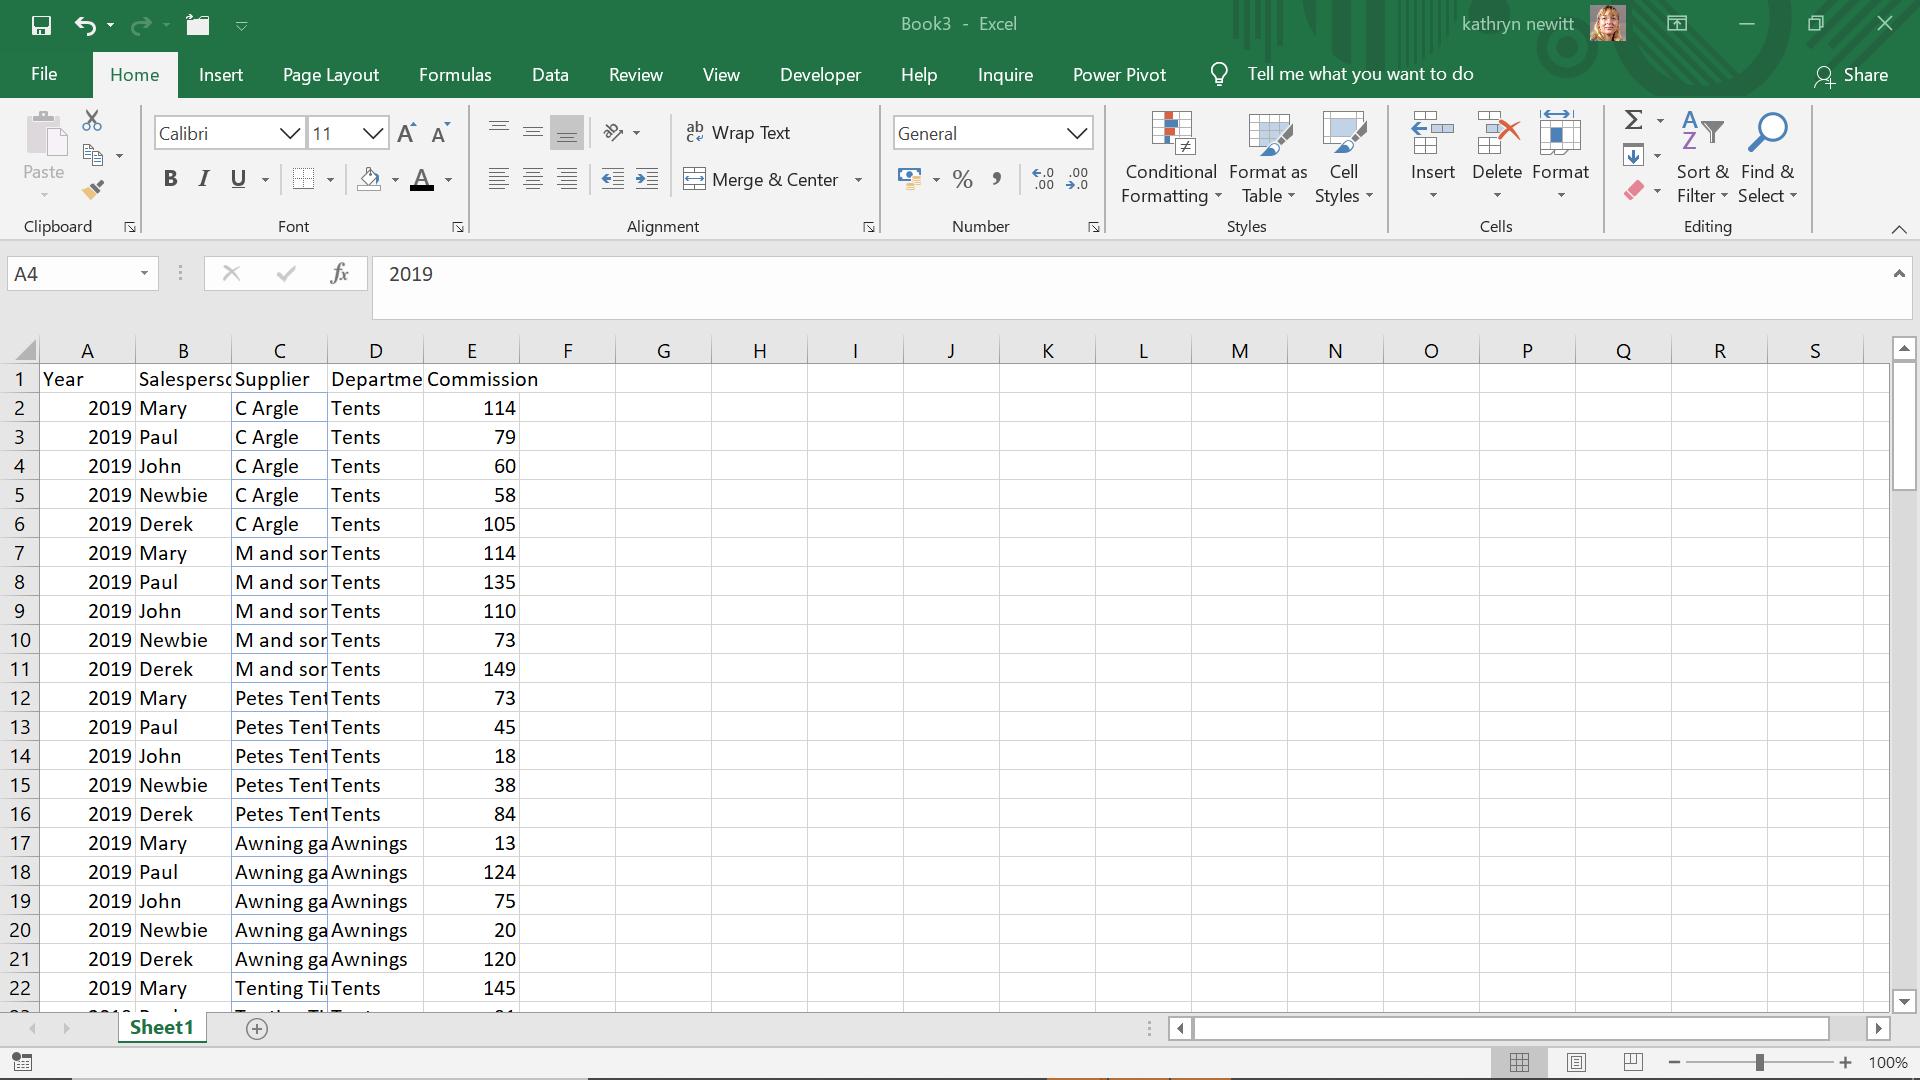
I issue seasonal prizes to the salespeople who achieve the highest 3 commissions for each department. Time to find out who won this year…
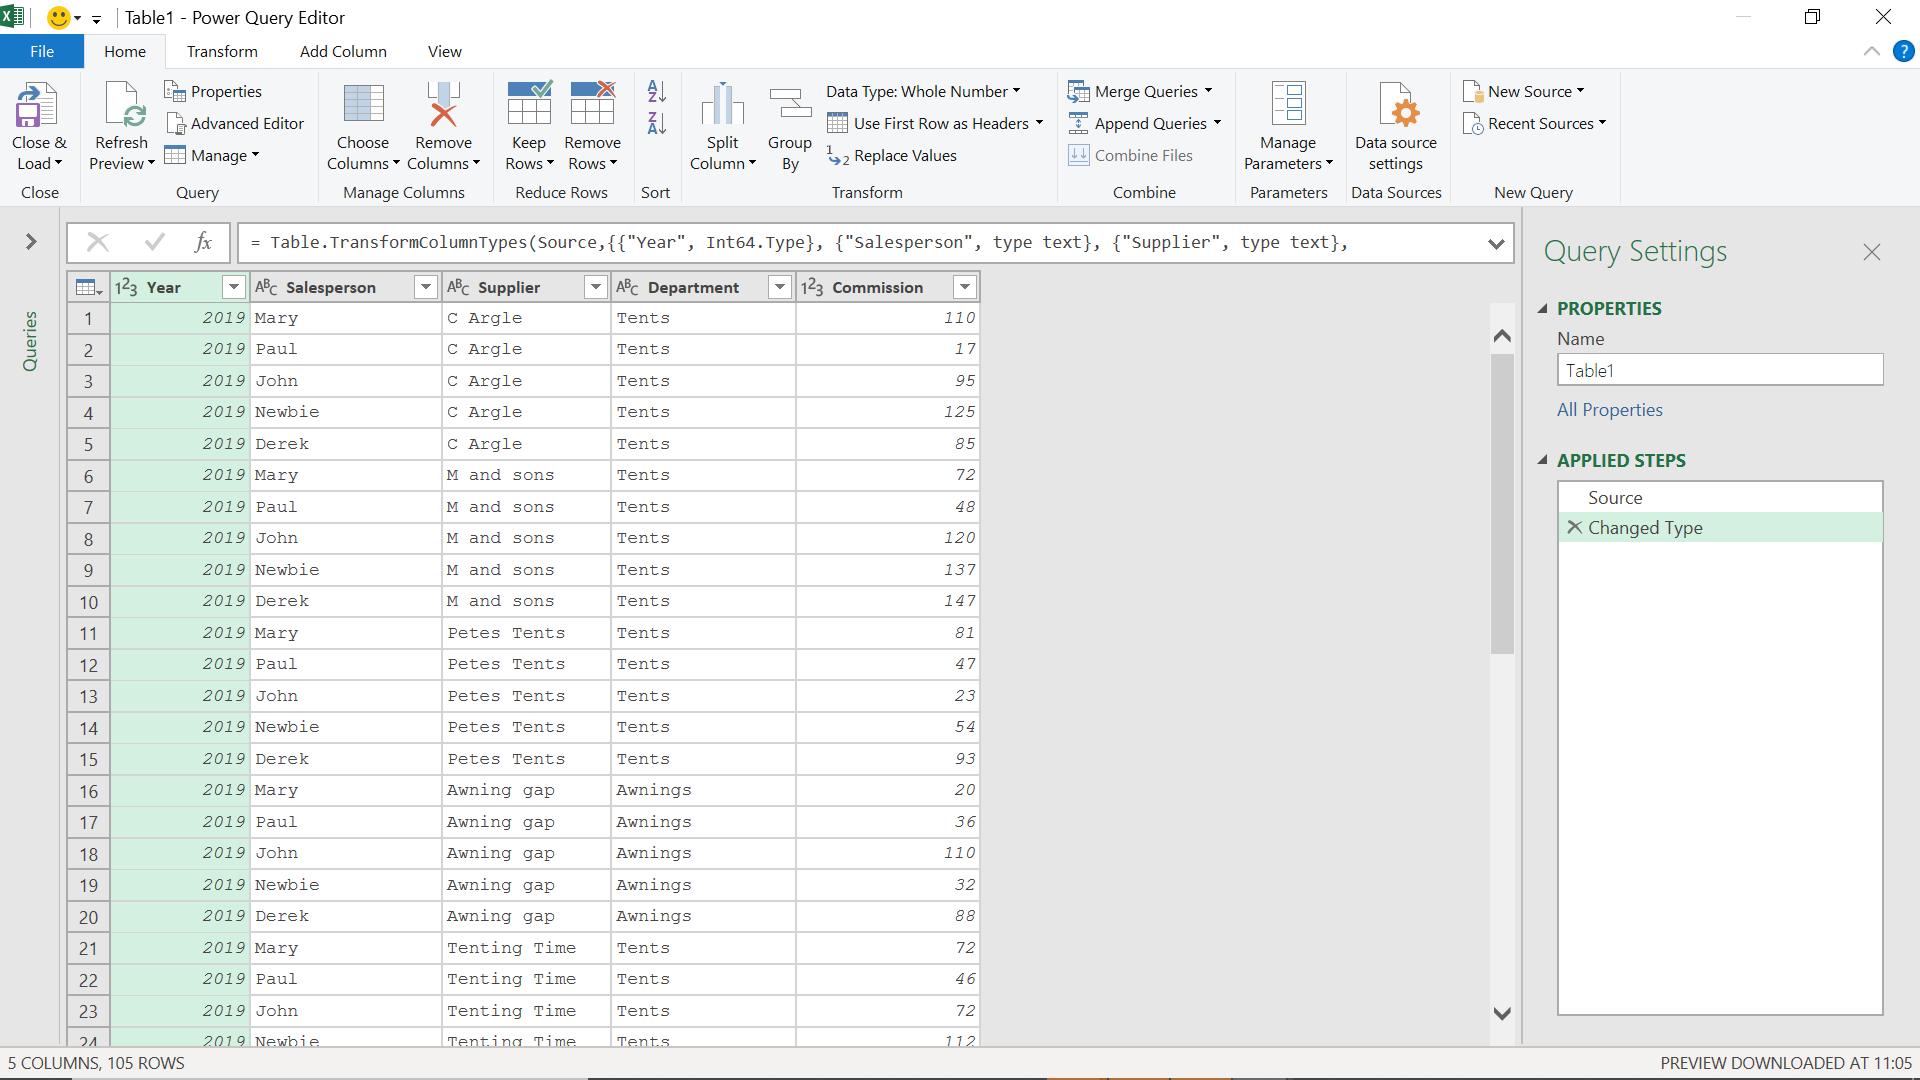
I start by extracting my data to Power Query using ‘From Table’ in the ‘Get & Transform’ section of the ‘Data’ tab.
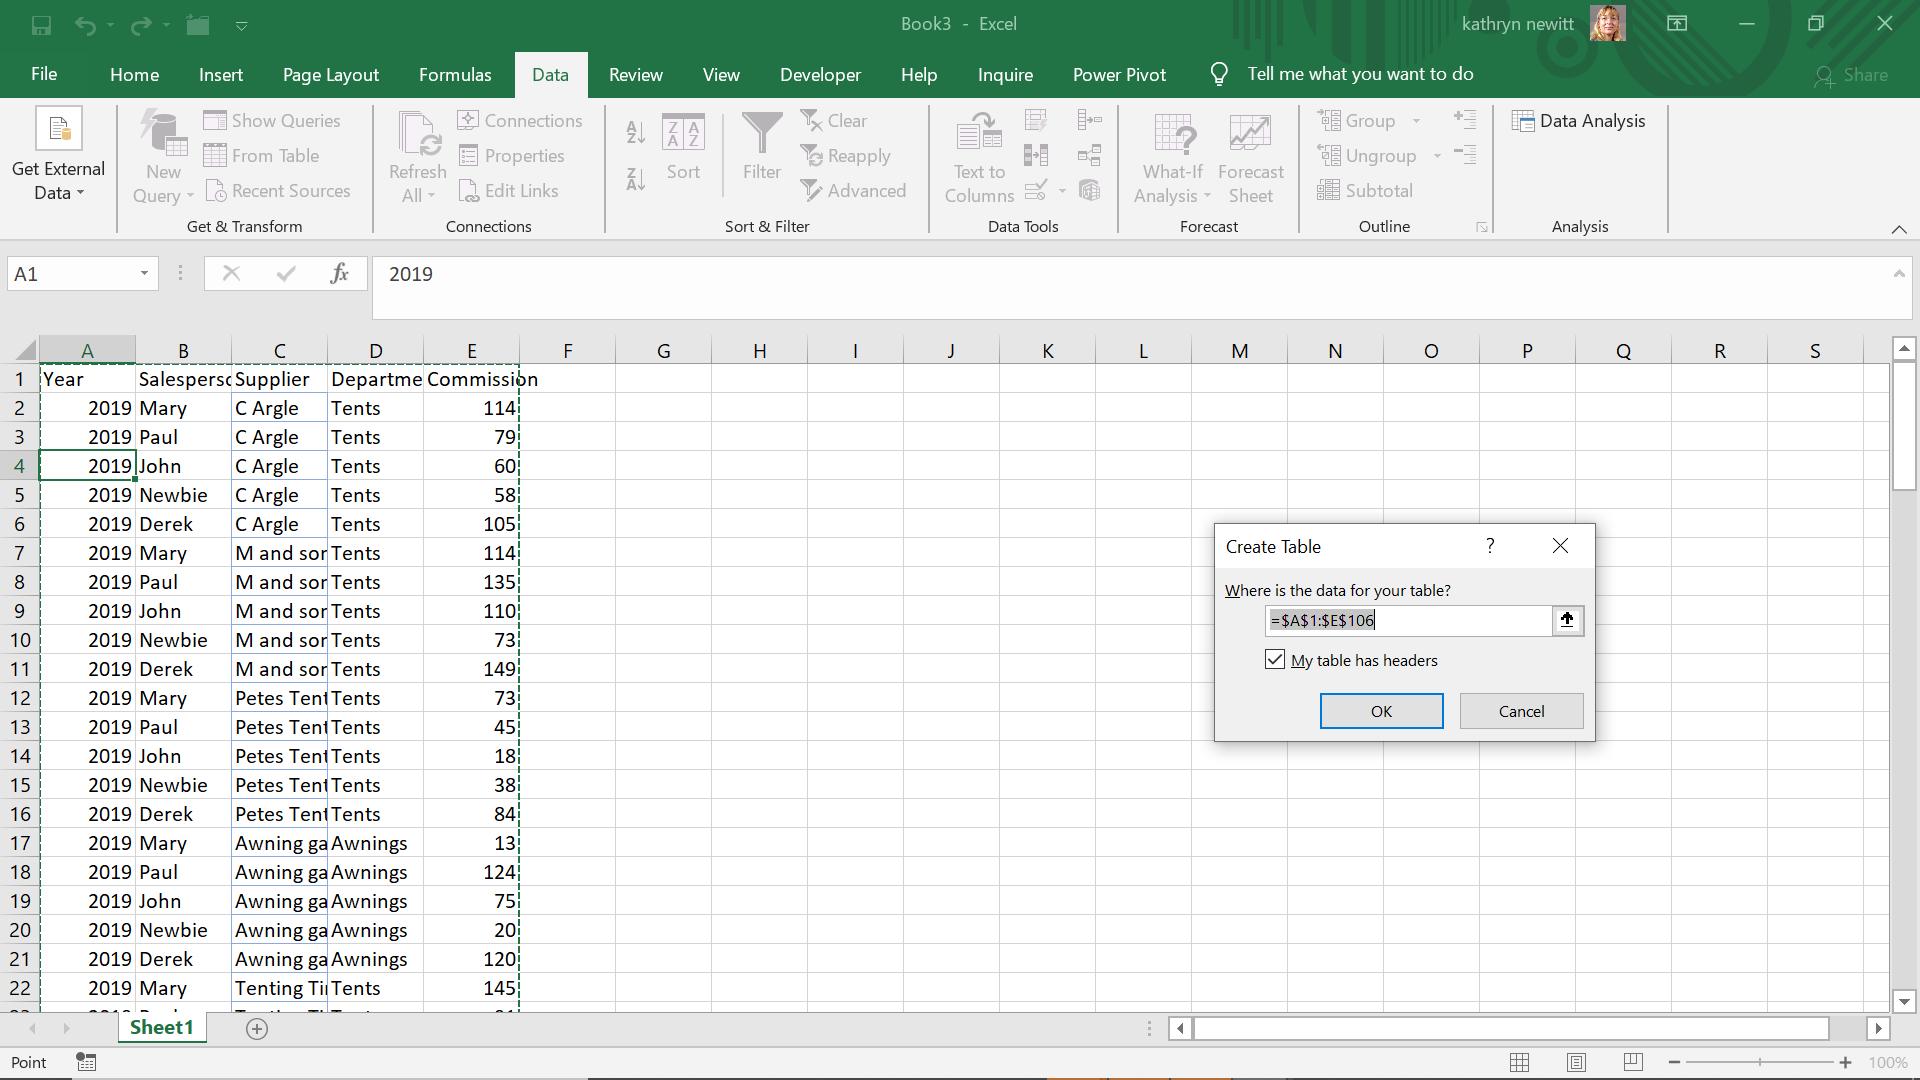
I take the defaults as I have headings.
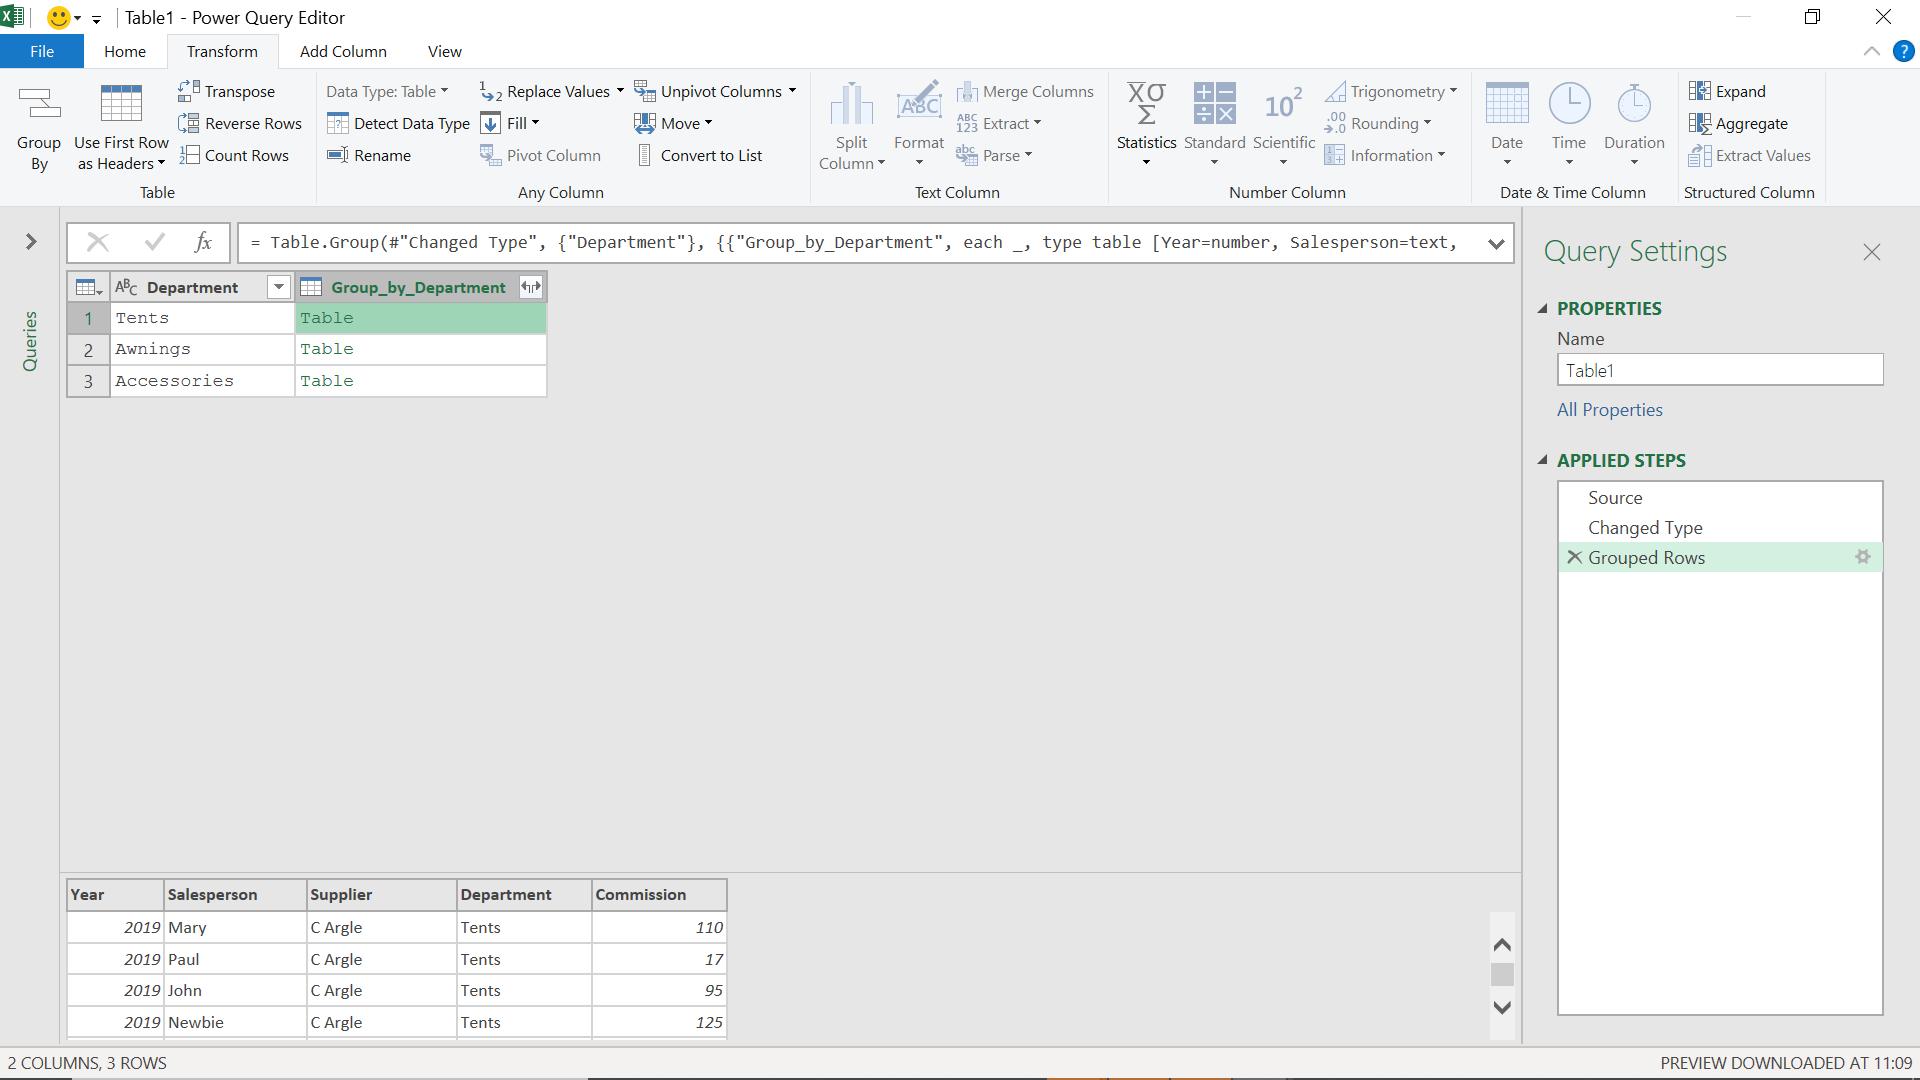
I want to begin by summarising my data, so I will use the ‘Group By’ function in the ‘Transform’ tab.
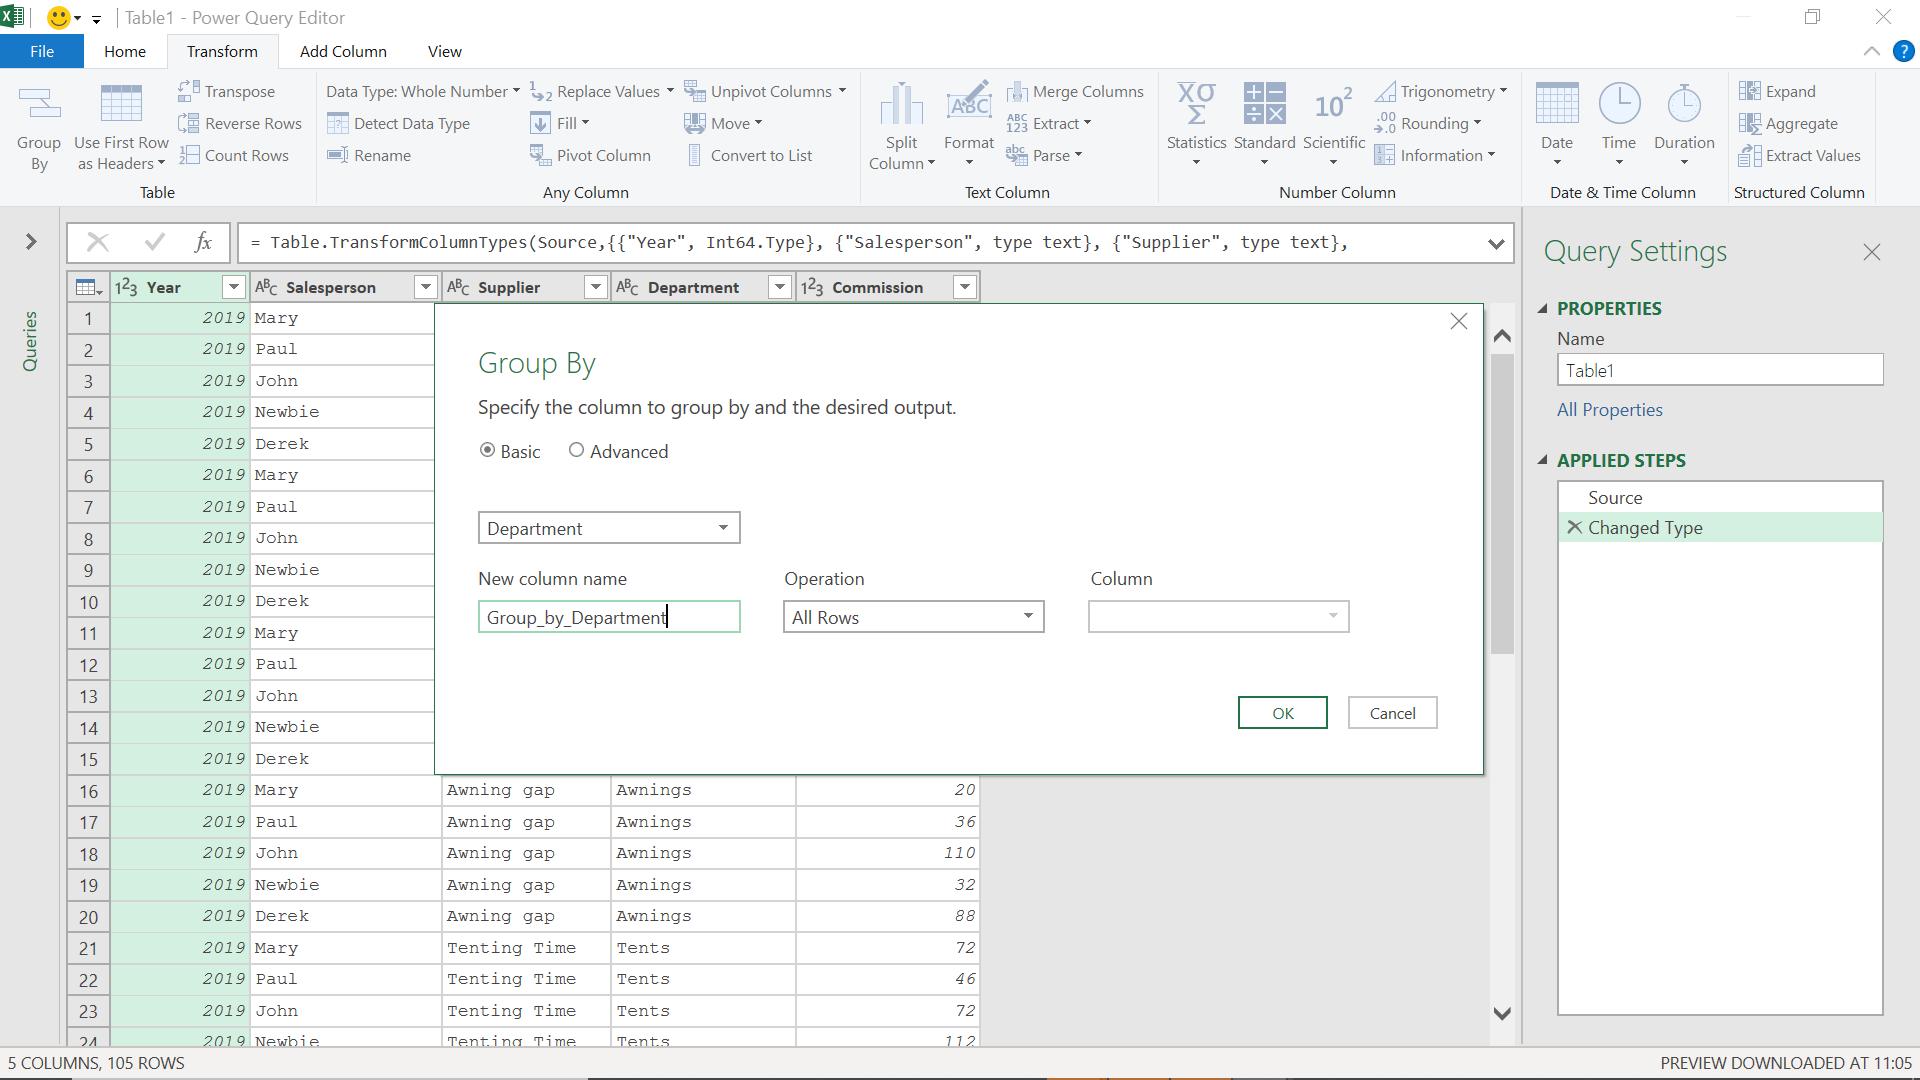
I decide to group by Department.
I need to sort my data by Commission, and then pick the top three (3) commissions. Since this is inside the table, I will use an M function. This function can sort my table and select the top three rows.
Table.MaxN(table as table, comparisonCriteria as any, countOrCondition as any) as table
This returns the largest row(s) in the table, given the comparisonCriteria. After the rows are sorted, the countOrCondition parameter must be specified to further filter the result. Note the sorting algorithm cannot guarantee a fixed sorted result. The countOrCondition parameter can take multiple forms:
- if a number is specified, a list of up to countOrCondition items in ascending order is returned
- if a condition is specified, a list of items that initially meet the condition is returned. Once an item fails the condition, no further items are considered.
The M code I am going to use is:
= Table.MaxN([Group_by_Department],{{"Commission", Order.Ascending}}, 3)
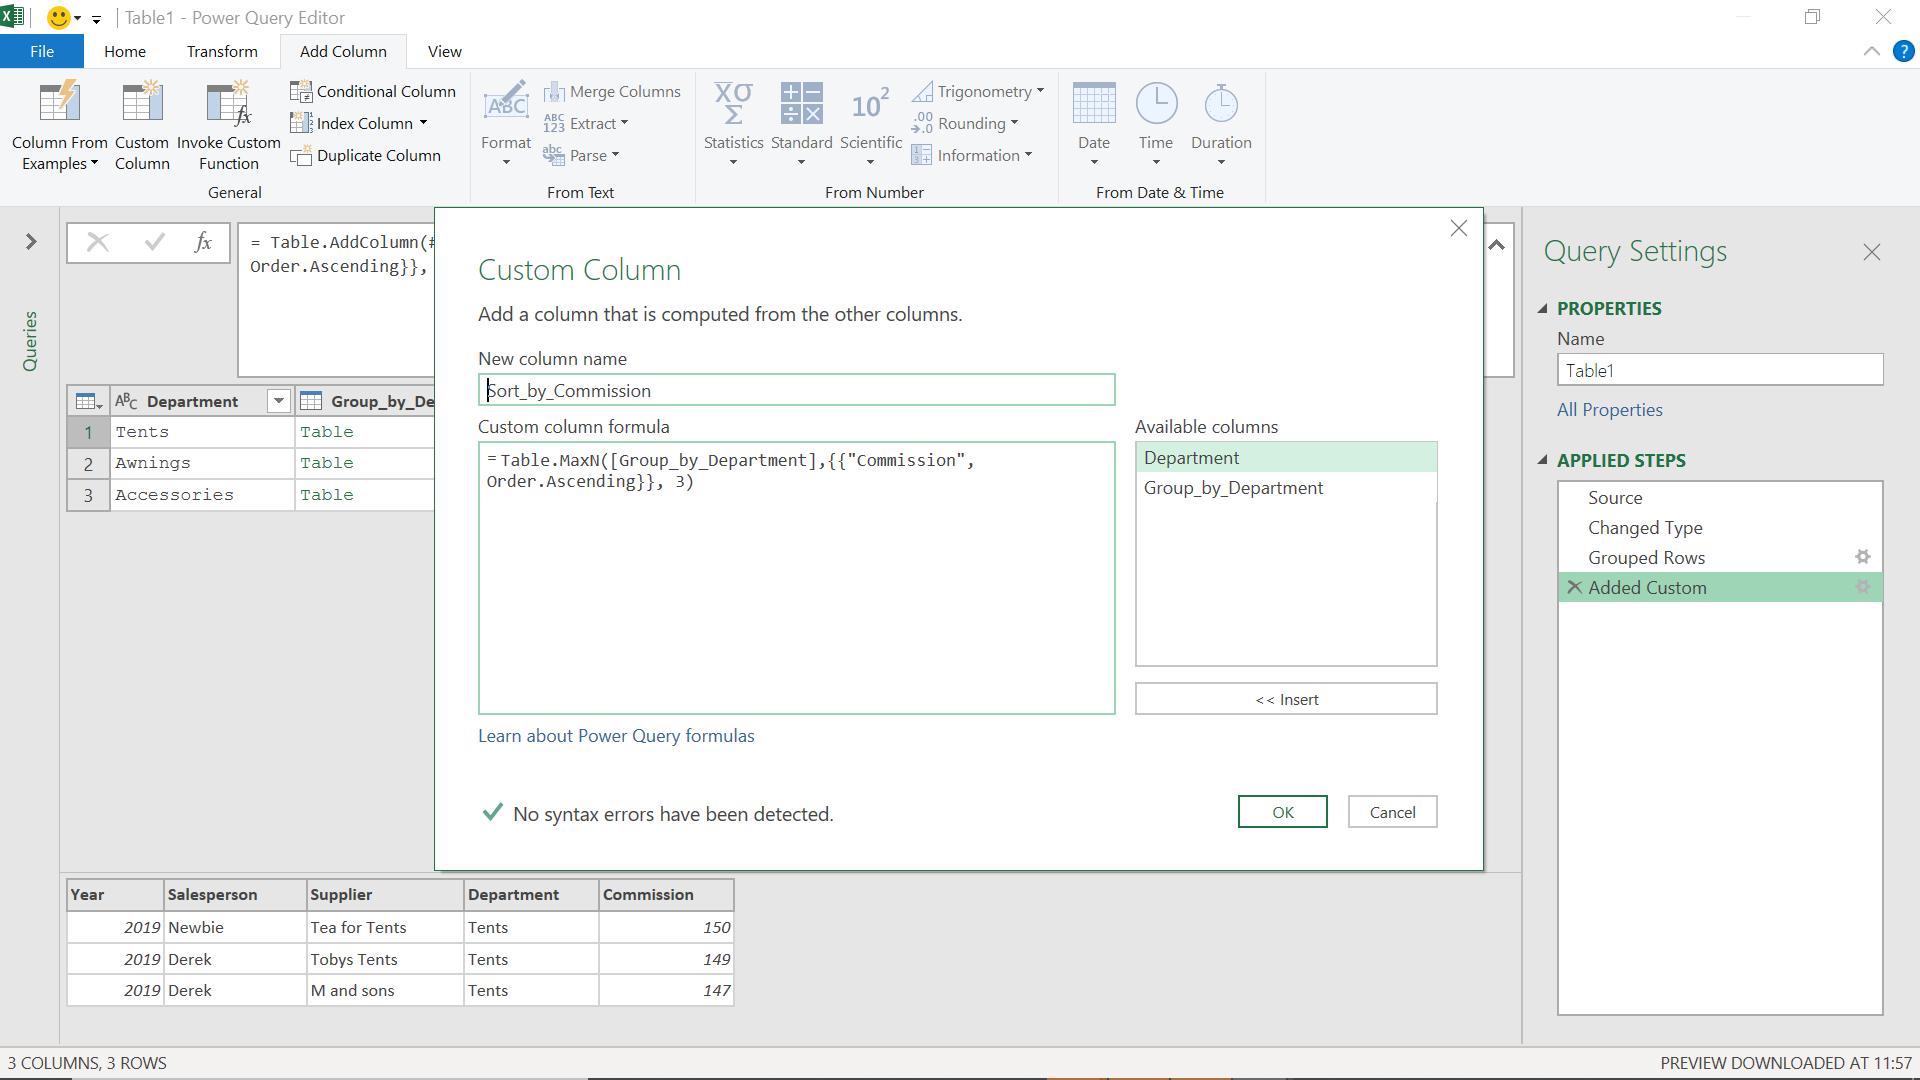
This gives me a new column:
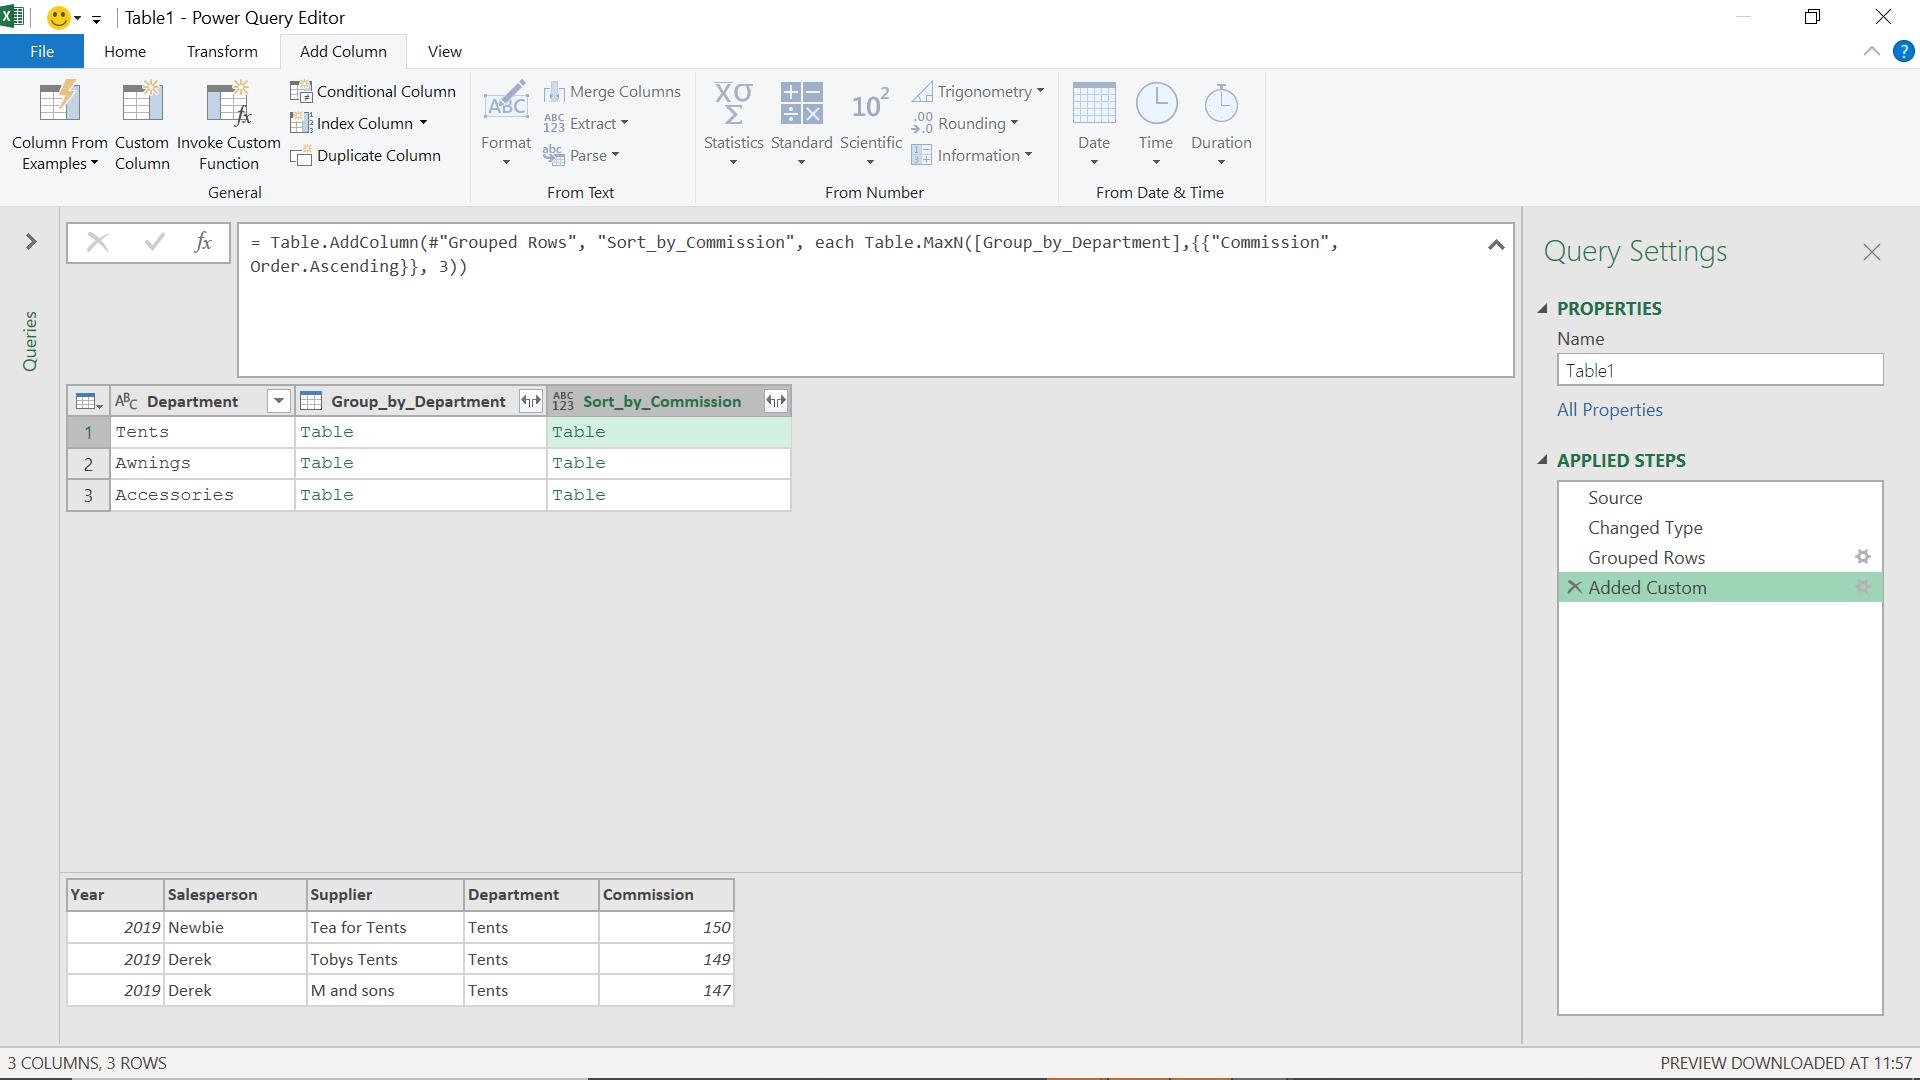
I can see my new column contains the top three commissions for each department. Now, I’d like to add a ranking to make the results clearer. To do this, I add another column which will hold the table with the rank data. I use another M function.
Table.AddIndexColumn(table as table, newColumnName as text, optional initialValue as nullable number, optional increment as nullable number) as table
This appends a column named newColumnName to the table with explicit position values. An optional value, initialValue, represents the initial index value. An optional value, increment, specifies how much to increment each index value.
The M code I will use is:
= Table.AddIndexColumn([Sort_by_Commission],"Ranking",1,1)
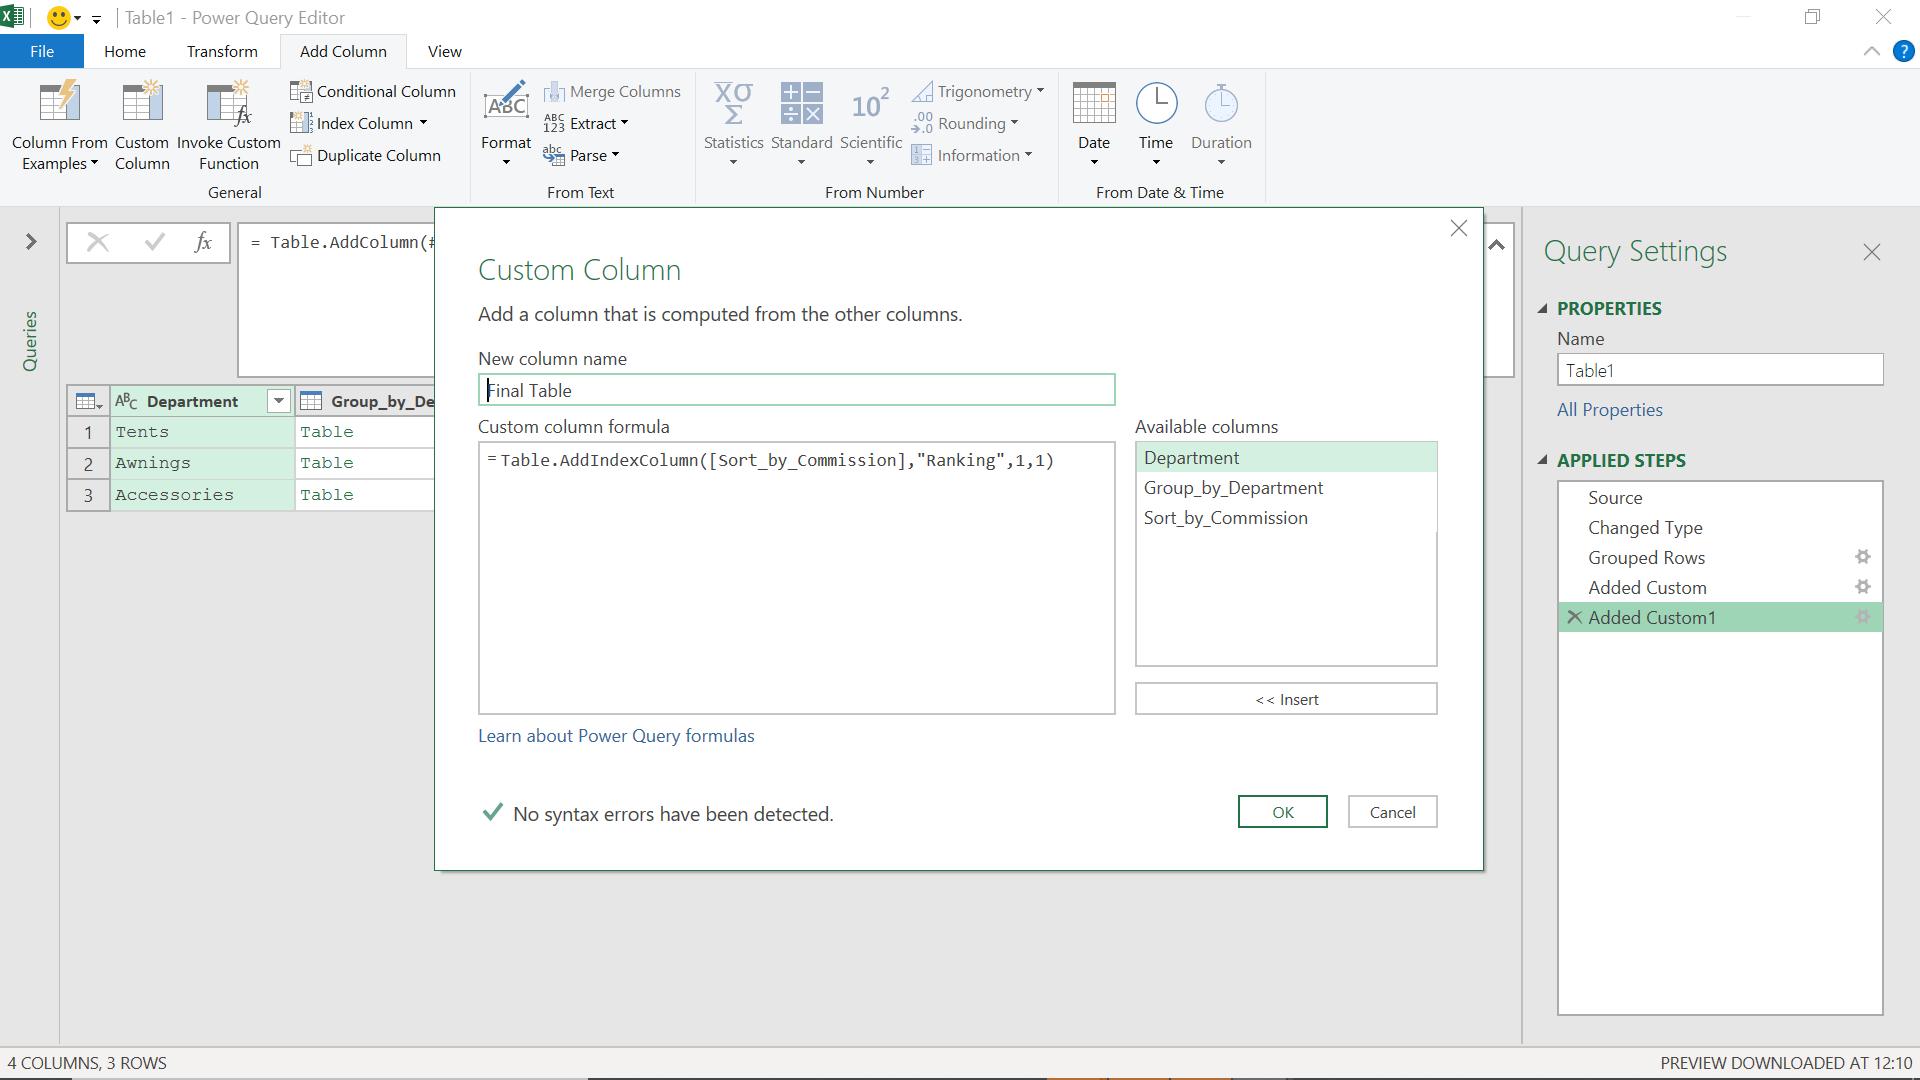
This gives me a new column:
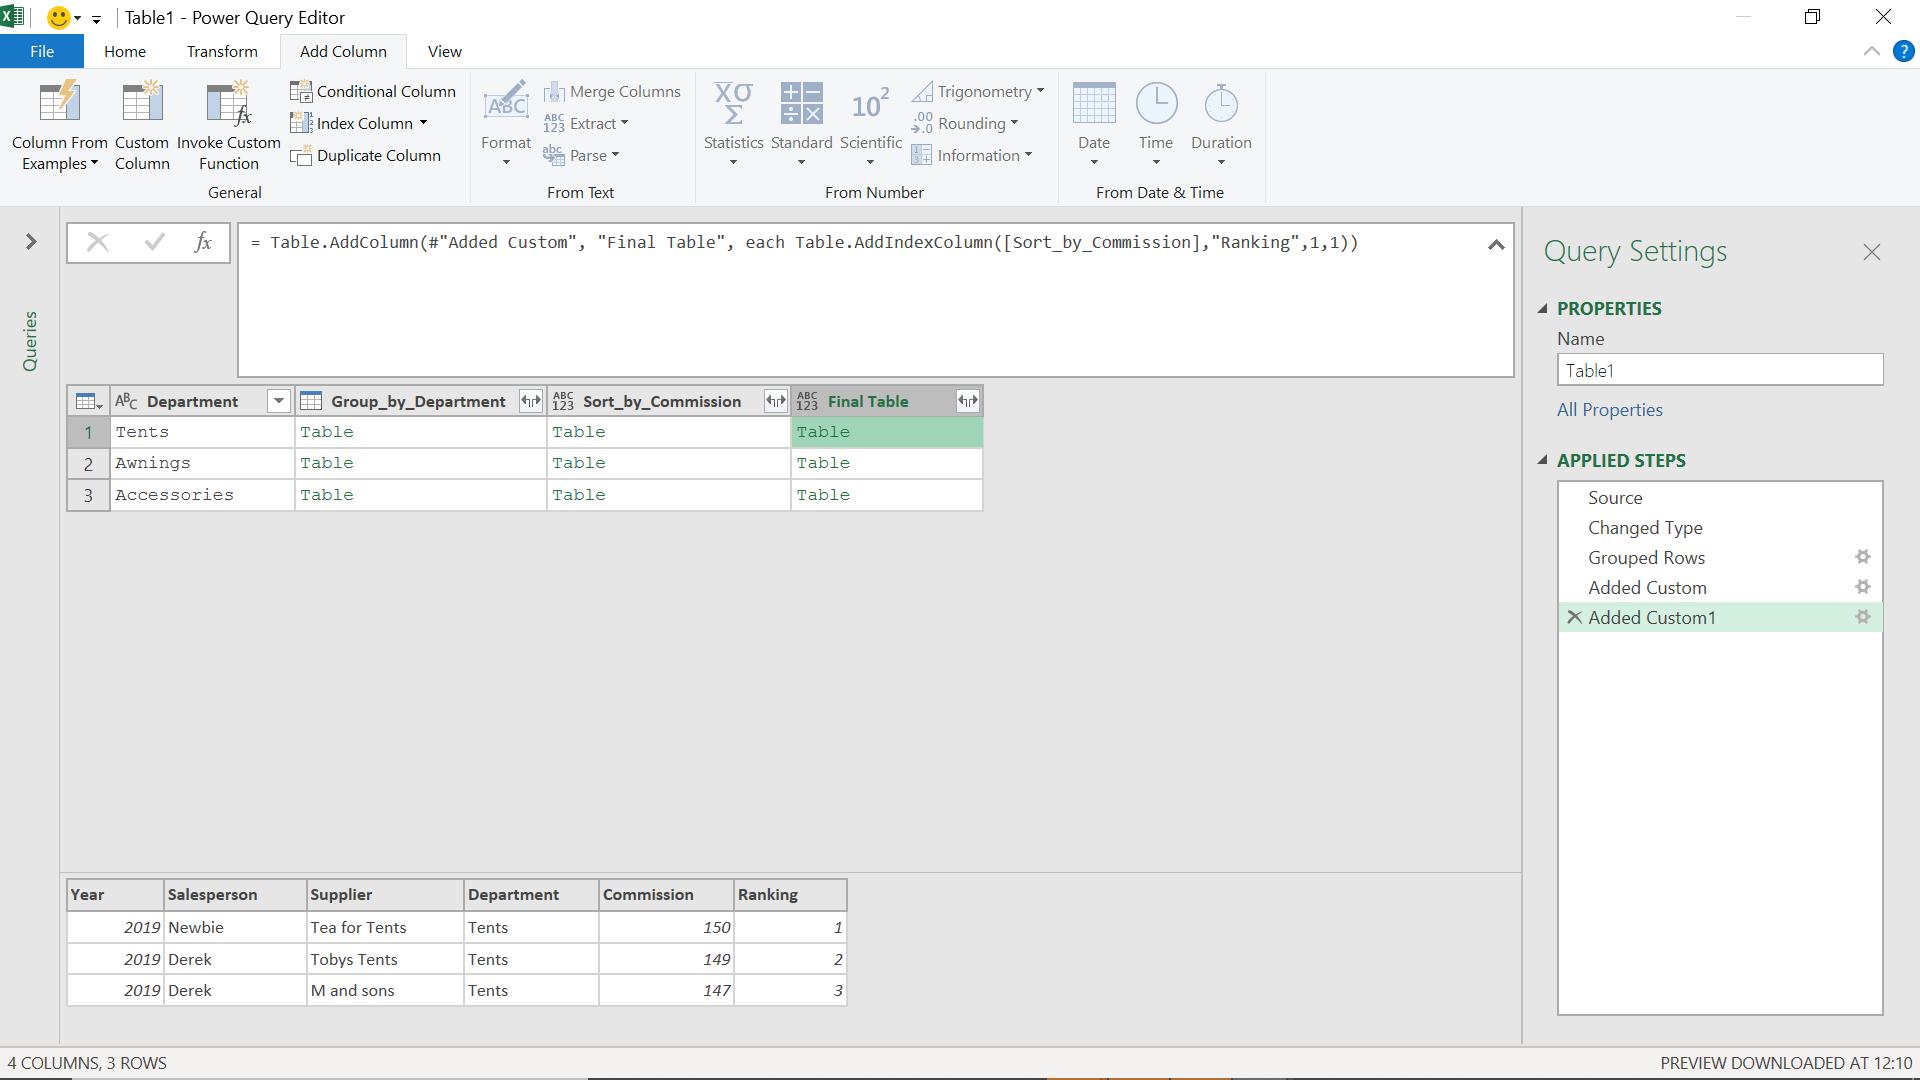
I can now expand this column so that I can see my results.
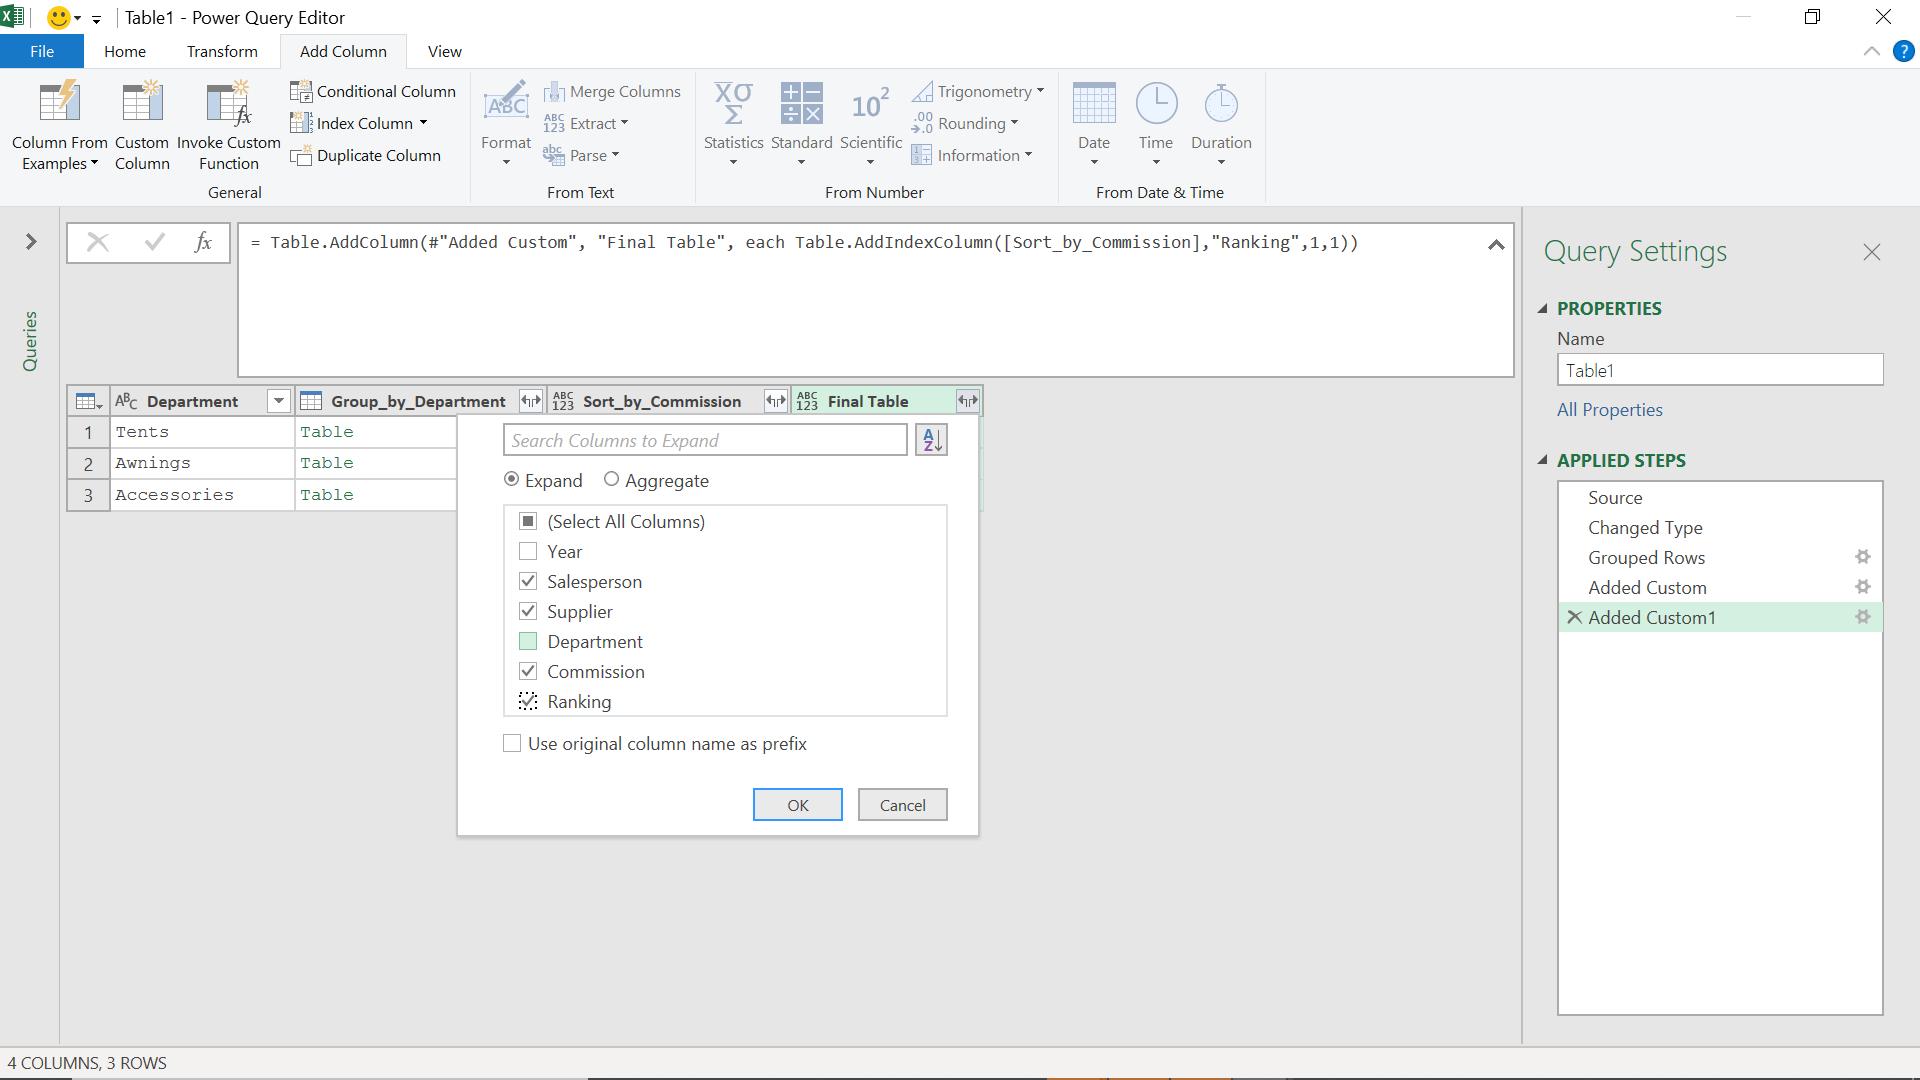
I choose to see Salesperson, Supplier, Commission and Ranking, as I already have Department, and I know the year is the same for all rows. I don’t want to ‘use original column name as a prefix’.
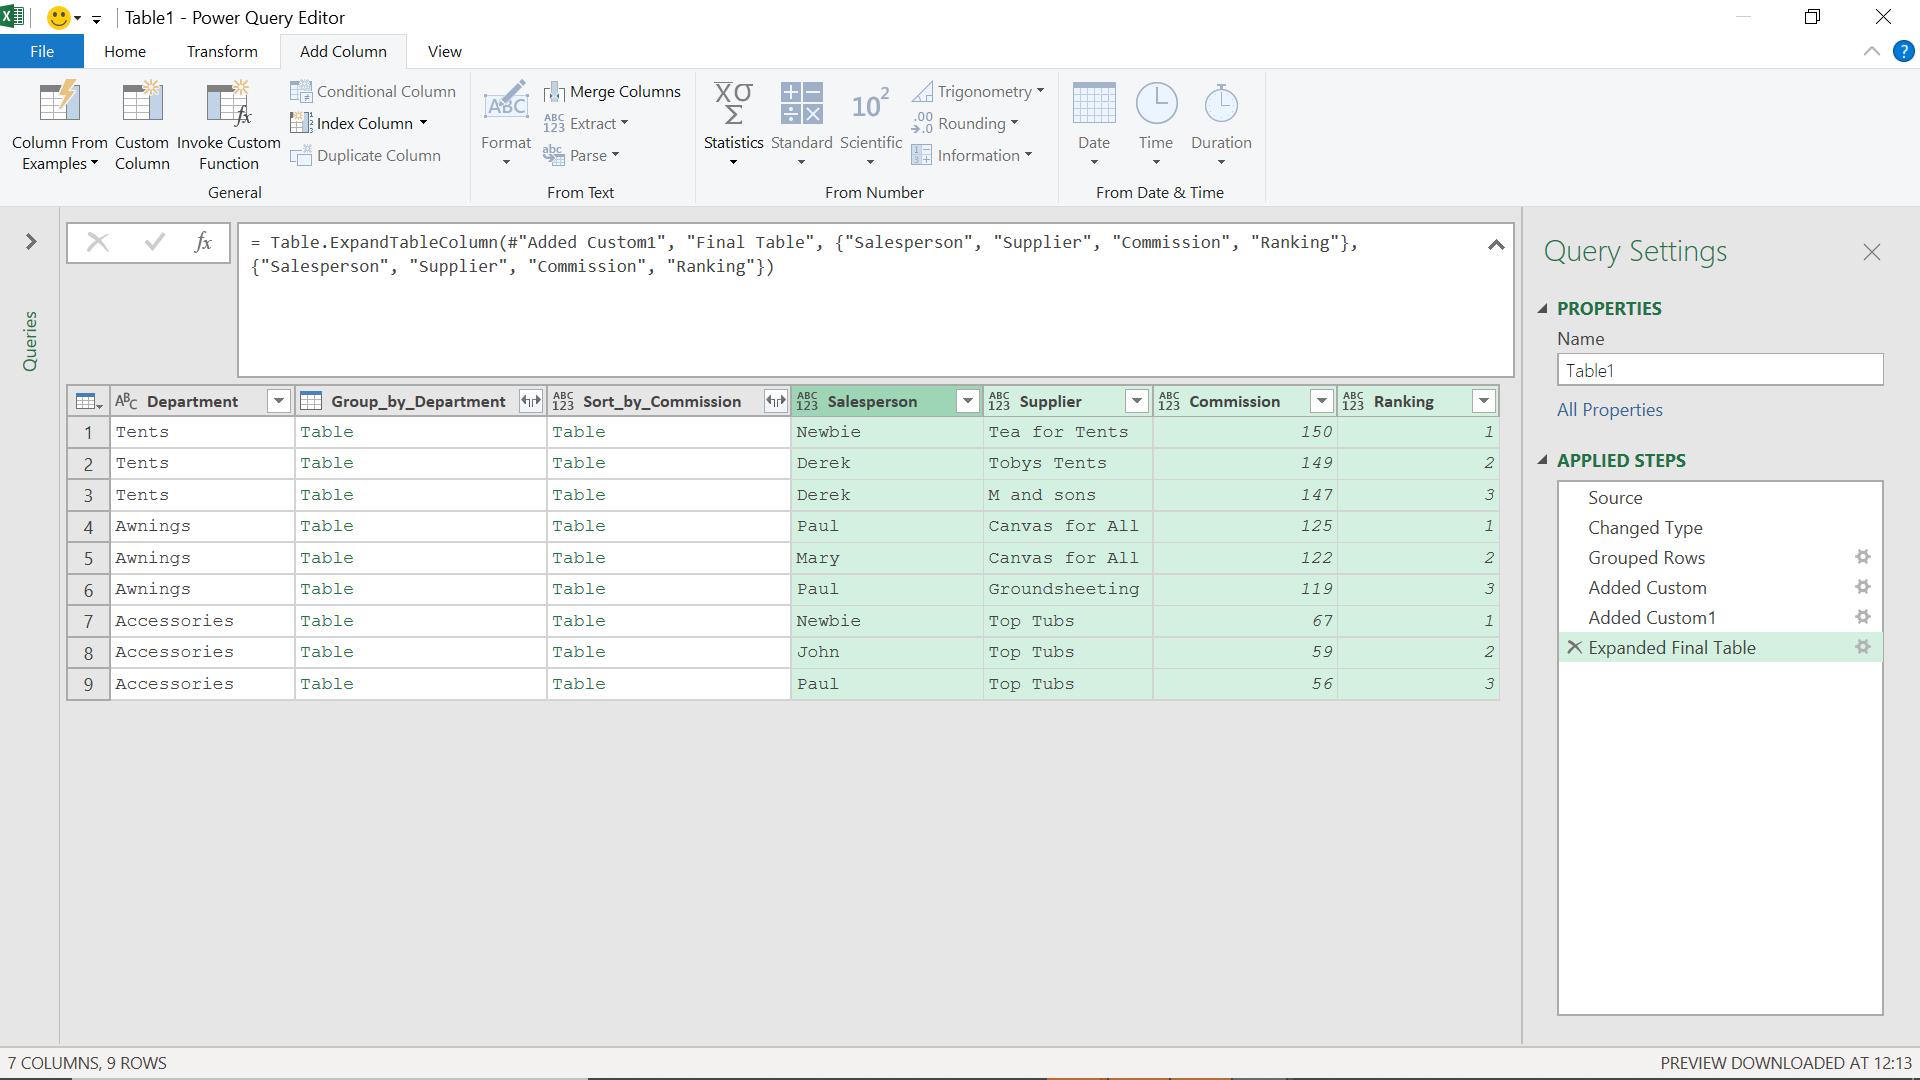
Newbie is the clear winner, with Derek also doing very well. Time for the annual prizes to be issued!
Come back next time for more ways to use Power Query!