
Power Query: Divide and Conquer
8 May 2019
Welcome to our Power Query blog. Today, I am going to look at a method to extract multiple columns from a single column of mixed data.
John, my star imaginary salesperson, has some new contact details, which he has sent in an Excel workbook. All in one column. I need to create a table from this. I will use a different method from the one I used in Power Query: Candid Columns.
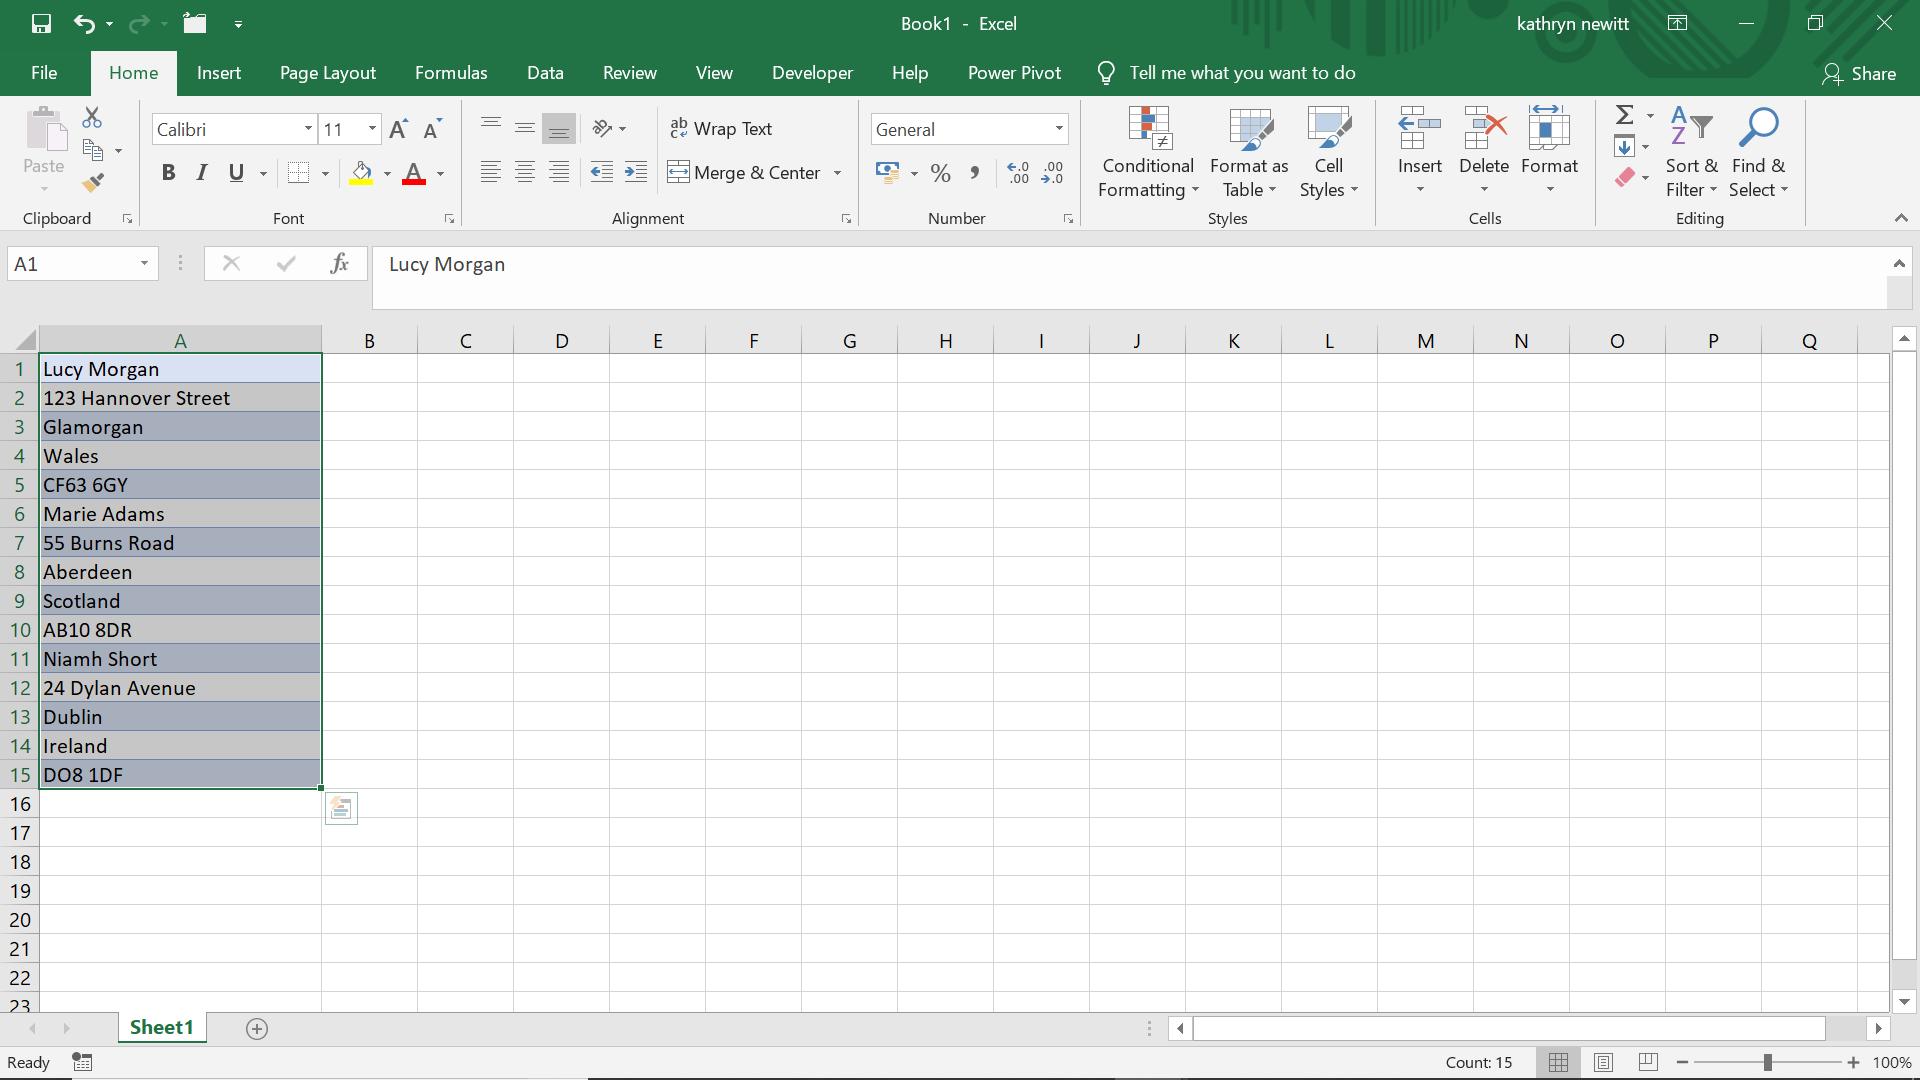
There are many ways to approach this, and this time, I am going to use a list. I start by extracting my data into Power Query by using ‘From Table’ on the ‘Get & Transform’ section of the ‘Data’ tab.
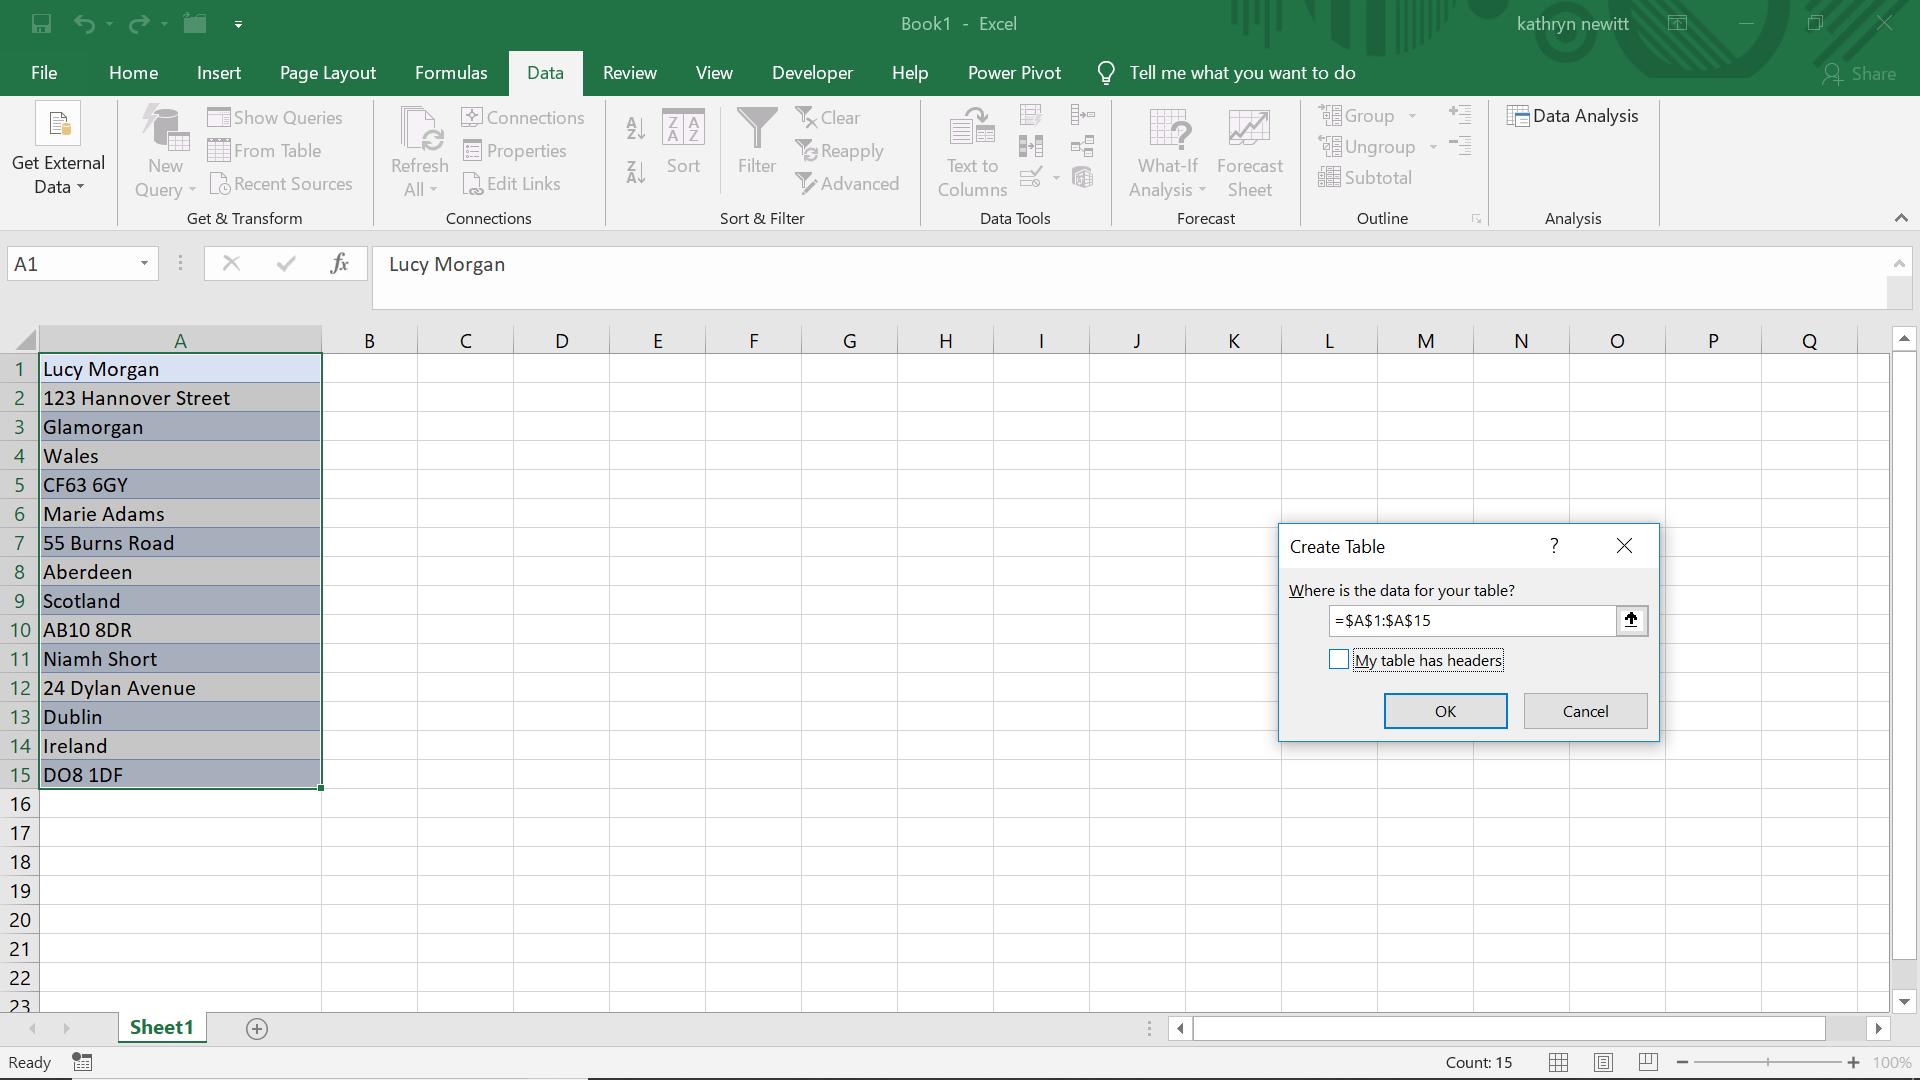
On this occasion, my Table does not have headers, so I uncheck the box.
In case you are wondering why this checkbox is sometimes checked and sometimes isn’t. it’s to with Excel identifying the data type in the first row of each field and comparing it with subsequent rows’ data types. If the first row is text and all subsequent rows are numerical, ‘My table has headers’ would be checked, as this seems quite clear. Here, all rows are text – hence the box is unchecked, as Excel is not so sure.
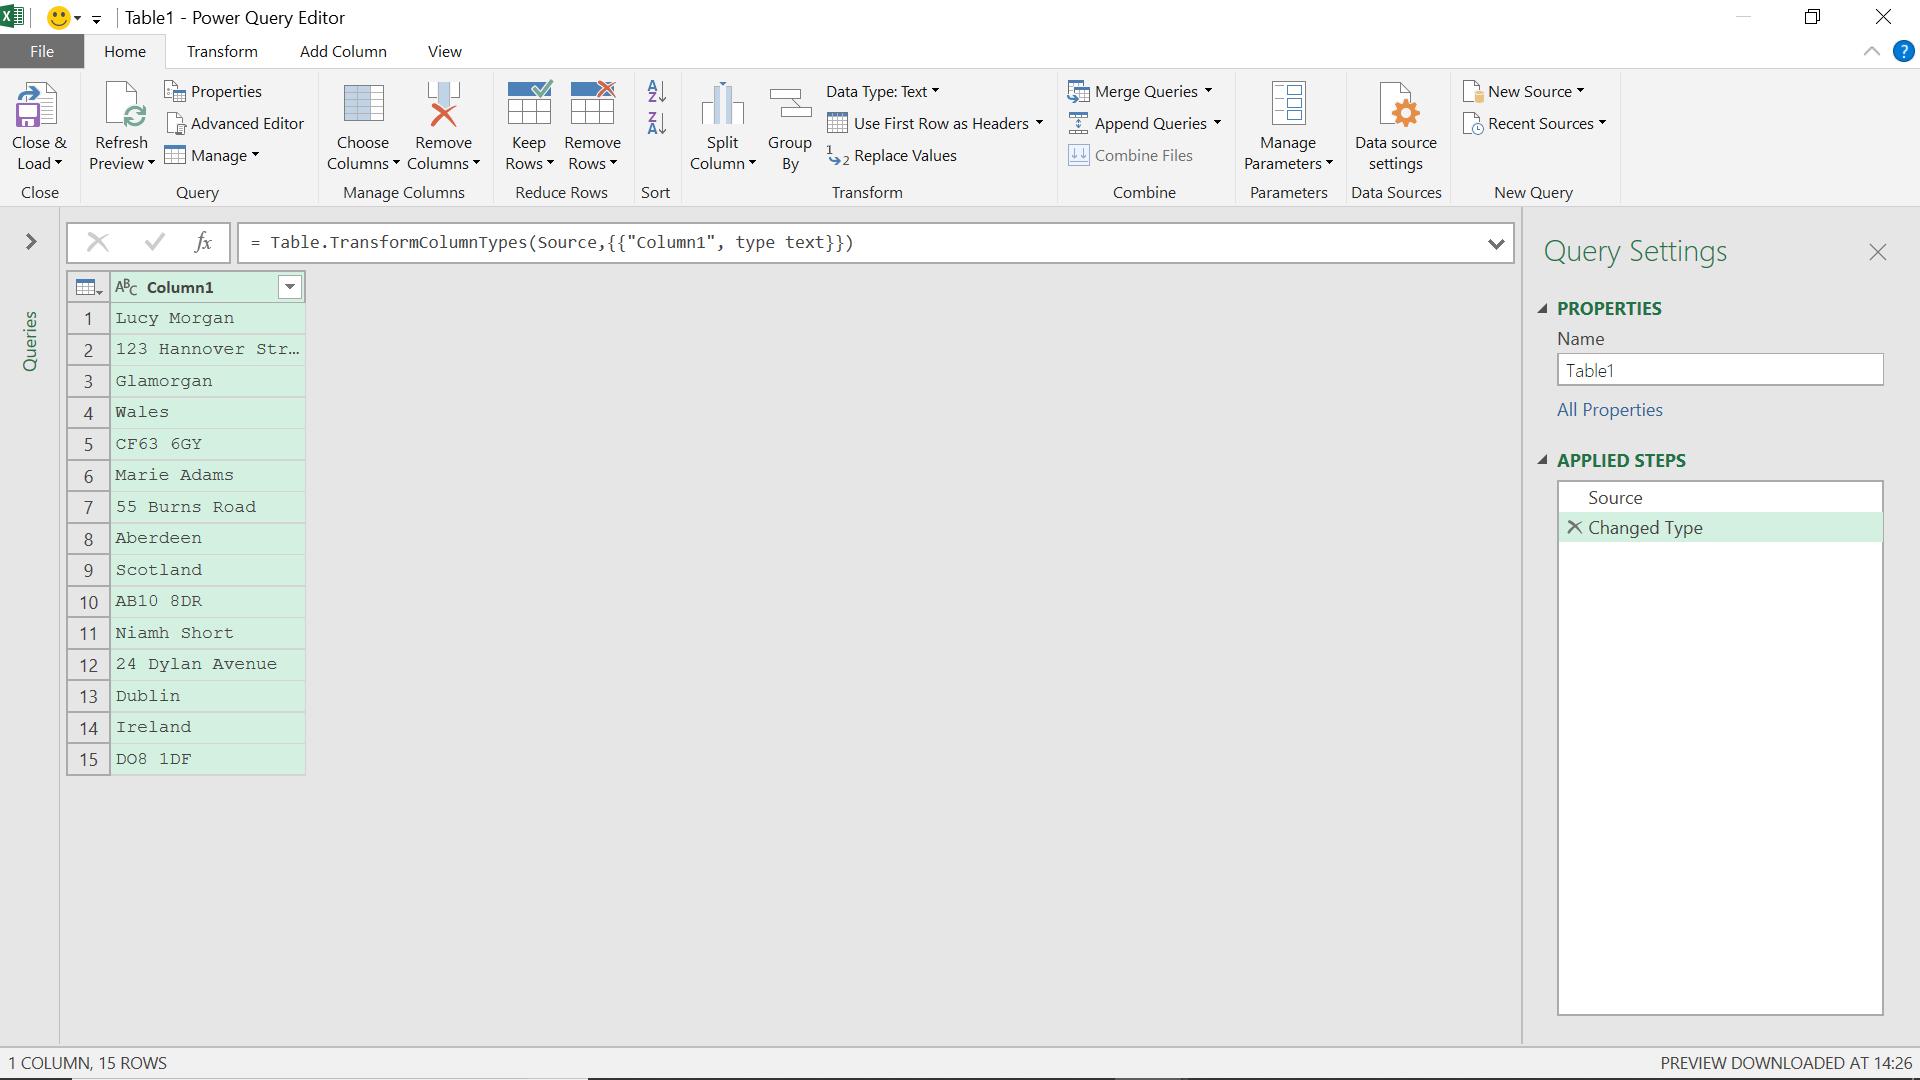
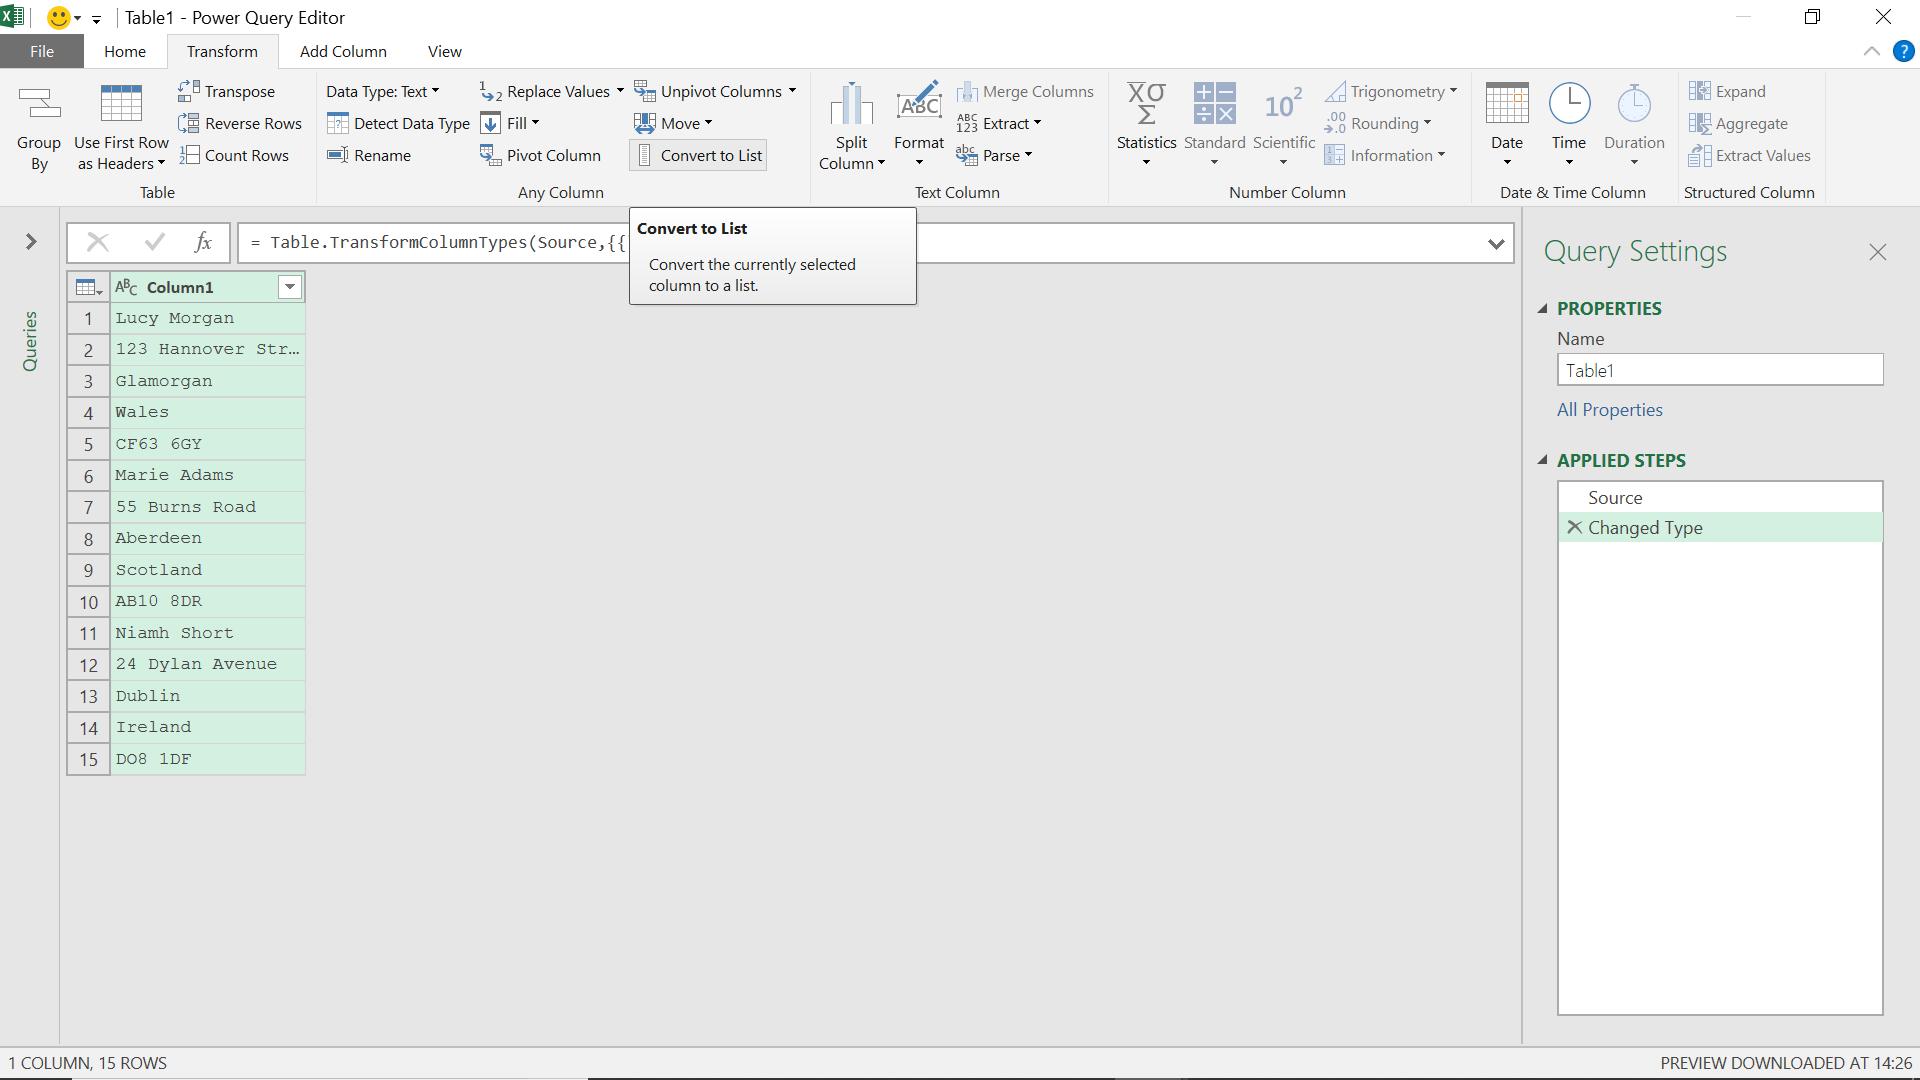
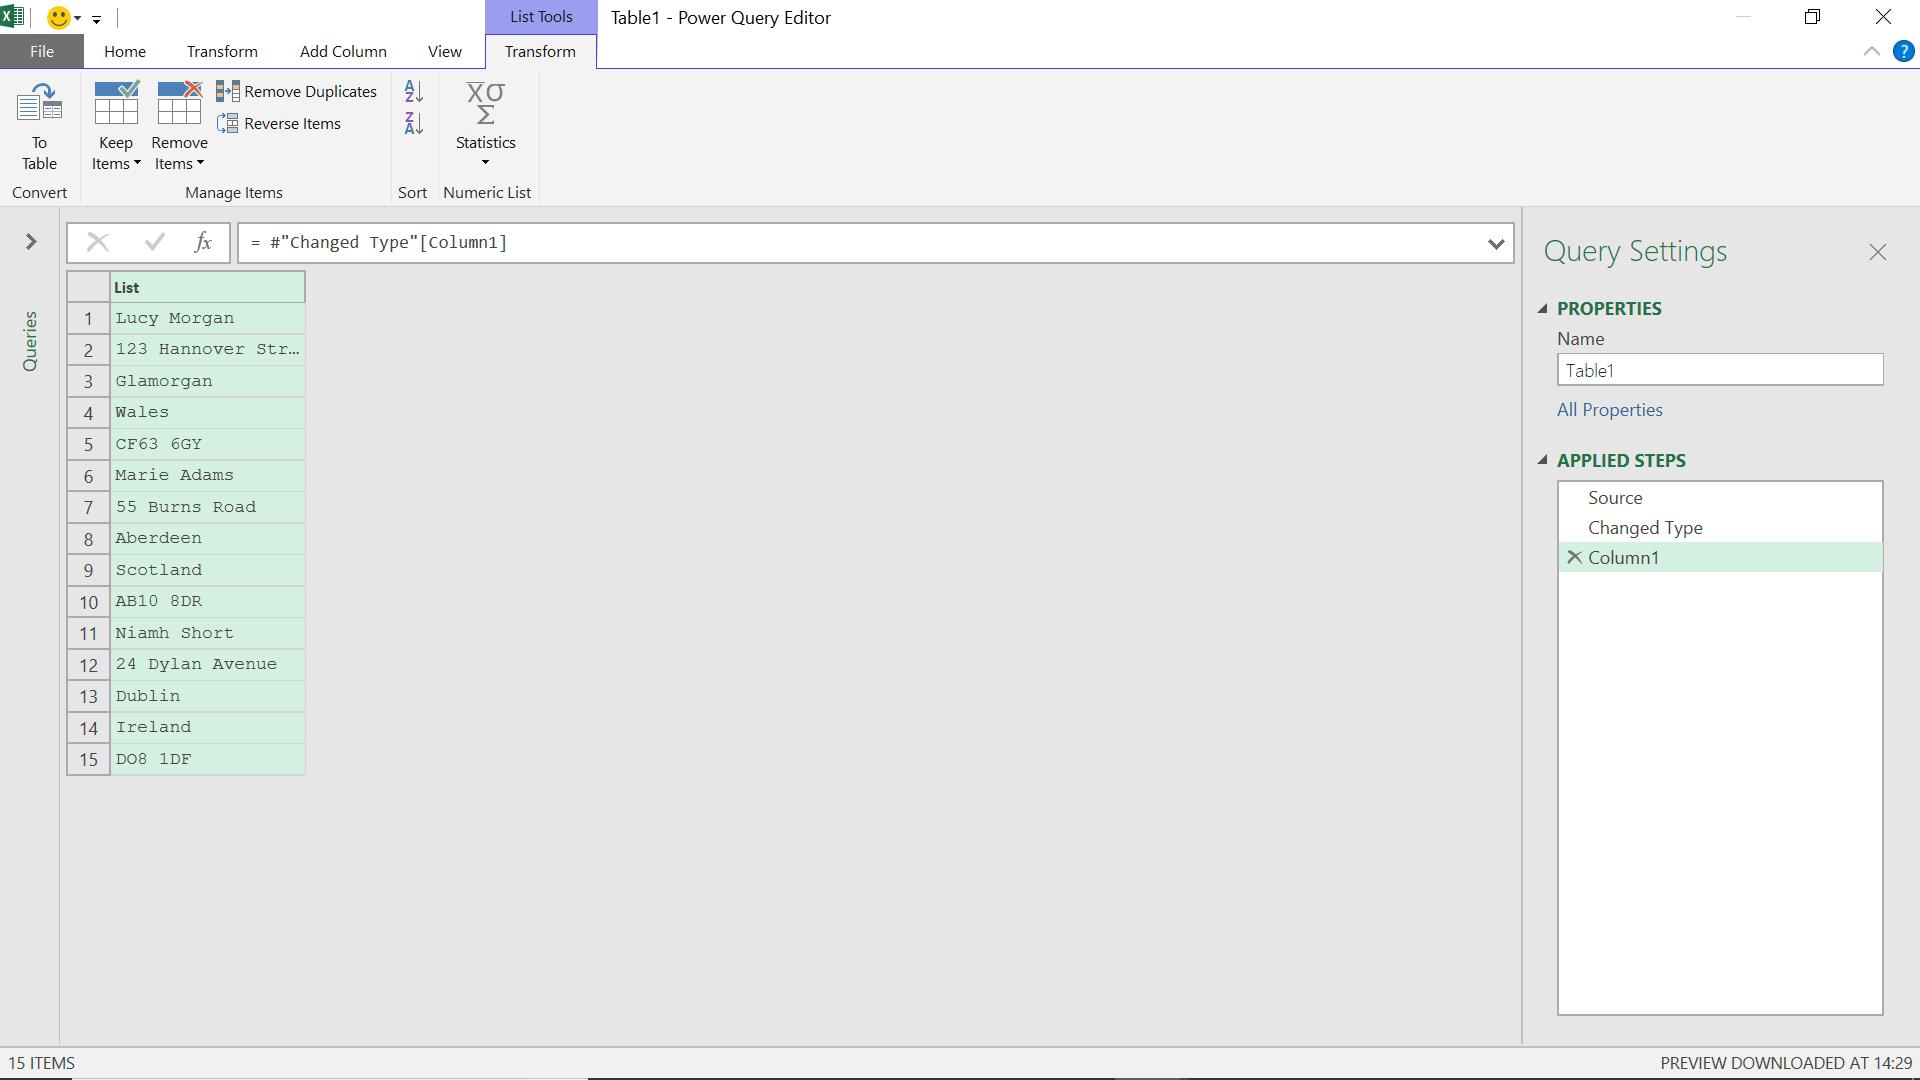
Anyway, I have my data all in one column. Now I transform my column into a list by using the ‘Convert to List’ option on the ‘Transform’ tab.
This gives me the same data in a list:
Since my contact data is consistently comprised of five rows, I can split my list into groups of five. I’d like to see List.Split() as a GUI option on the ‘List Tools’ tab, but since it isn’t (yet!), I will need to create some M code. The function
List.Split(list as list, pagesize as number) as list
splits list into a list of lists, where the first element of the output list is a list containing the first pagesize elements from the source list, the next element of the output list is a list containing the next pagesize elements from the source list, etc.
This function will give me a list of lists – where each ‘sub’ list contains all the data for one contact.
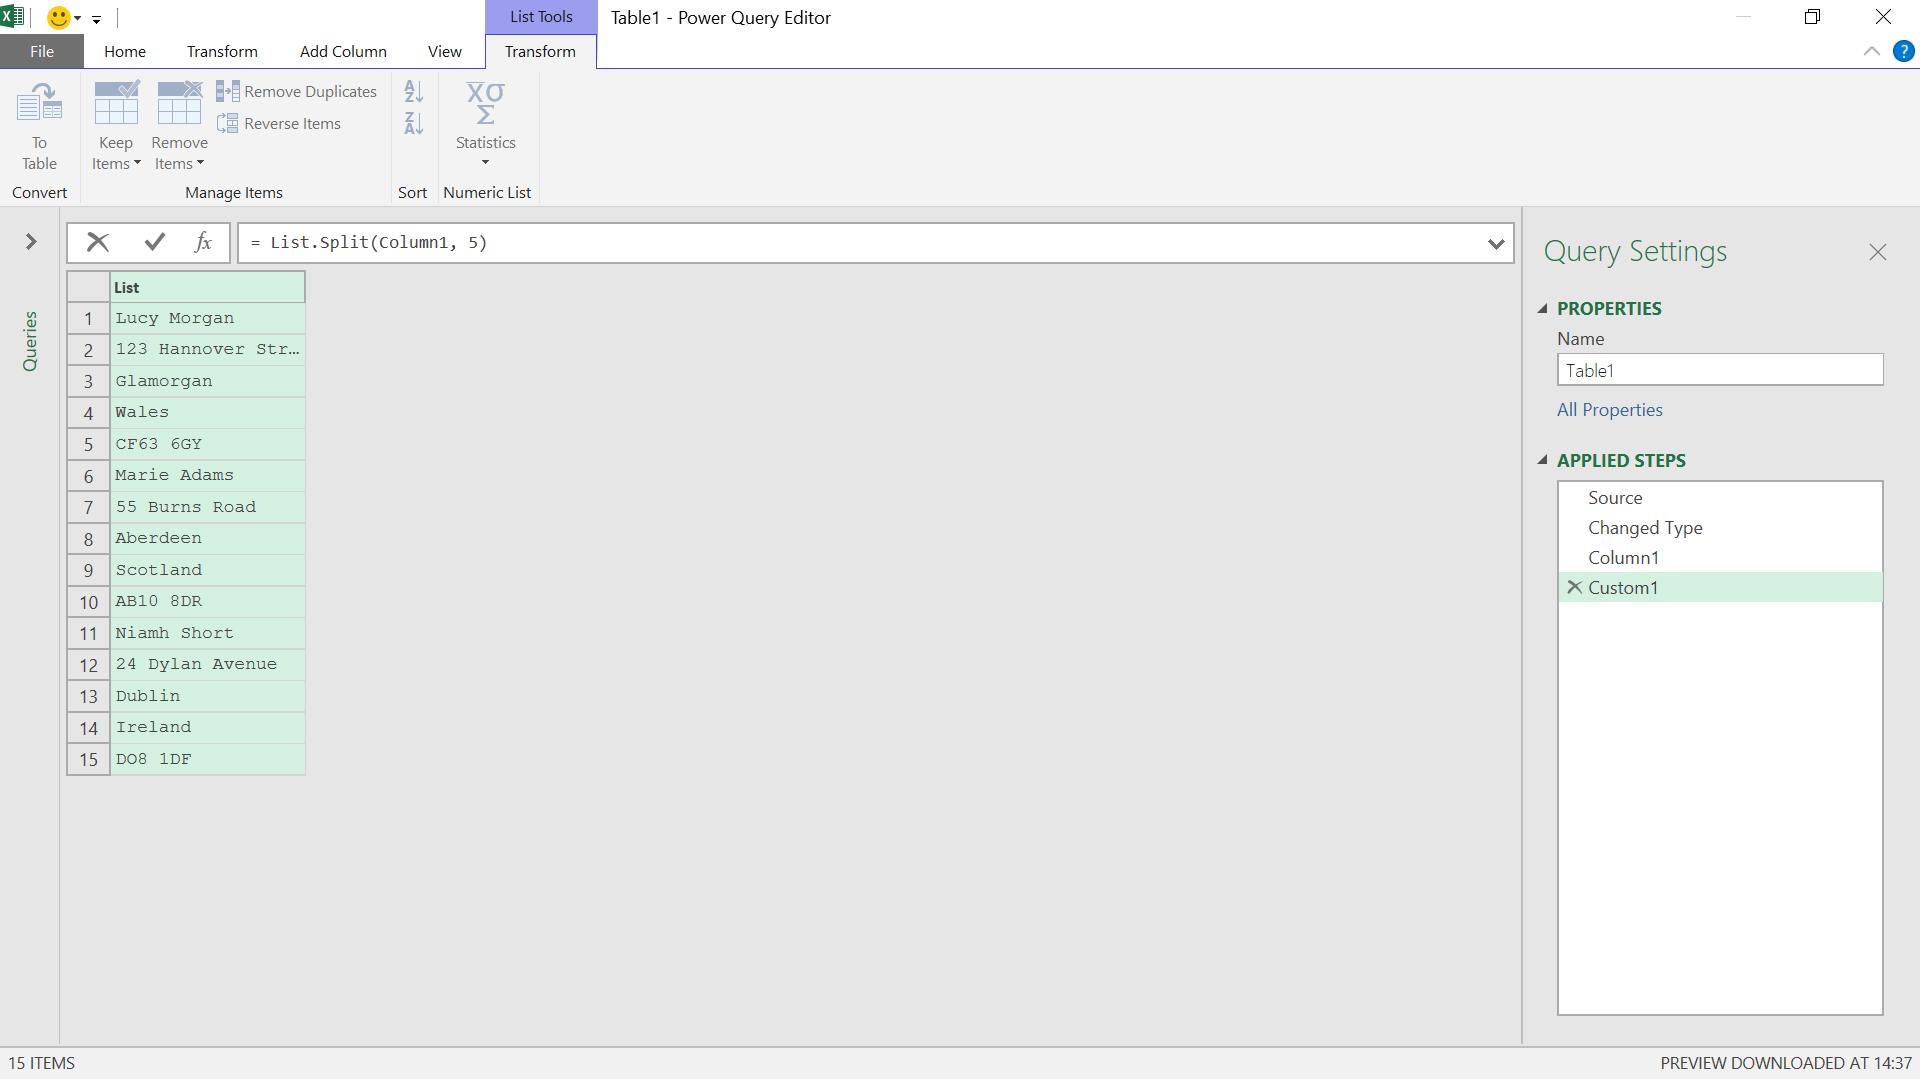
The M code I have entered above is:
= List.Split(Column1, 5)
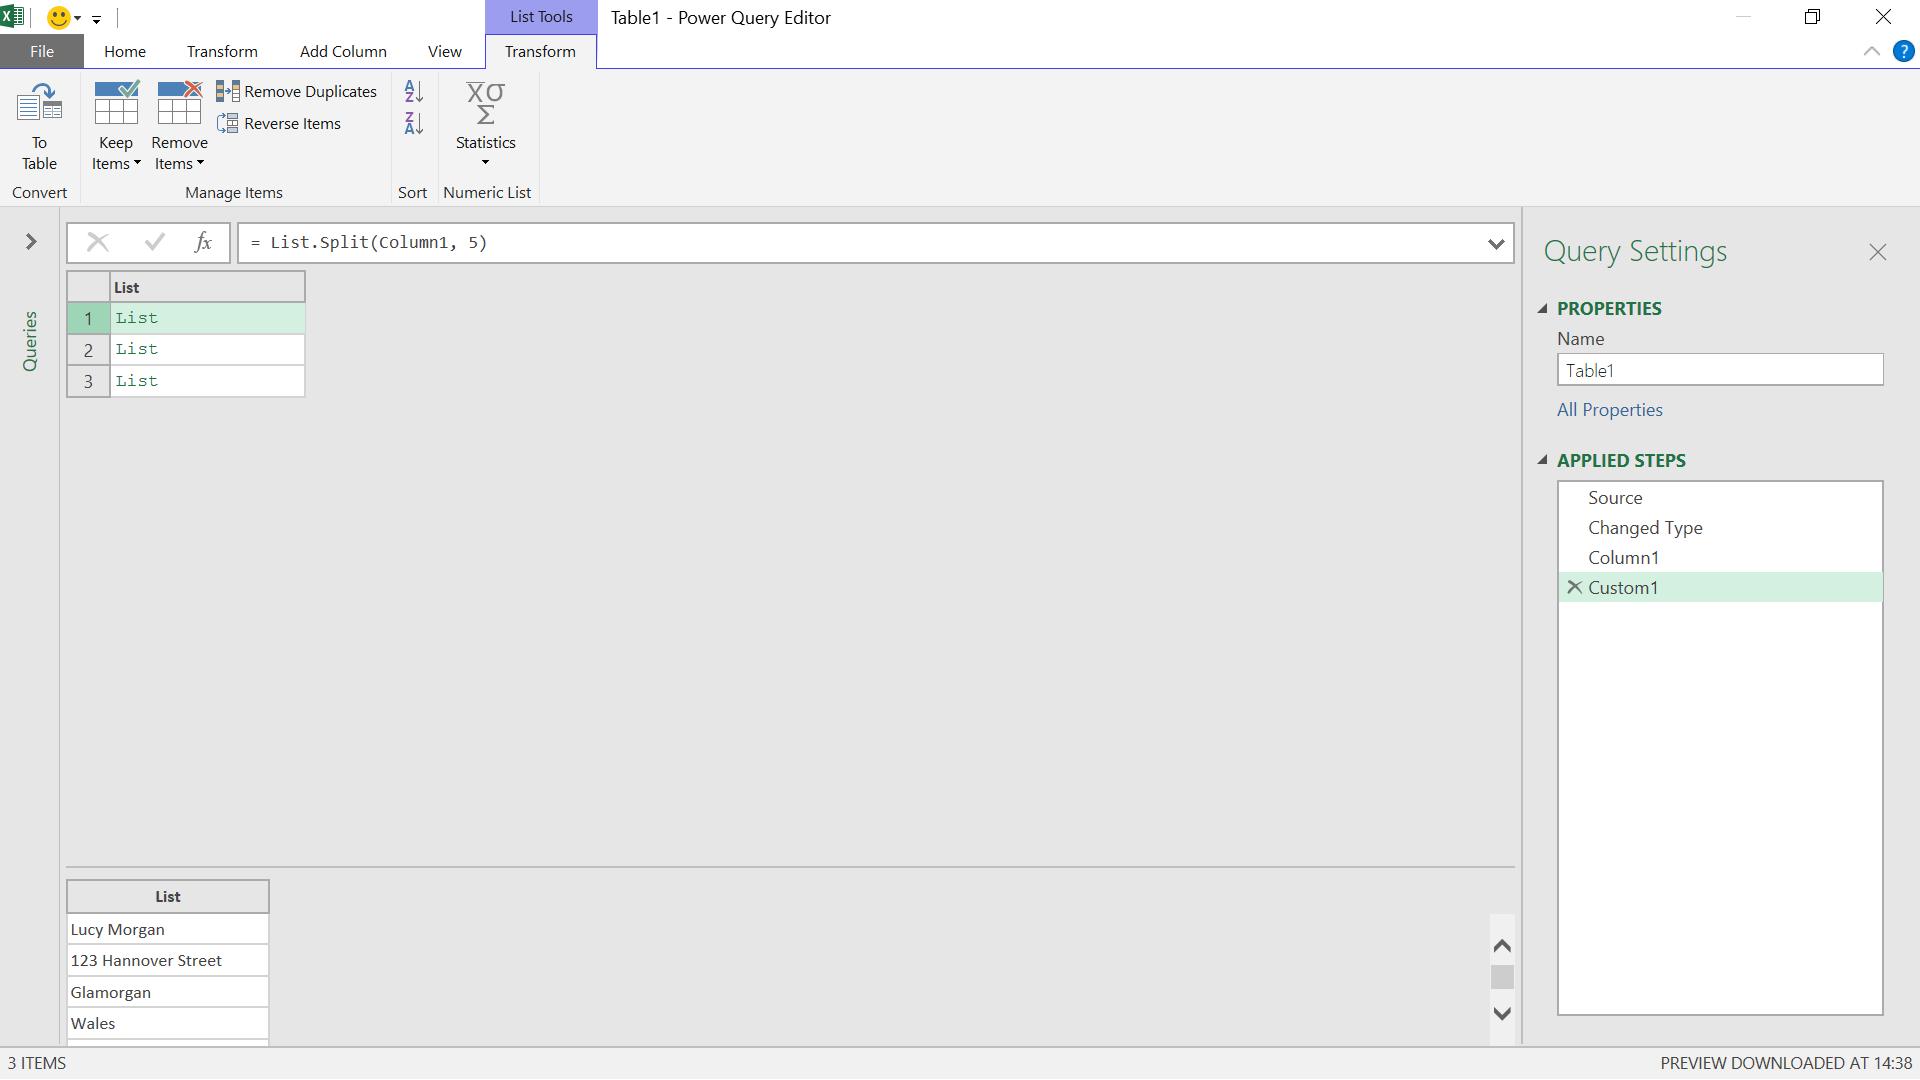
I can see that each of my lists contains the contact data. My next step is to extract each of my lists into a table. Since each list is a row, I can use Table.FromRows():
Table.FromRows(rows as list, optional columns as any) as table
This creates a table from the list rows where each element of the list is an inner list that contains the column values for a single row. An optional list of column names, a table type, or a number of columns could be provided for the argument columns.
This function will allow me to create a table for each of my contact lists. I also like the facility to create column names, so I’ll do this too.
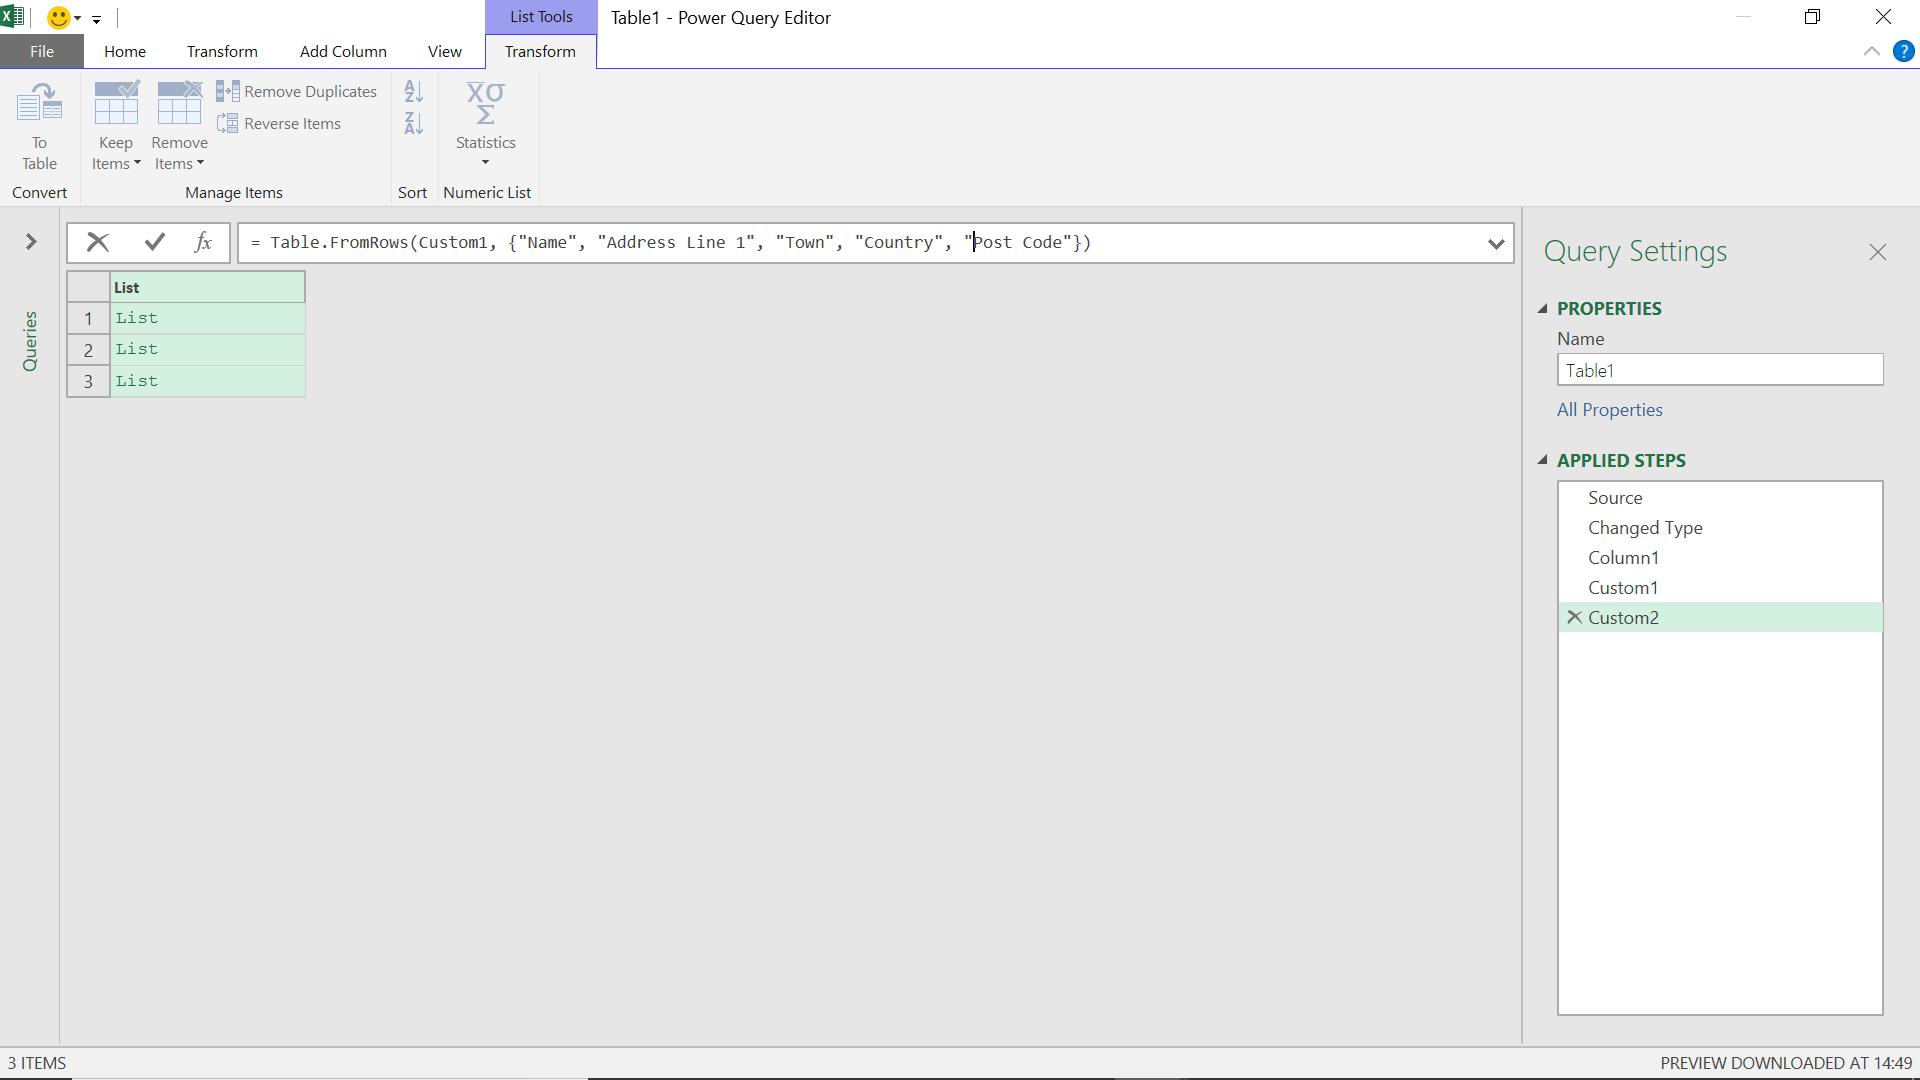
The M code I have used is:
= Table.FromRows(Custom1, {"Name", "Address Line 1", "Town", "Country", “Post Code"})
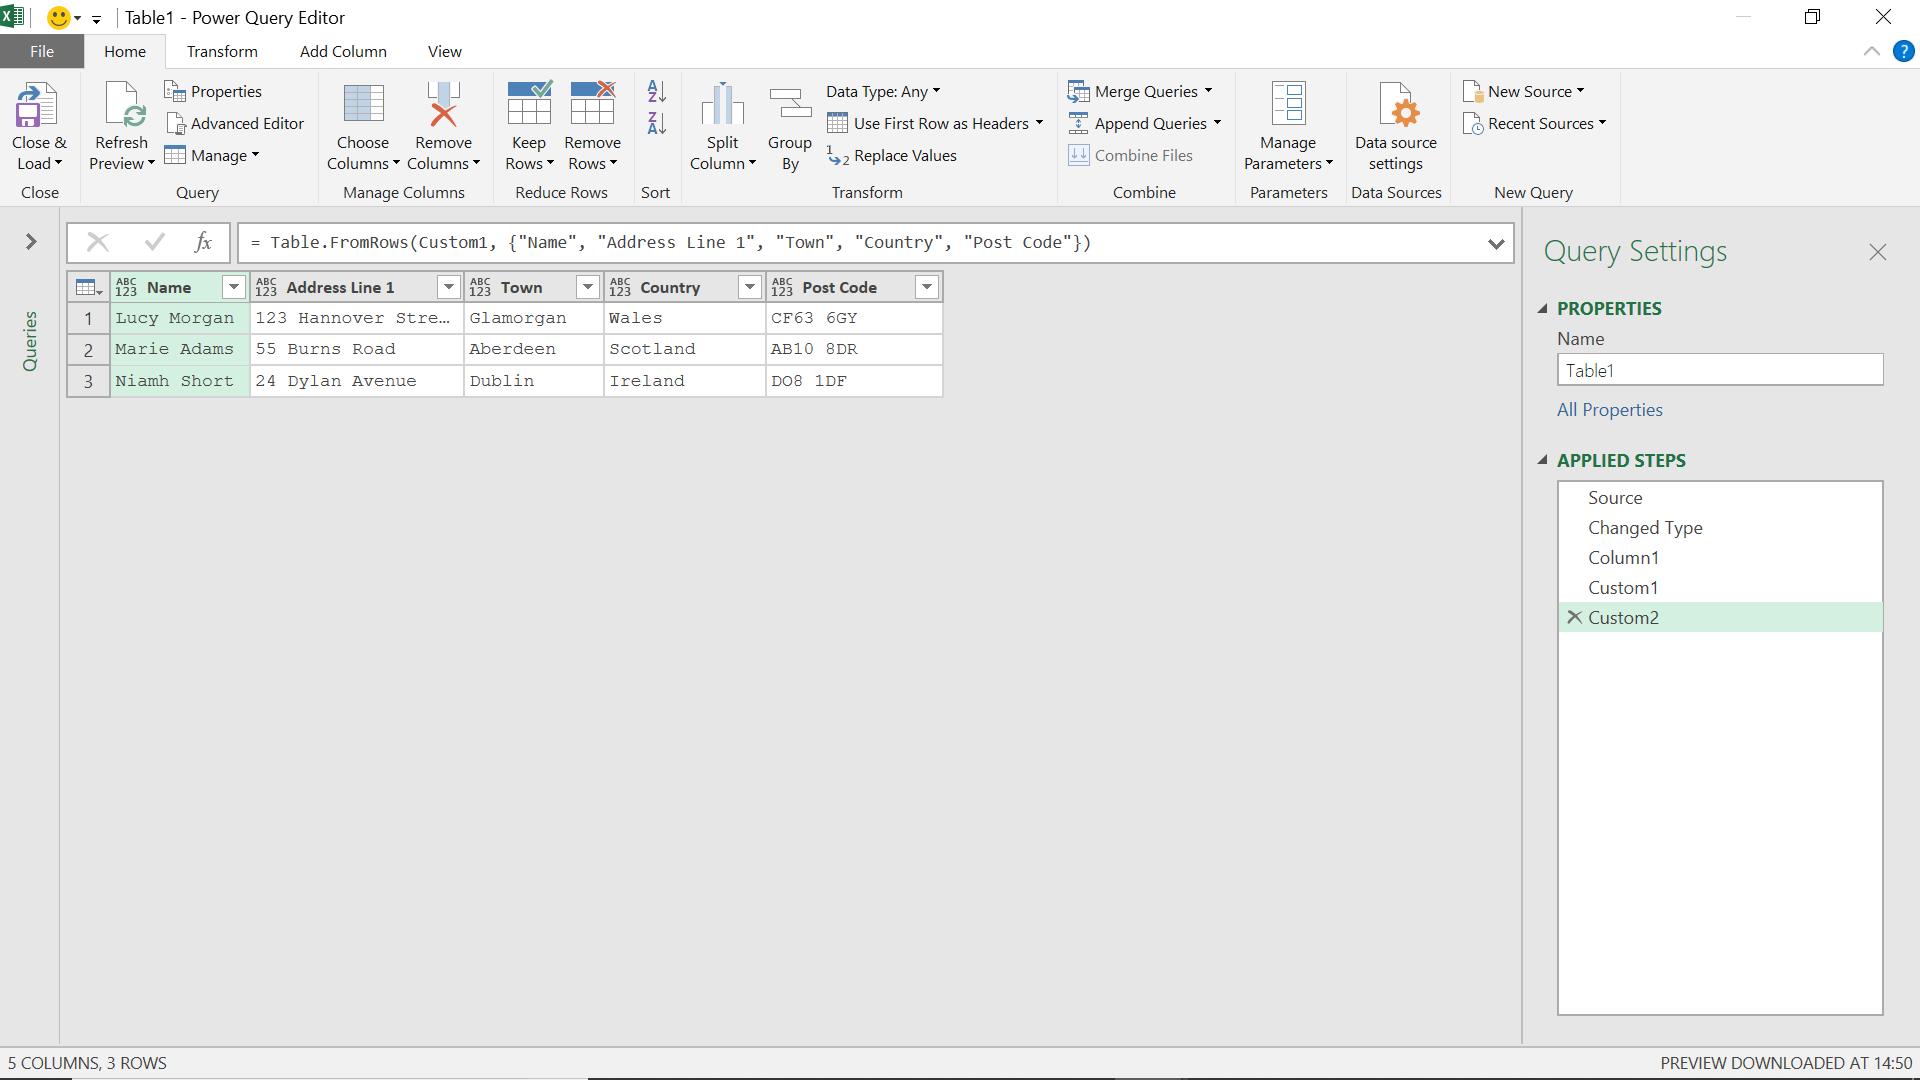
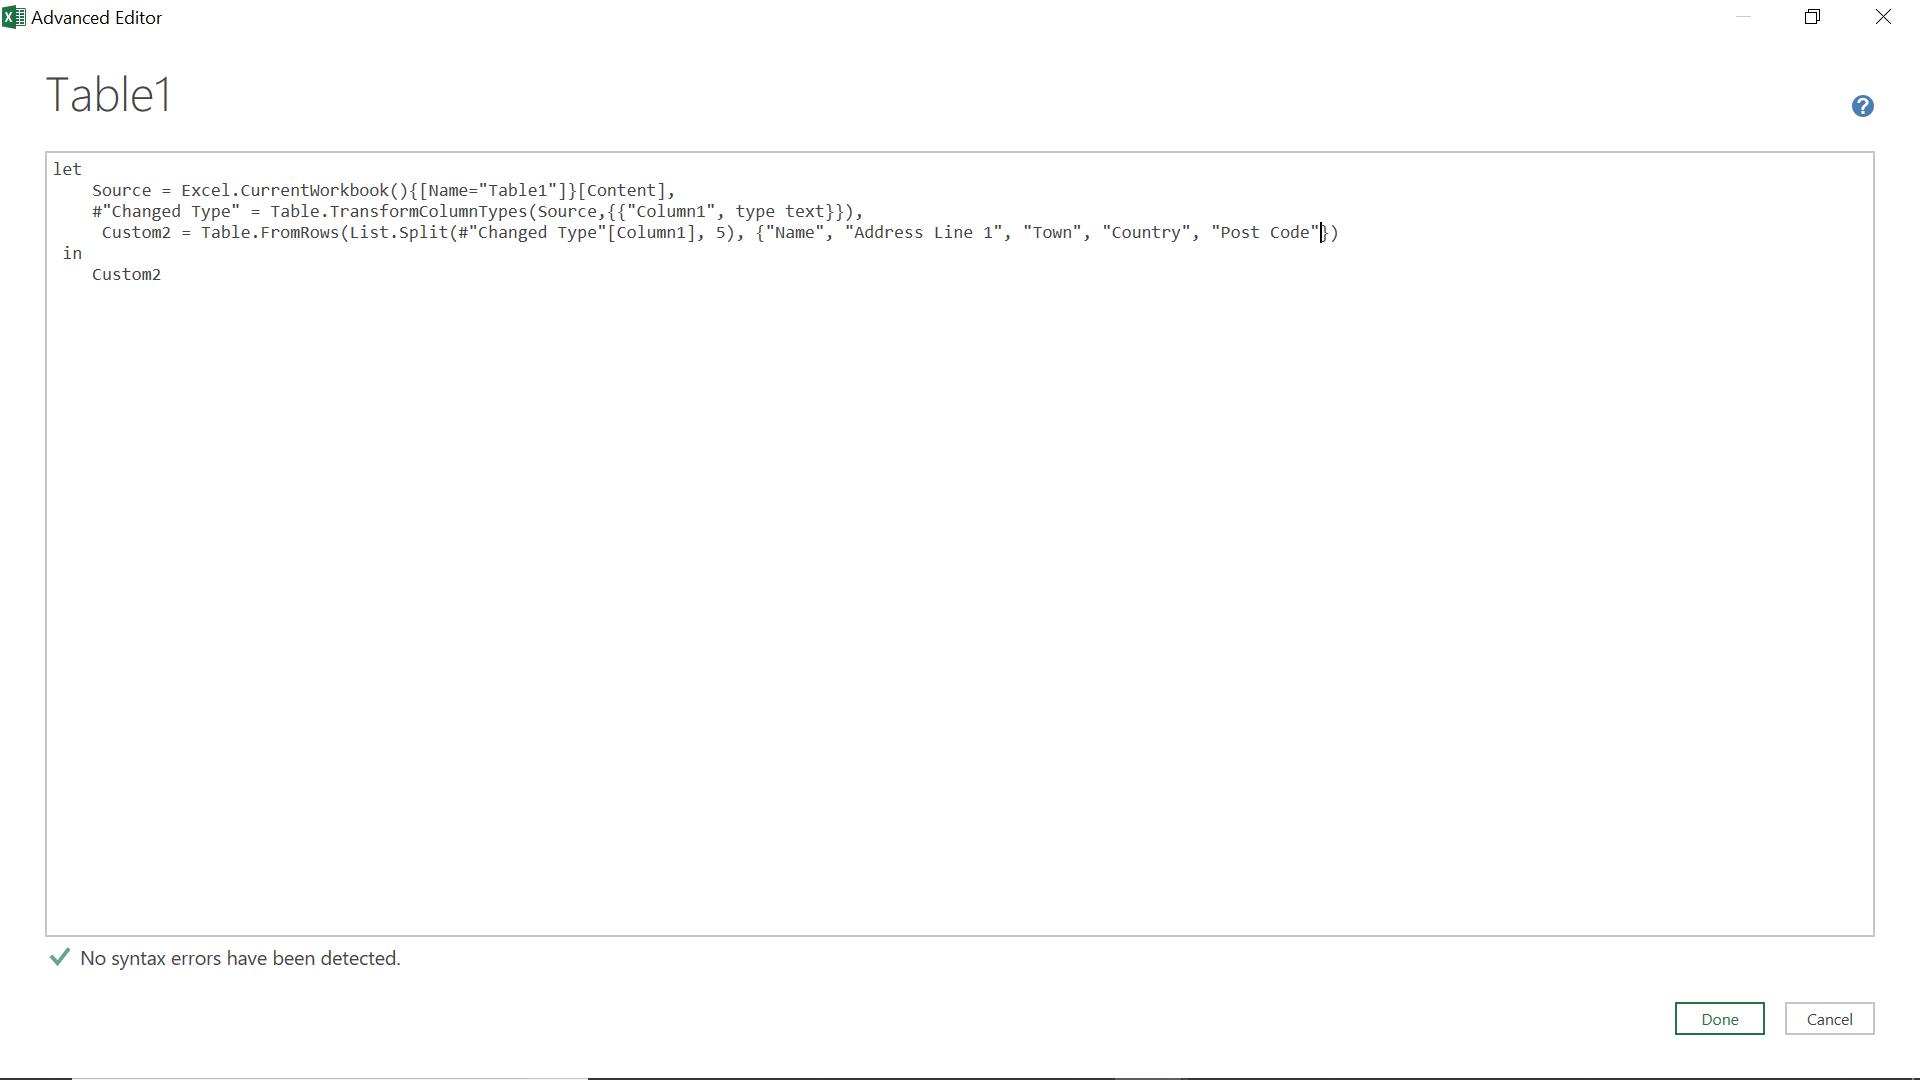
I now have my contact data in a useful form in just a few steps. I can see the code created in the ‘Advanced Editor’, viz.
let
Source = Excel.CurrentWorkbook(){[Name="Table1"]}[Content],
#"Changed Type" = Table.TransformColumnTypes(Source,{{"Column1", type text}}),
Column1 = #"Changed Type"[Column1],
Custom1 = List.Split(Column1, 5),
Custom2 = Table.FromRows(Custom1, {"Name", "Address Line 1", "Town", "Country", "Post Code"})
in
Custom2
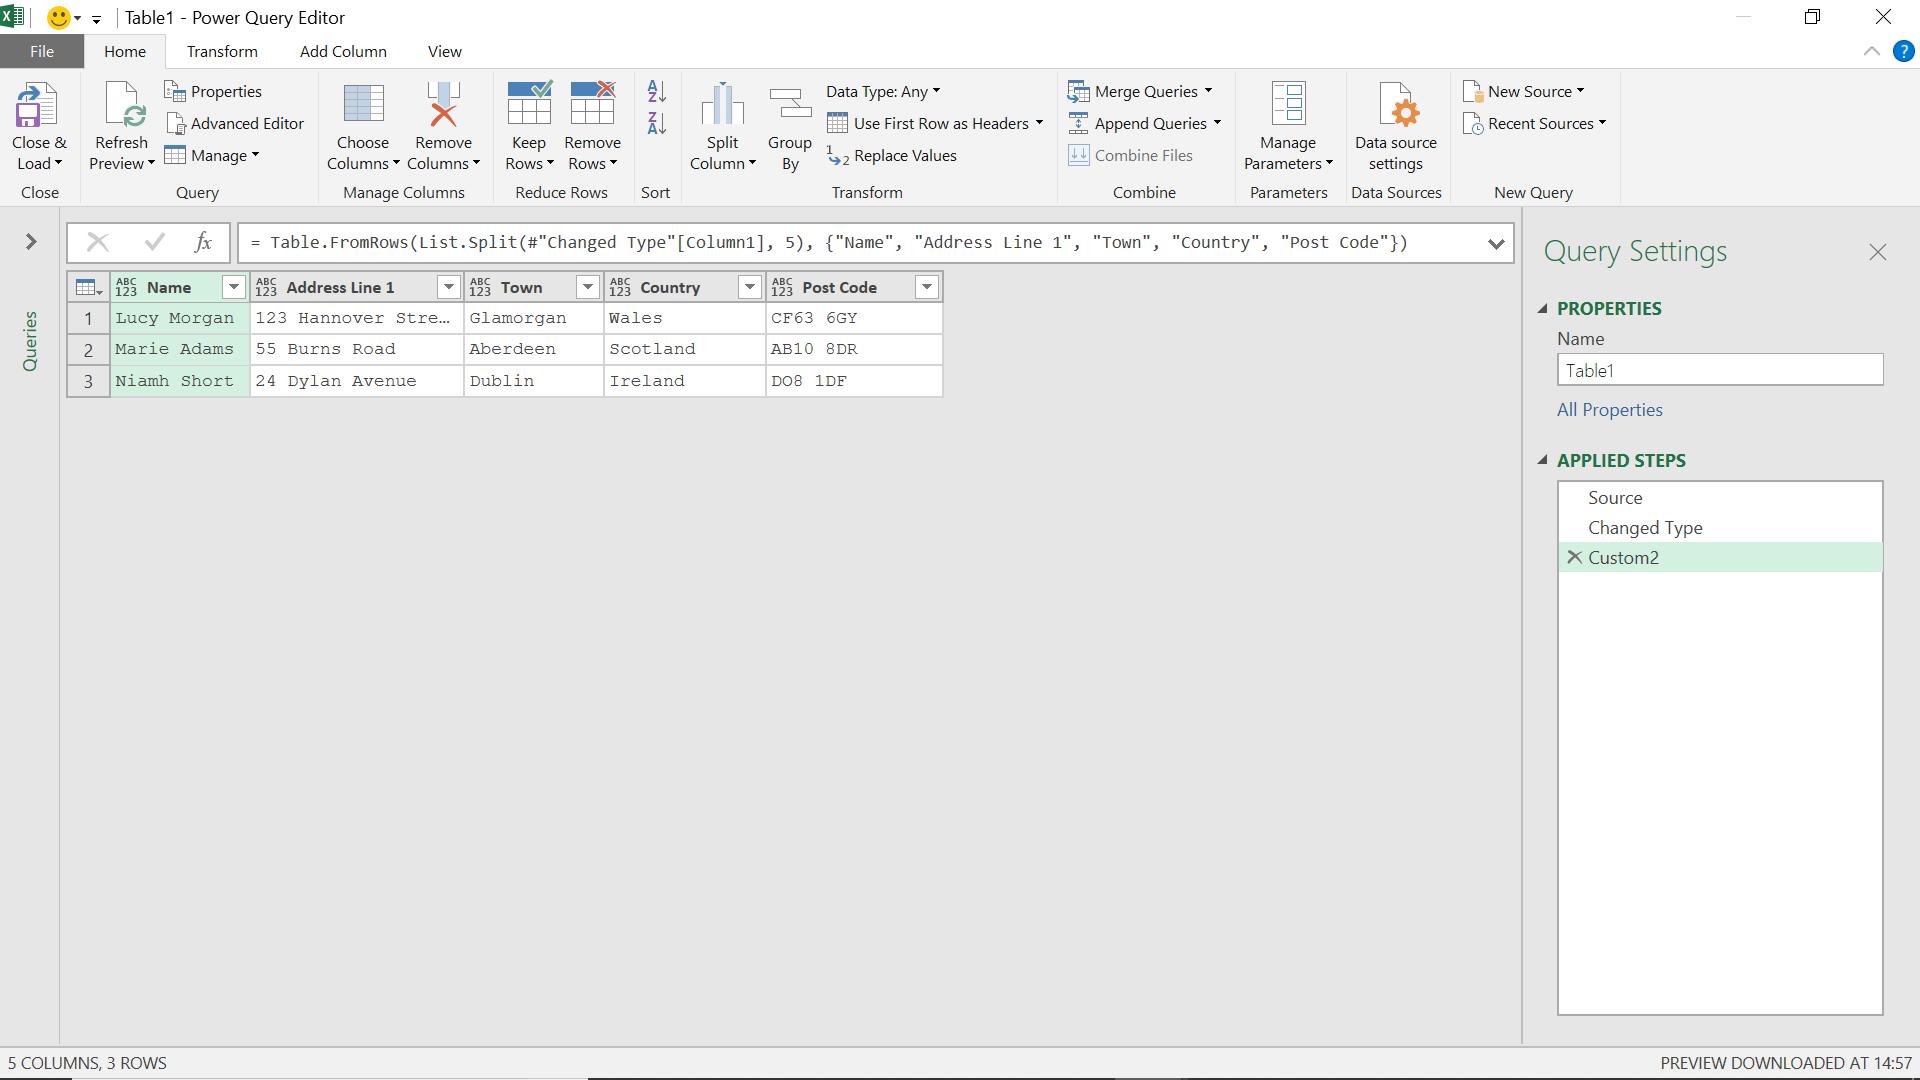
If I wish I can combine the steps I have added into one line of M code:
let
Source = Excel.CurrentWorkbook(){[Name="Table1"]}[Content],
#"Changed Type" = Table.TransformColumnTypes(Source,{{"Column1", type text}}),
Custom2 = Table.FromRows(List.Split(#"Changed Type"[Column1], 5), {"Name", "Address Line 1", "Town", "Country", "Post Code"})
in
Custom2
(The code differs from the third line of the main body of code onwards.)
This achieves the same goal in fewer steps:
Come back next time for more ways to use Power Query!