
Power Query: Absolutely Fabulous
1 May 2019
Welcome to our Power Query blog. Today, I am going to look at how Power Query turns a tricky transformation into a simple task.
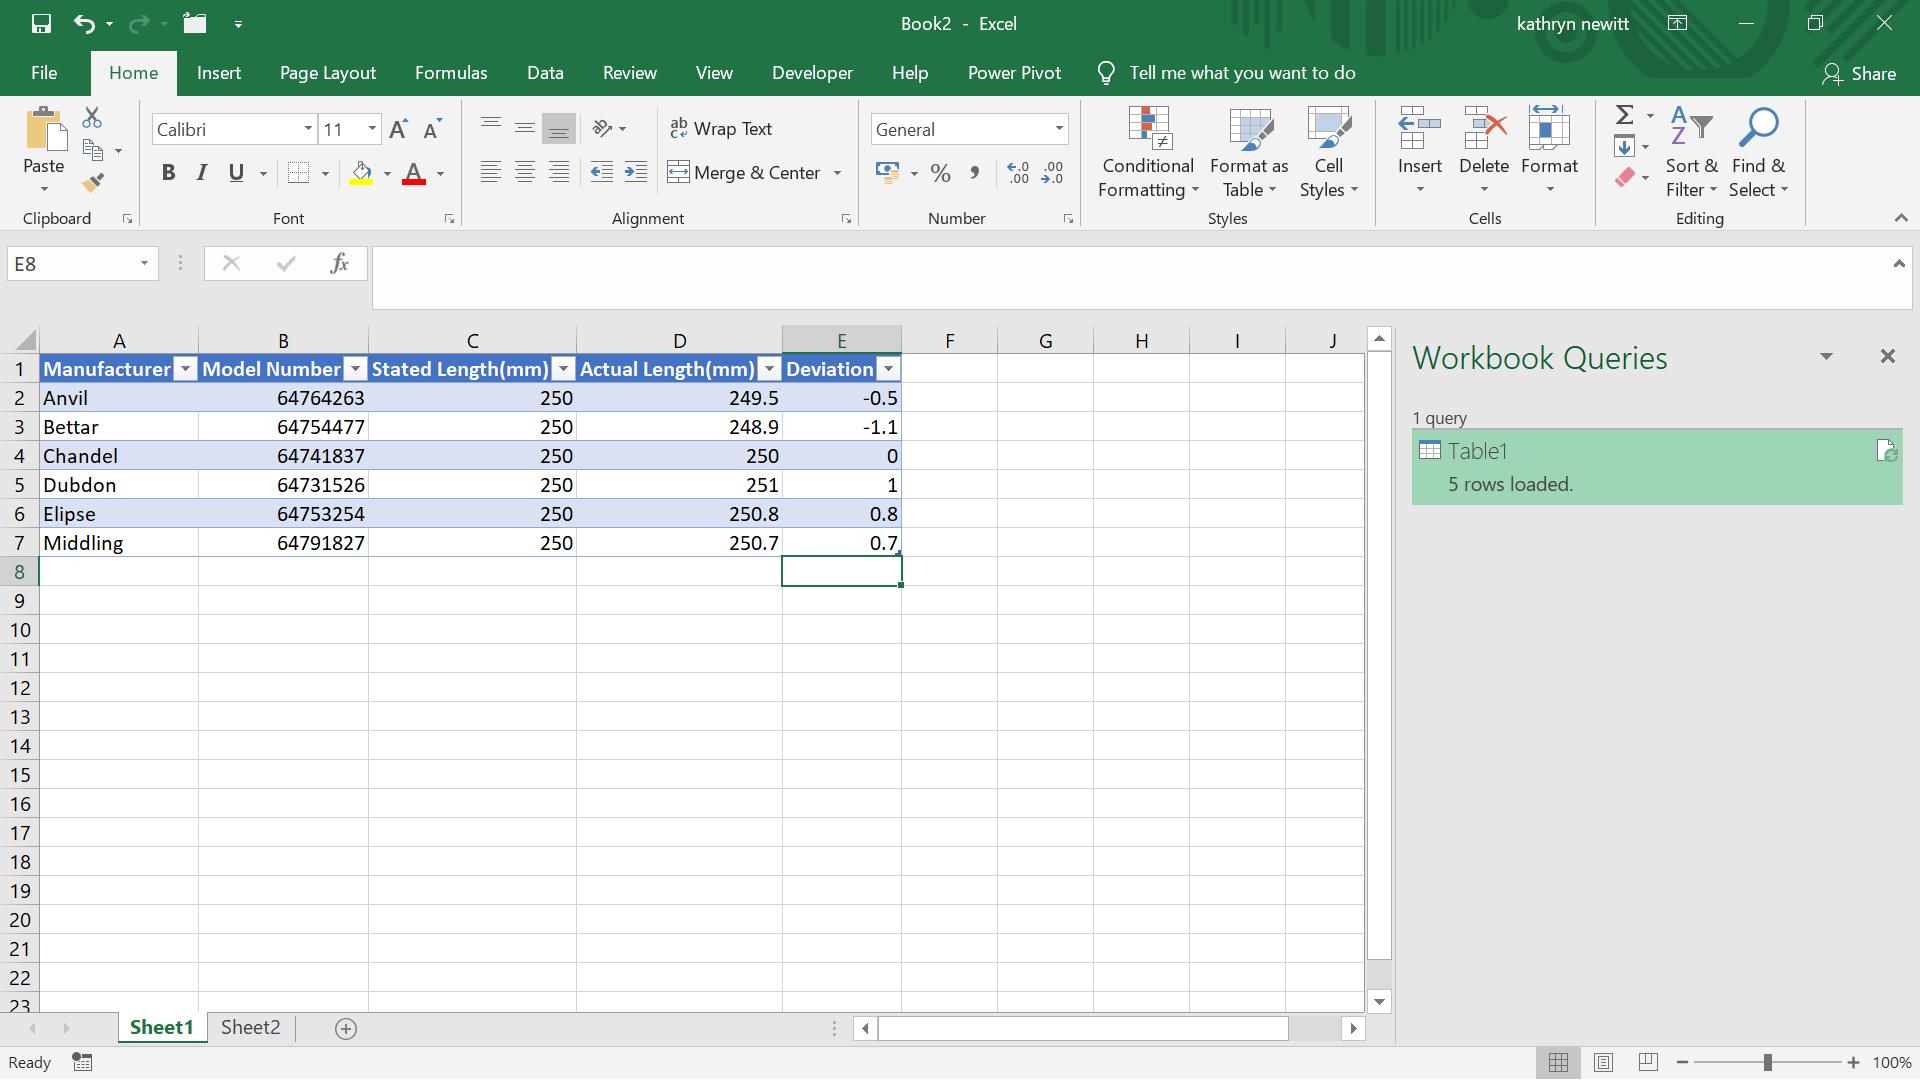
I have information on the size of some components. The deviation is shown as either negative or positive. I want to assign a rating to each model to show which is the most accurate. To do this, I want to remove the sign from deviation.
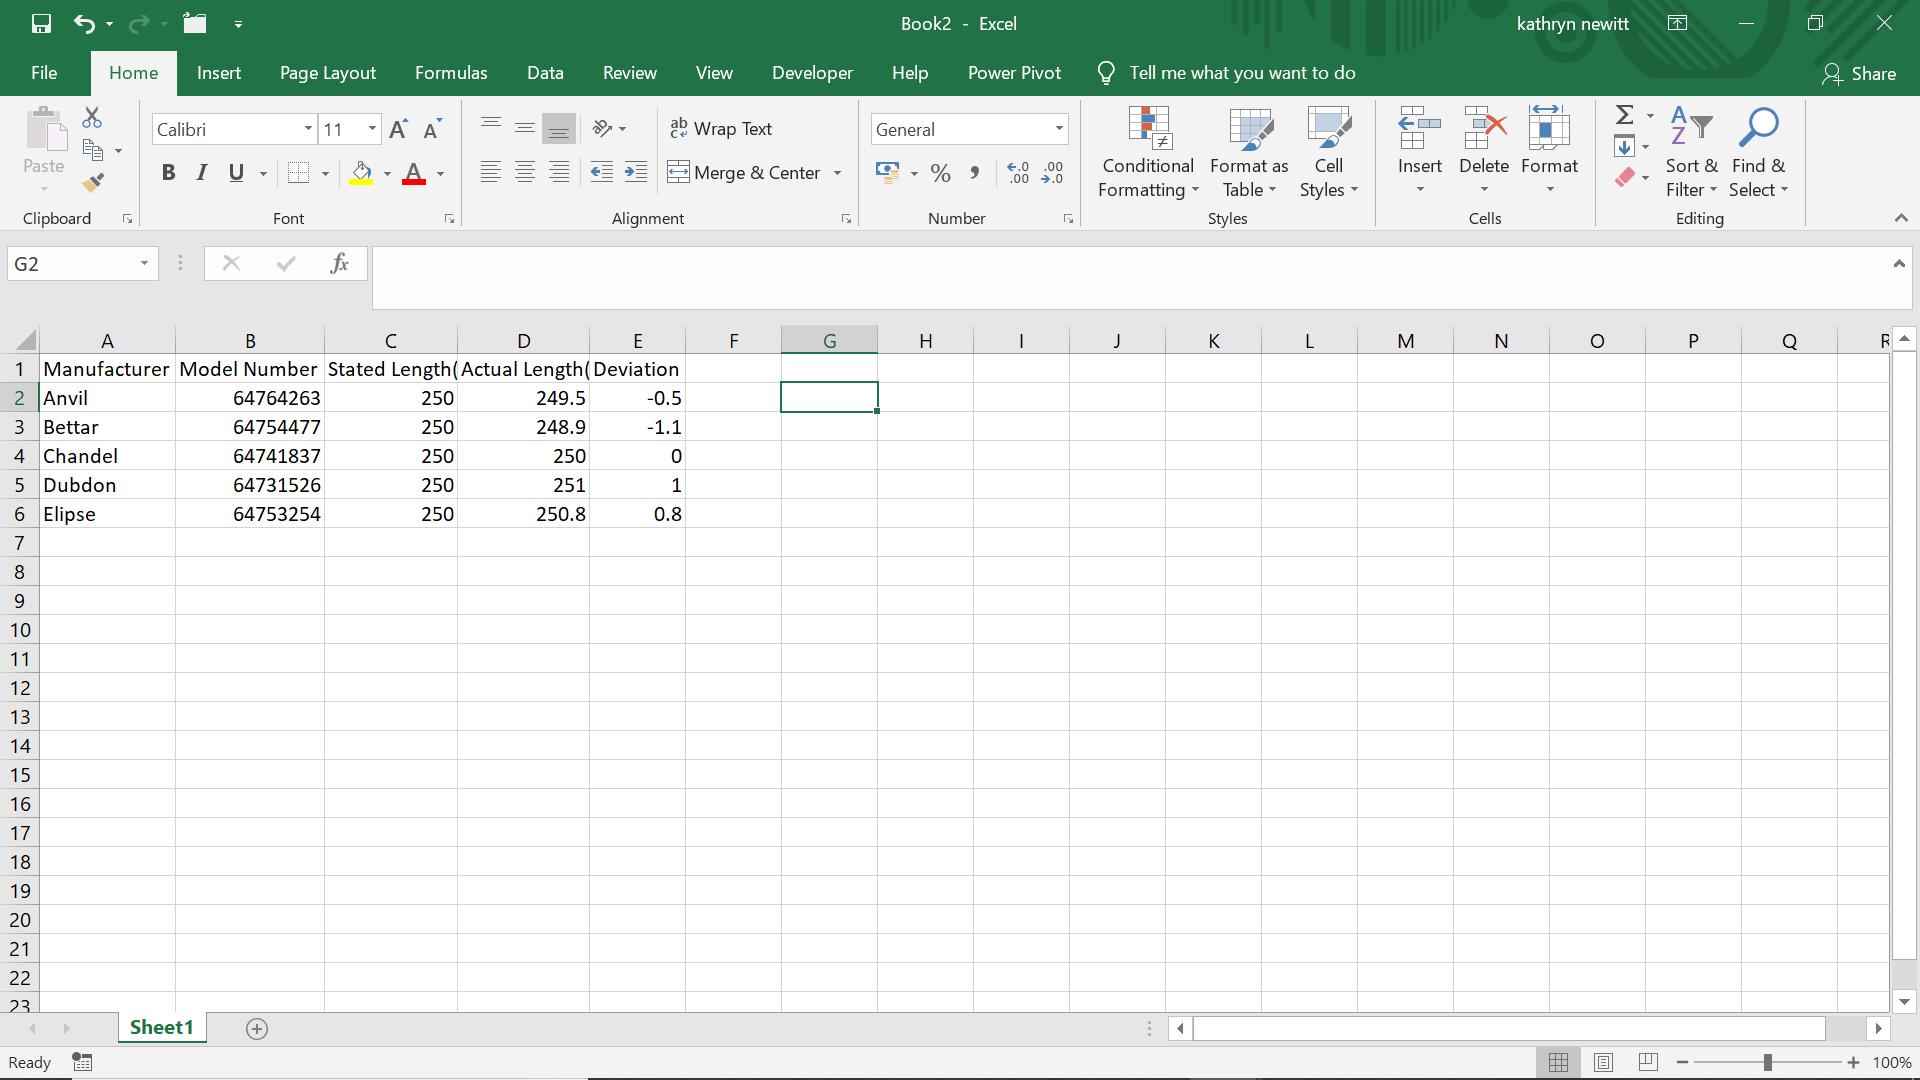
In Excel, I could change the cell formatting, but although that would mean the sign is not visible, the values would still have their original sign, which could affect future calculations. You could use the ABS function, but here, I am going to show you how to do it in Power Query.
I create a query ‘From Table’ in the ‘Get & Transform’ section of the ‘Data’ tab:
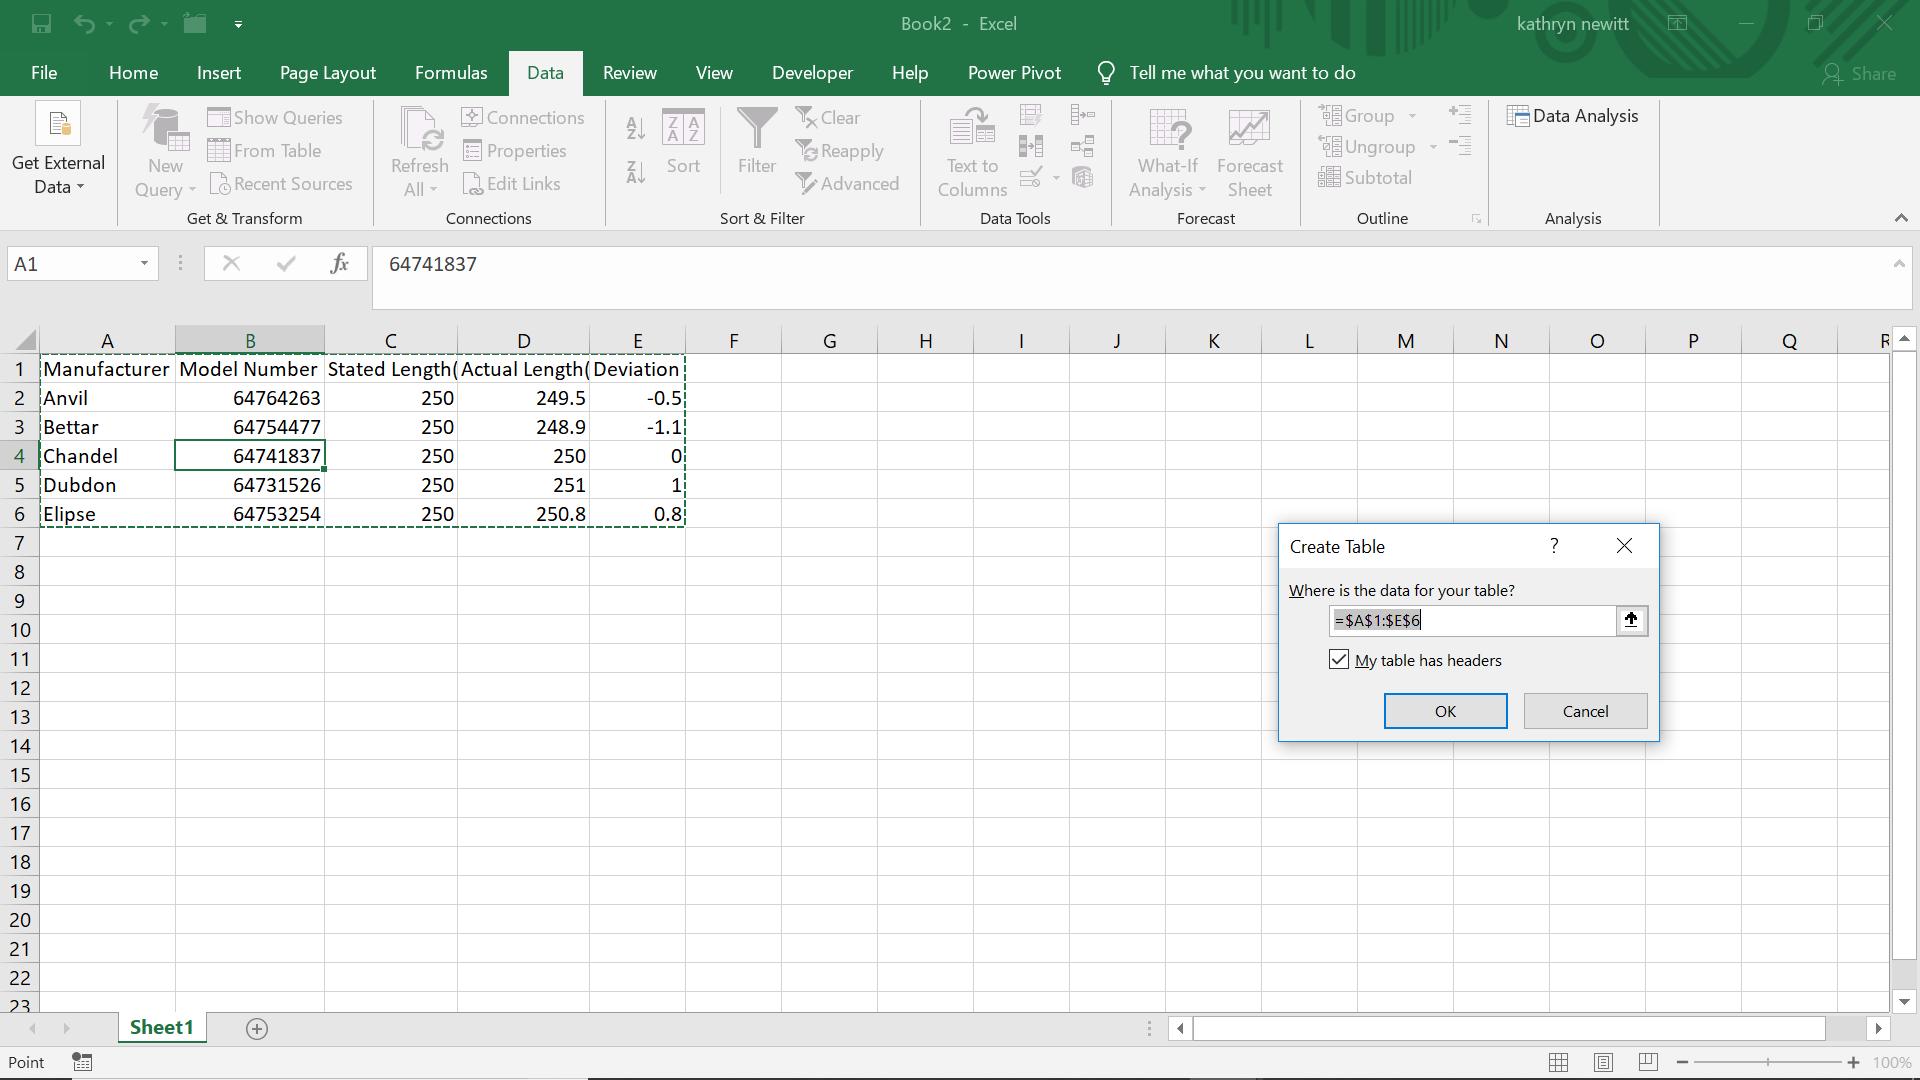
I take the defaults, as I have column headers I wish to use.
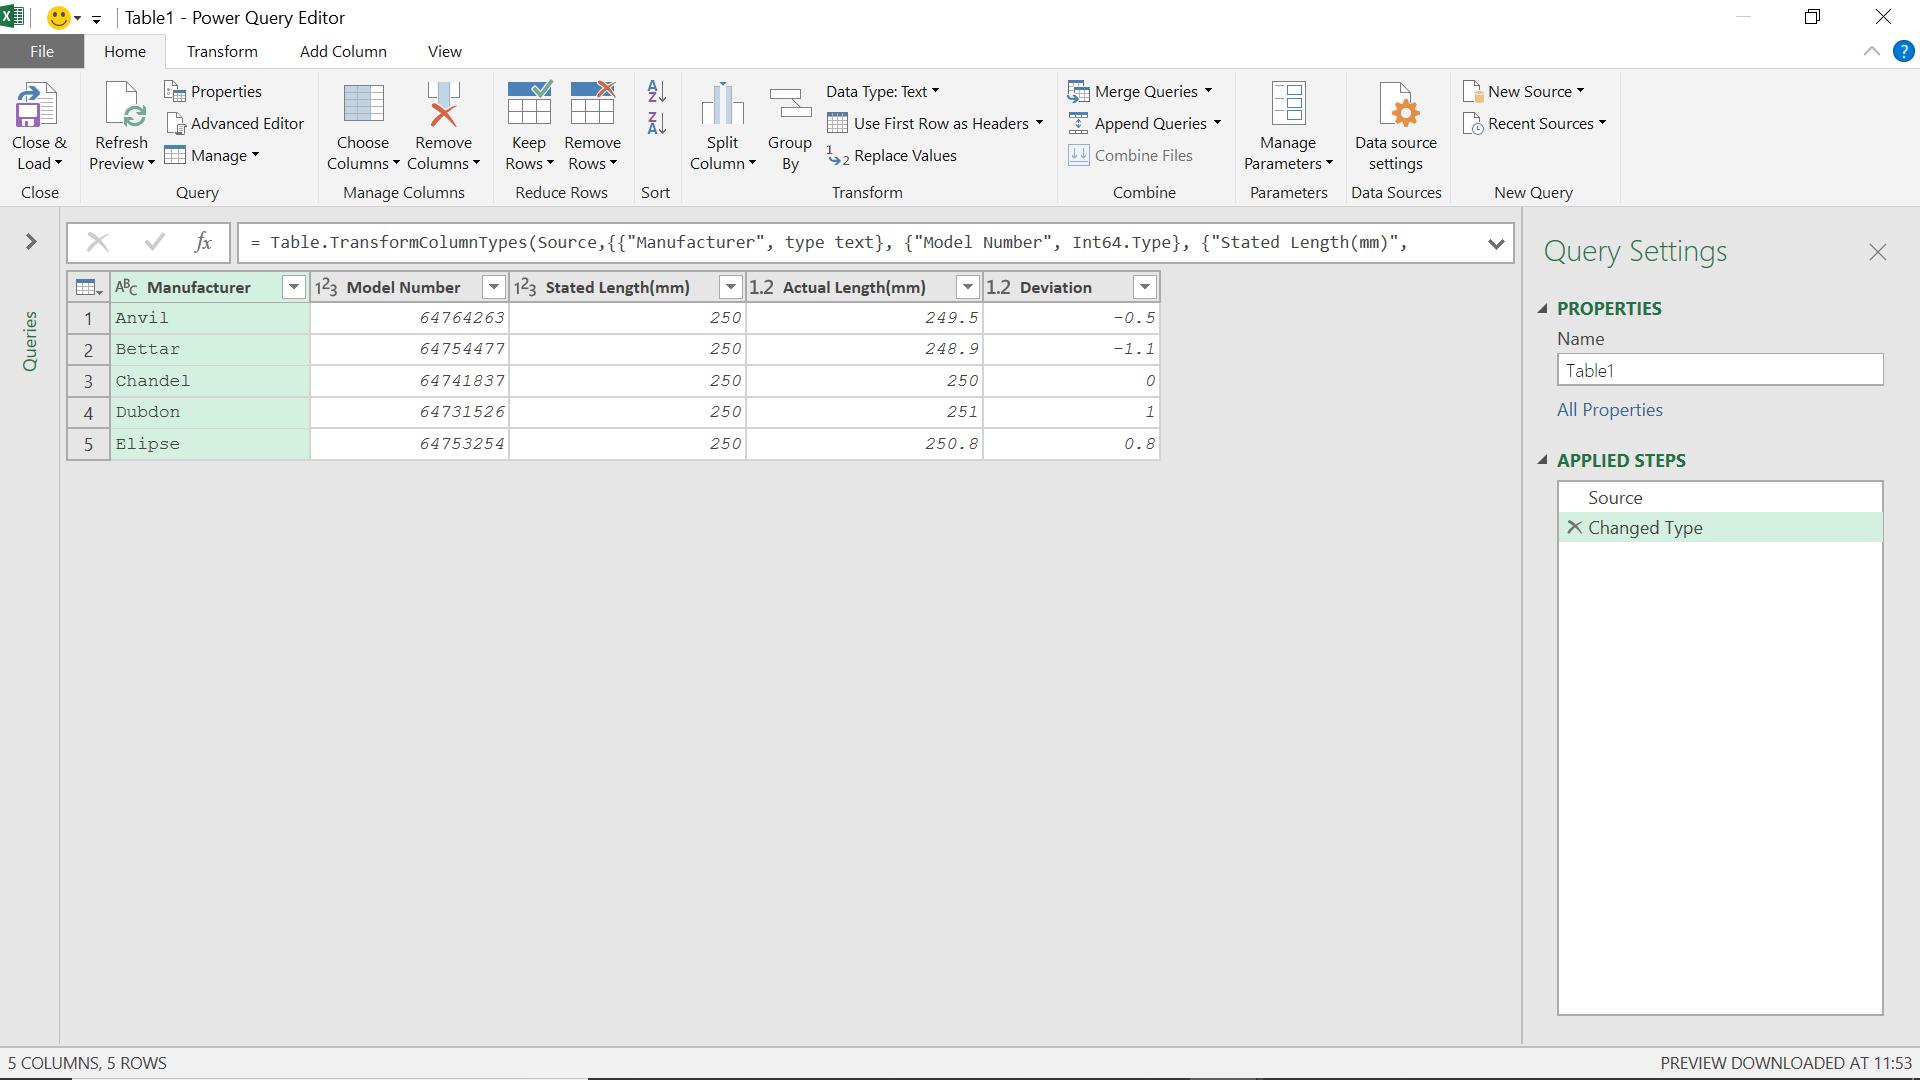
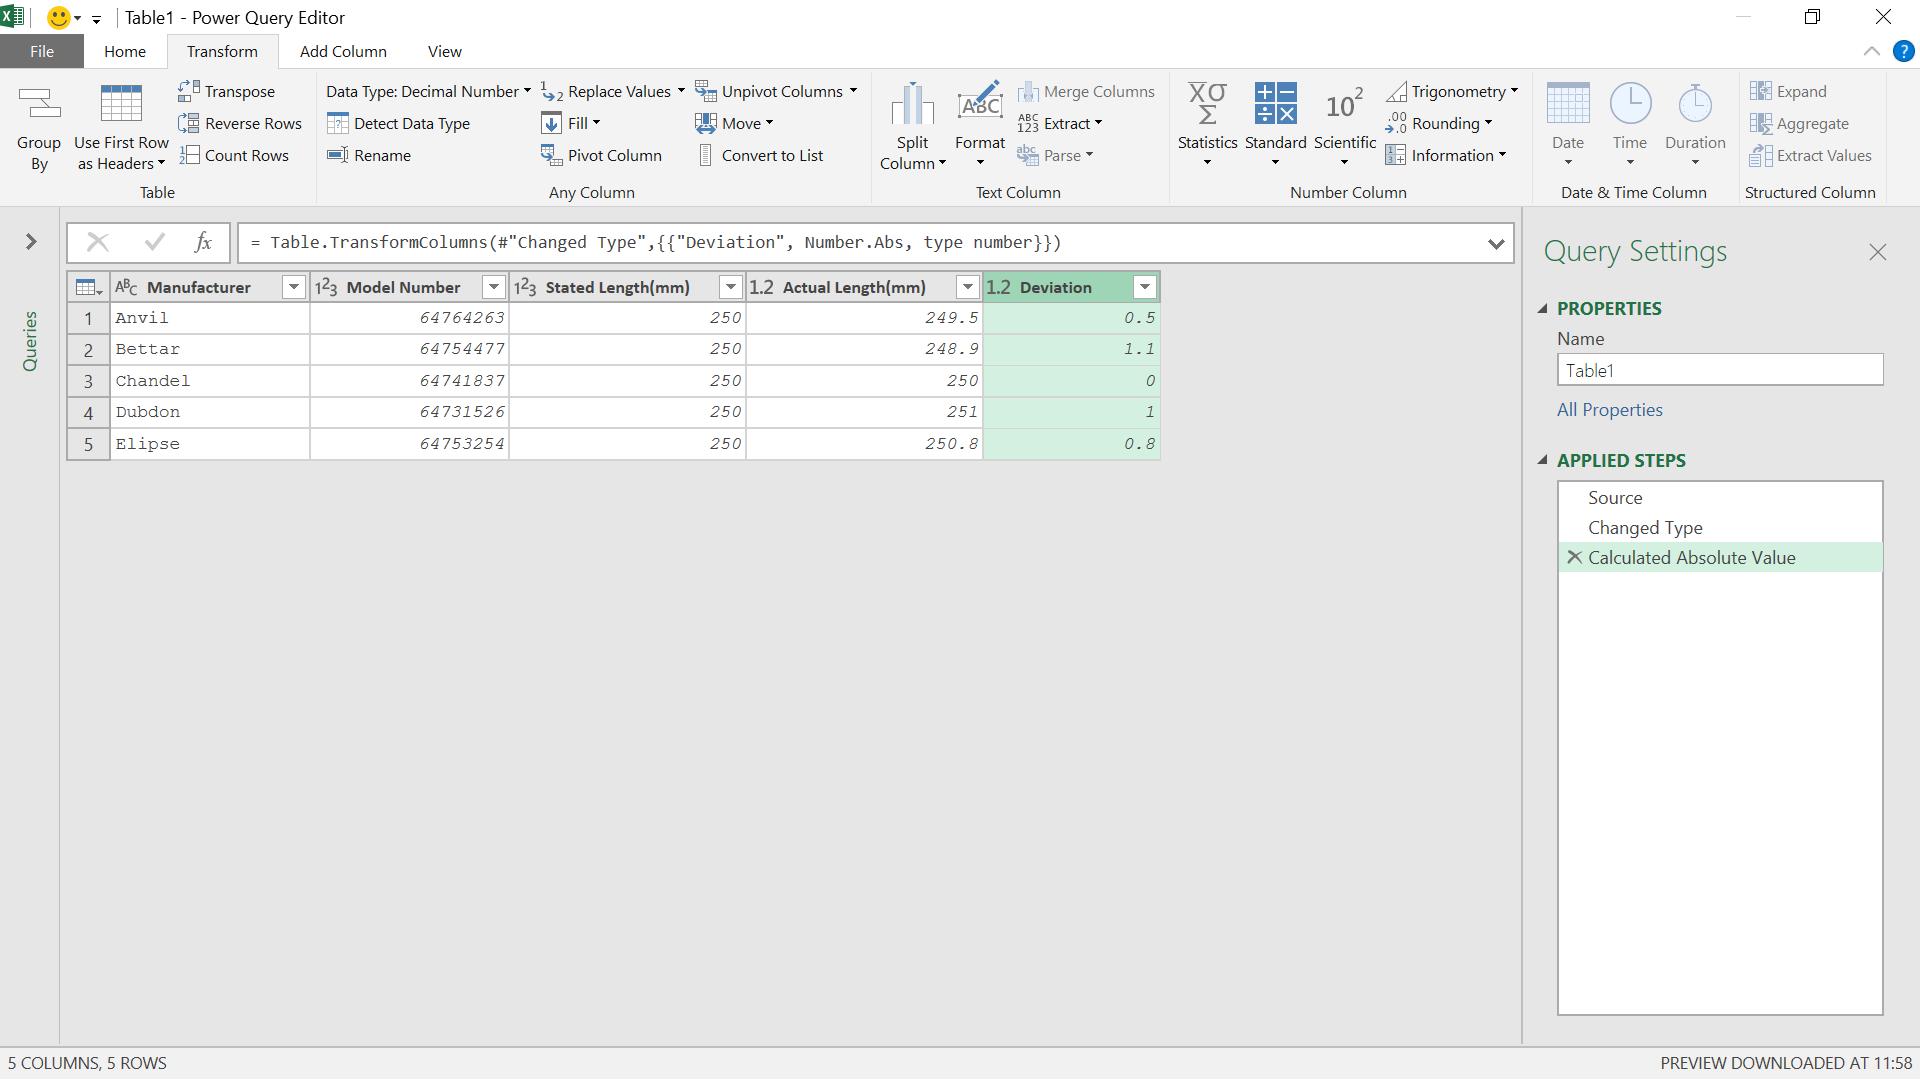
Now I can look at the Deviation column, to see what I can do with it. I am going to look at the options available on the ‘Transform’ tab, in particular, the ‘Scientific’ dropdown:
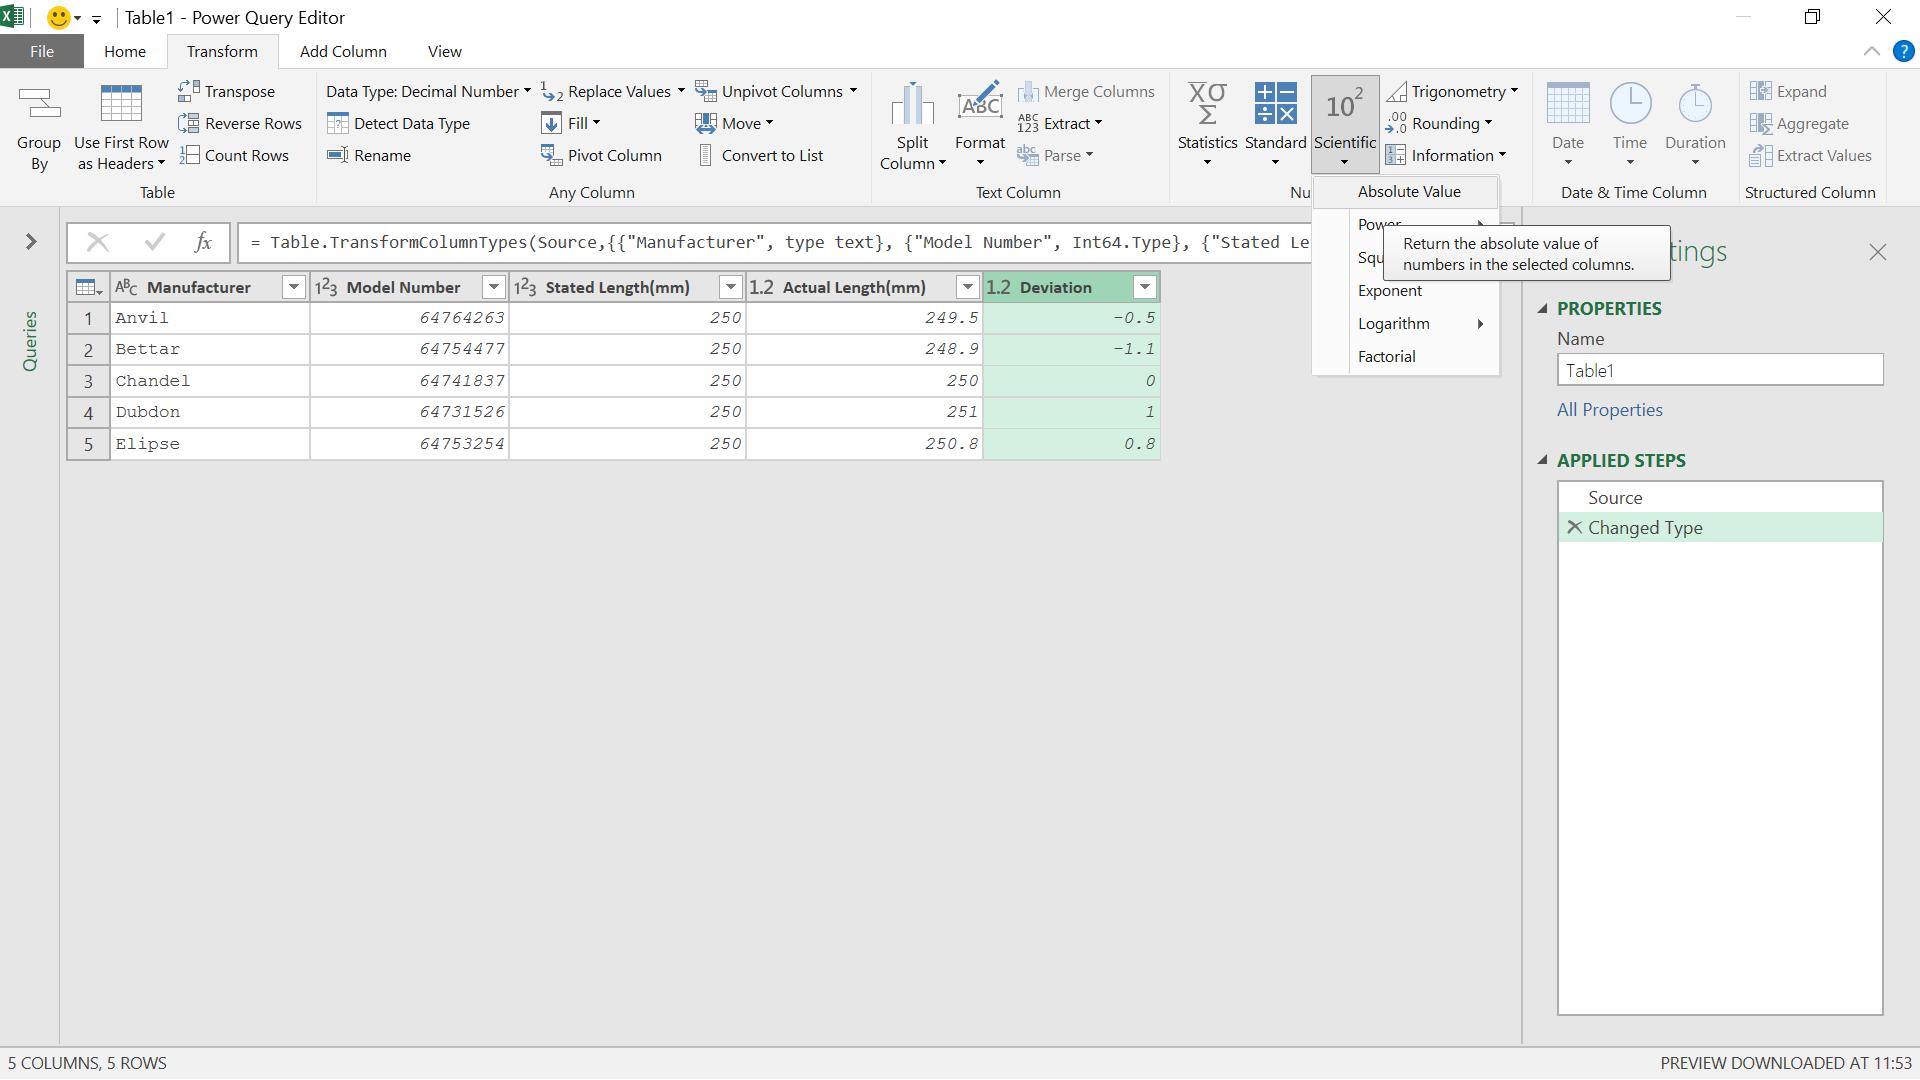
(This may also be accessed by right-clicking on the column and selecting ‘Absolute Value’ from the ‘Transform’ sub-menu.) I have the option of transforming the data in my column to show the ‘Absolute Value’. Absolute value is the difference between a number and zero, regardless of whether the number is non-negative or negative. It should give me the result I want.
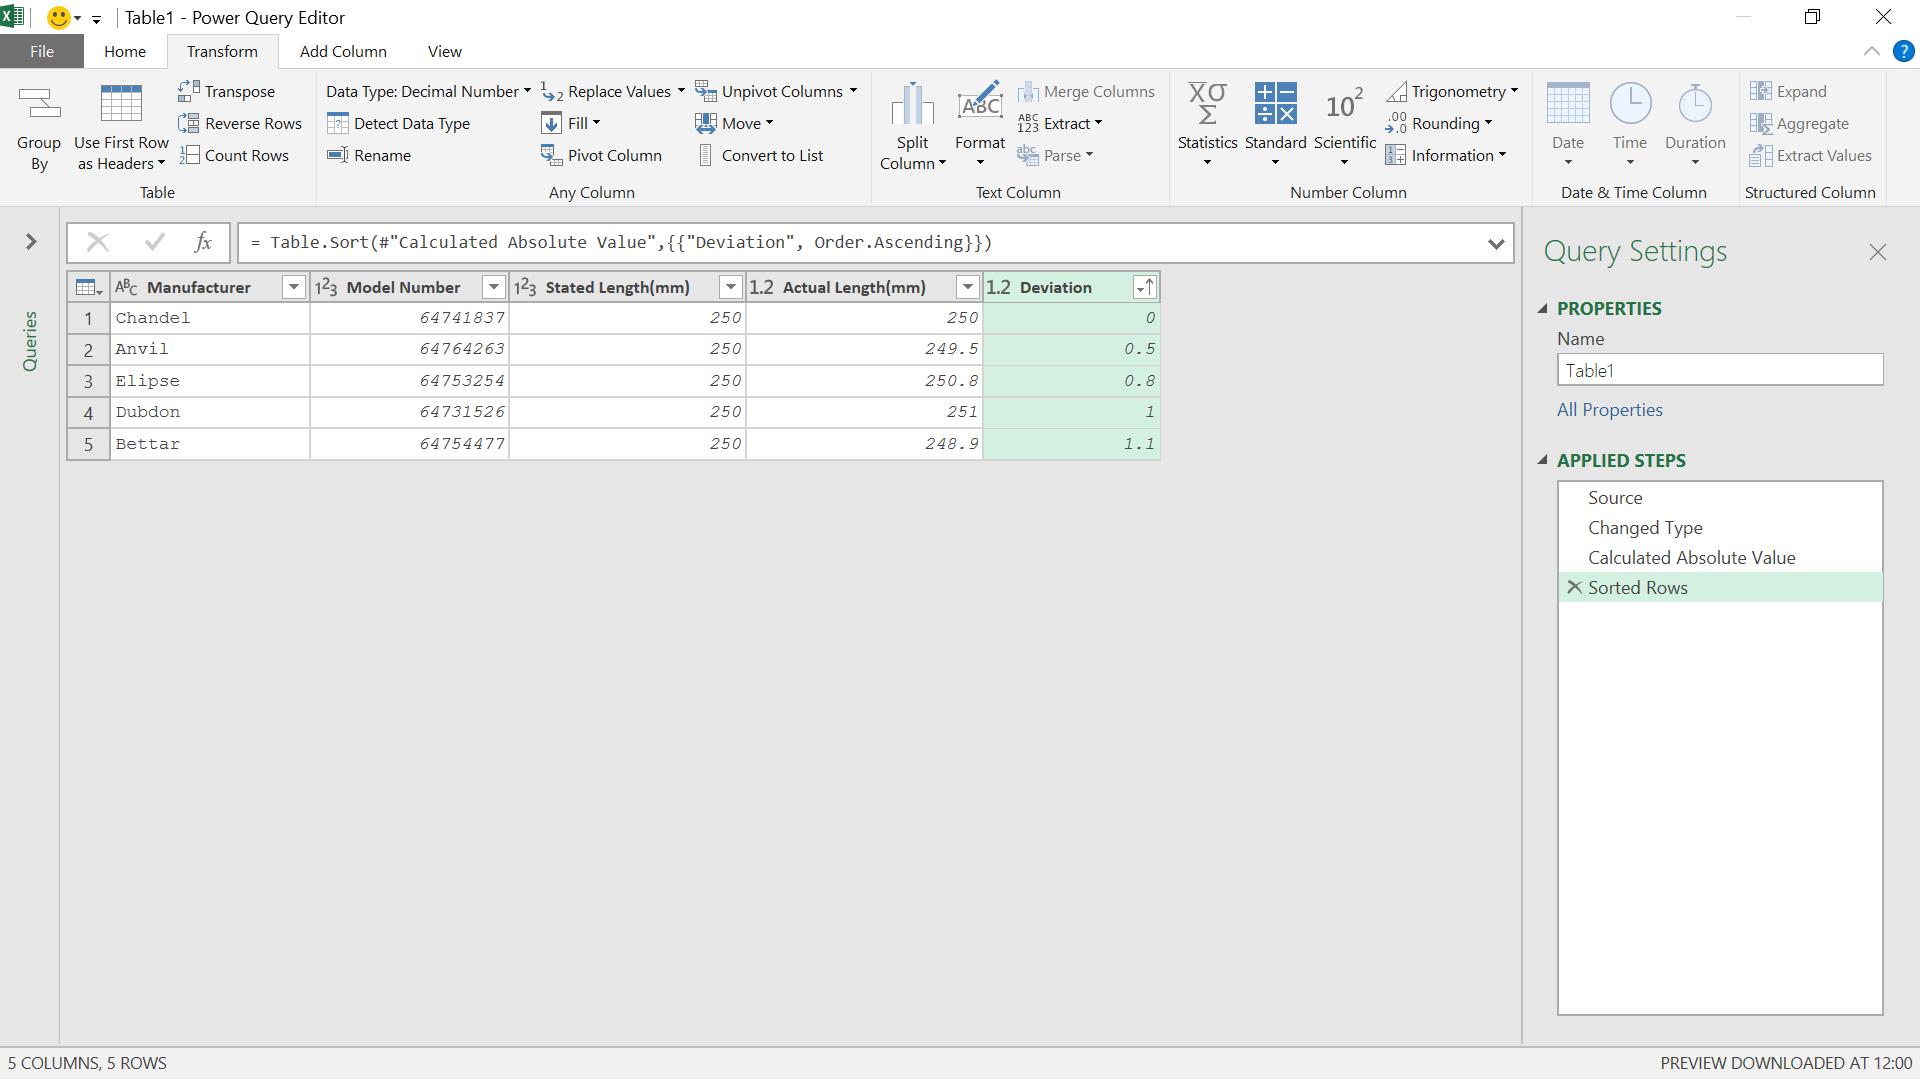
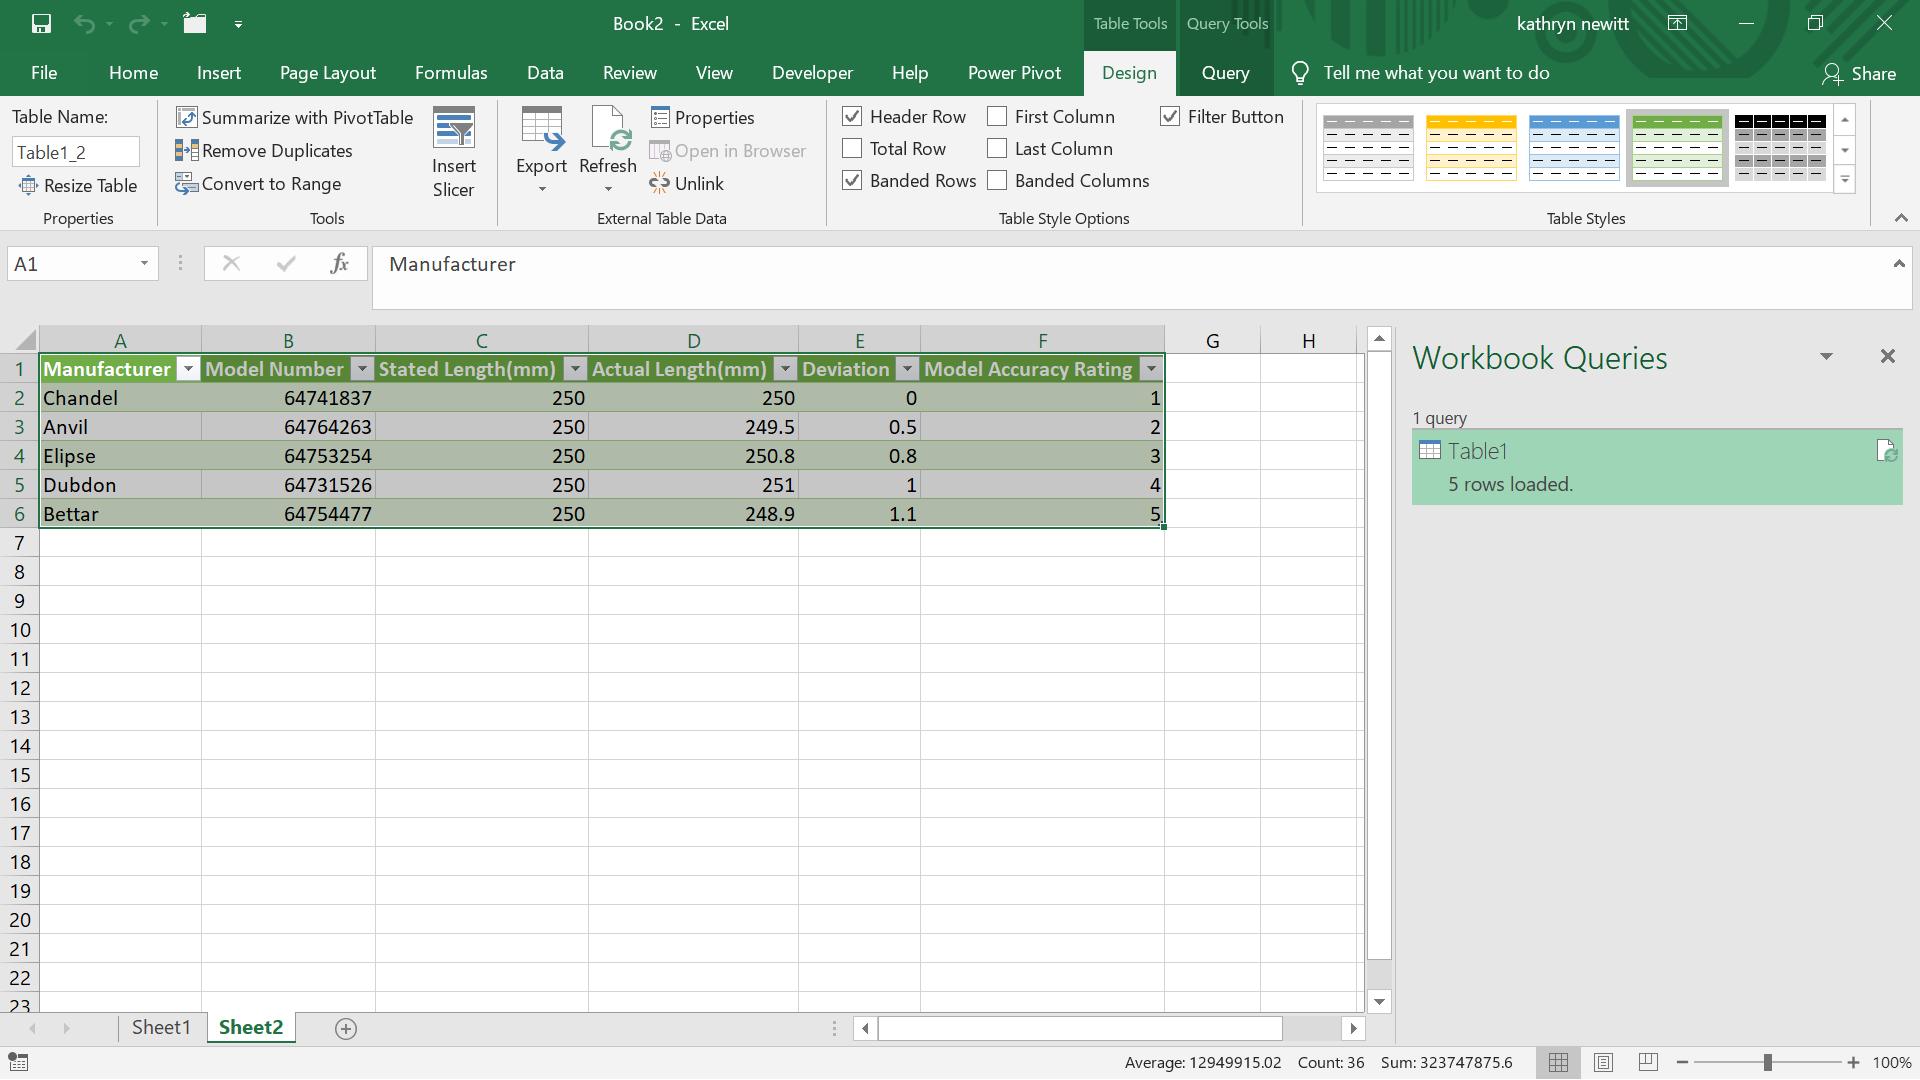
I have my absolute values, which means I can now sort my rows to show the order of accuracy of my models.
I can now create a new column to give each model a rating: I will use an index column.
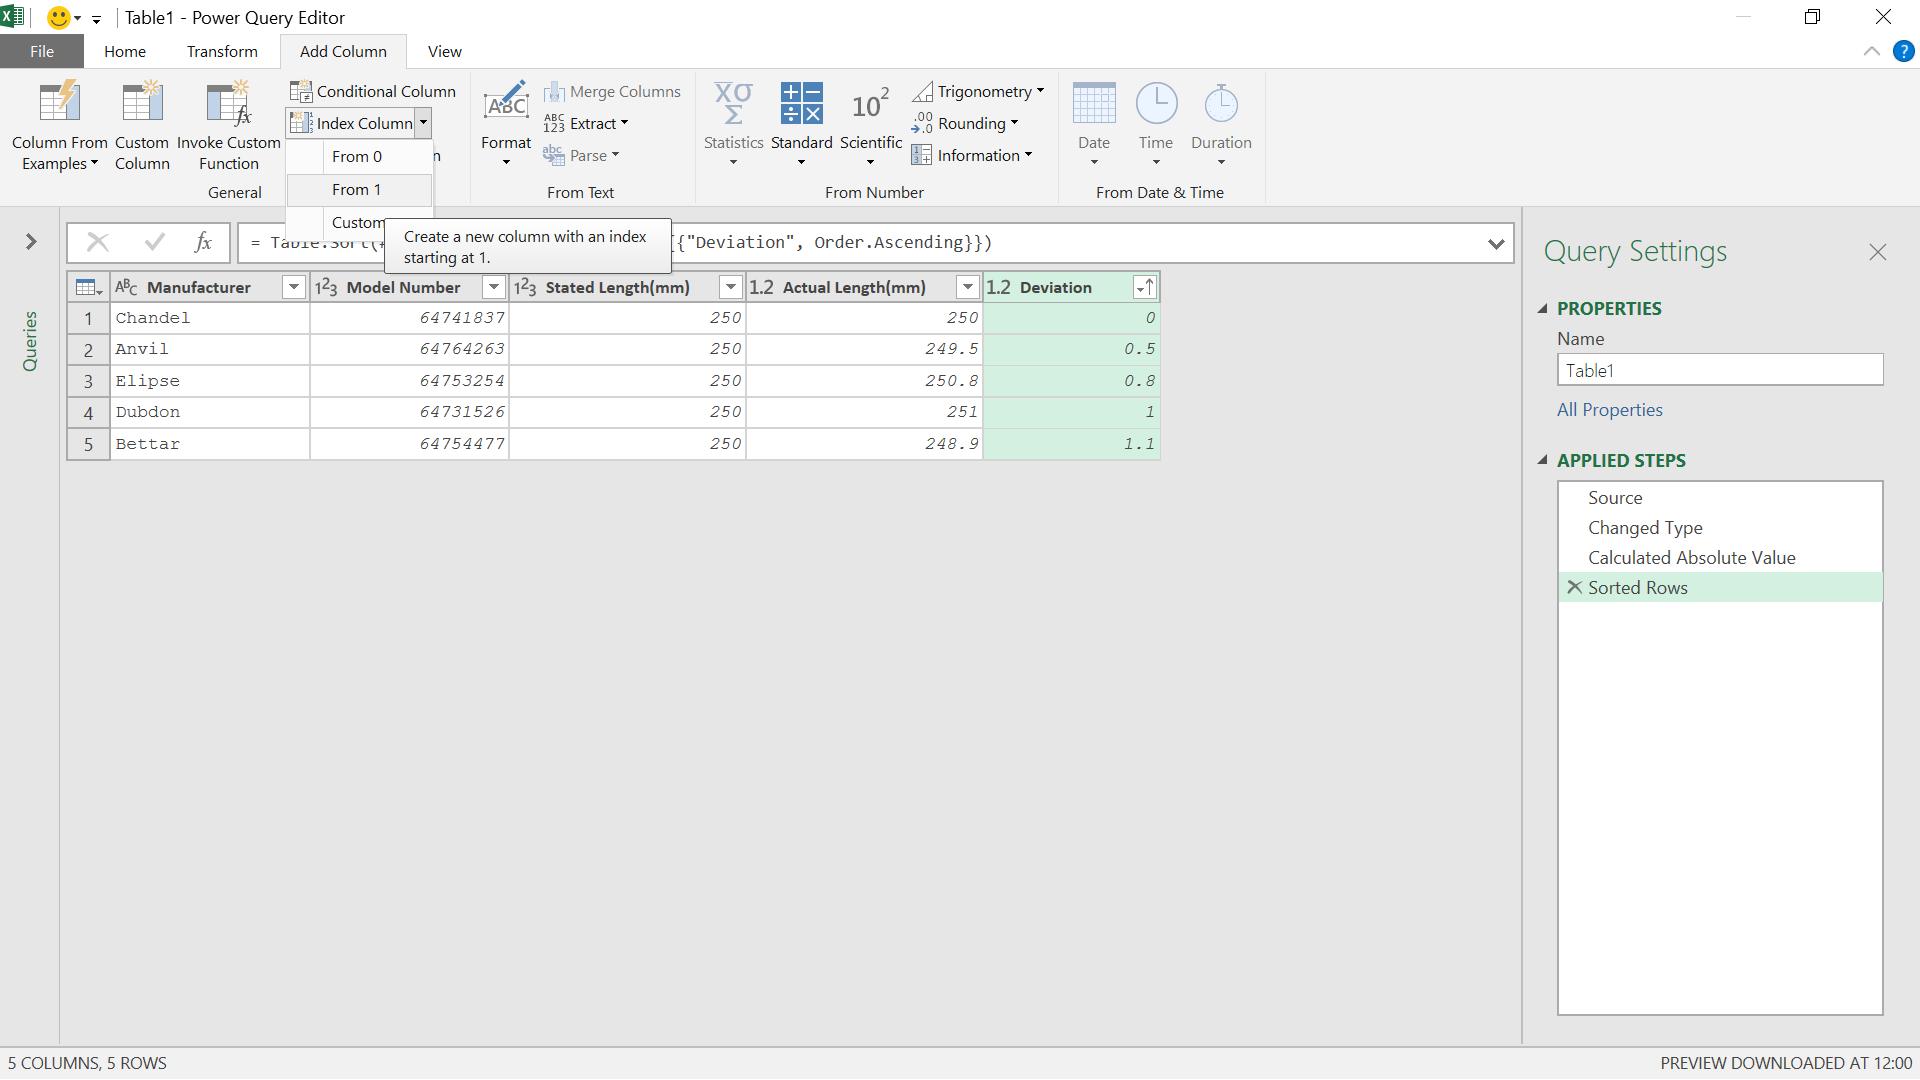
I choose to start my index at 1, so that 1 will be the “most accurate” record.
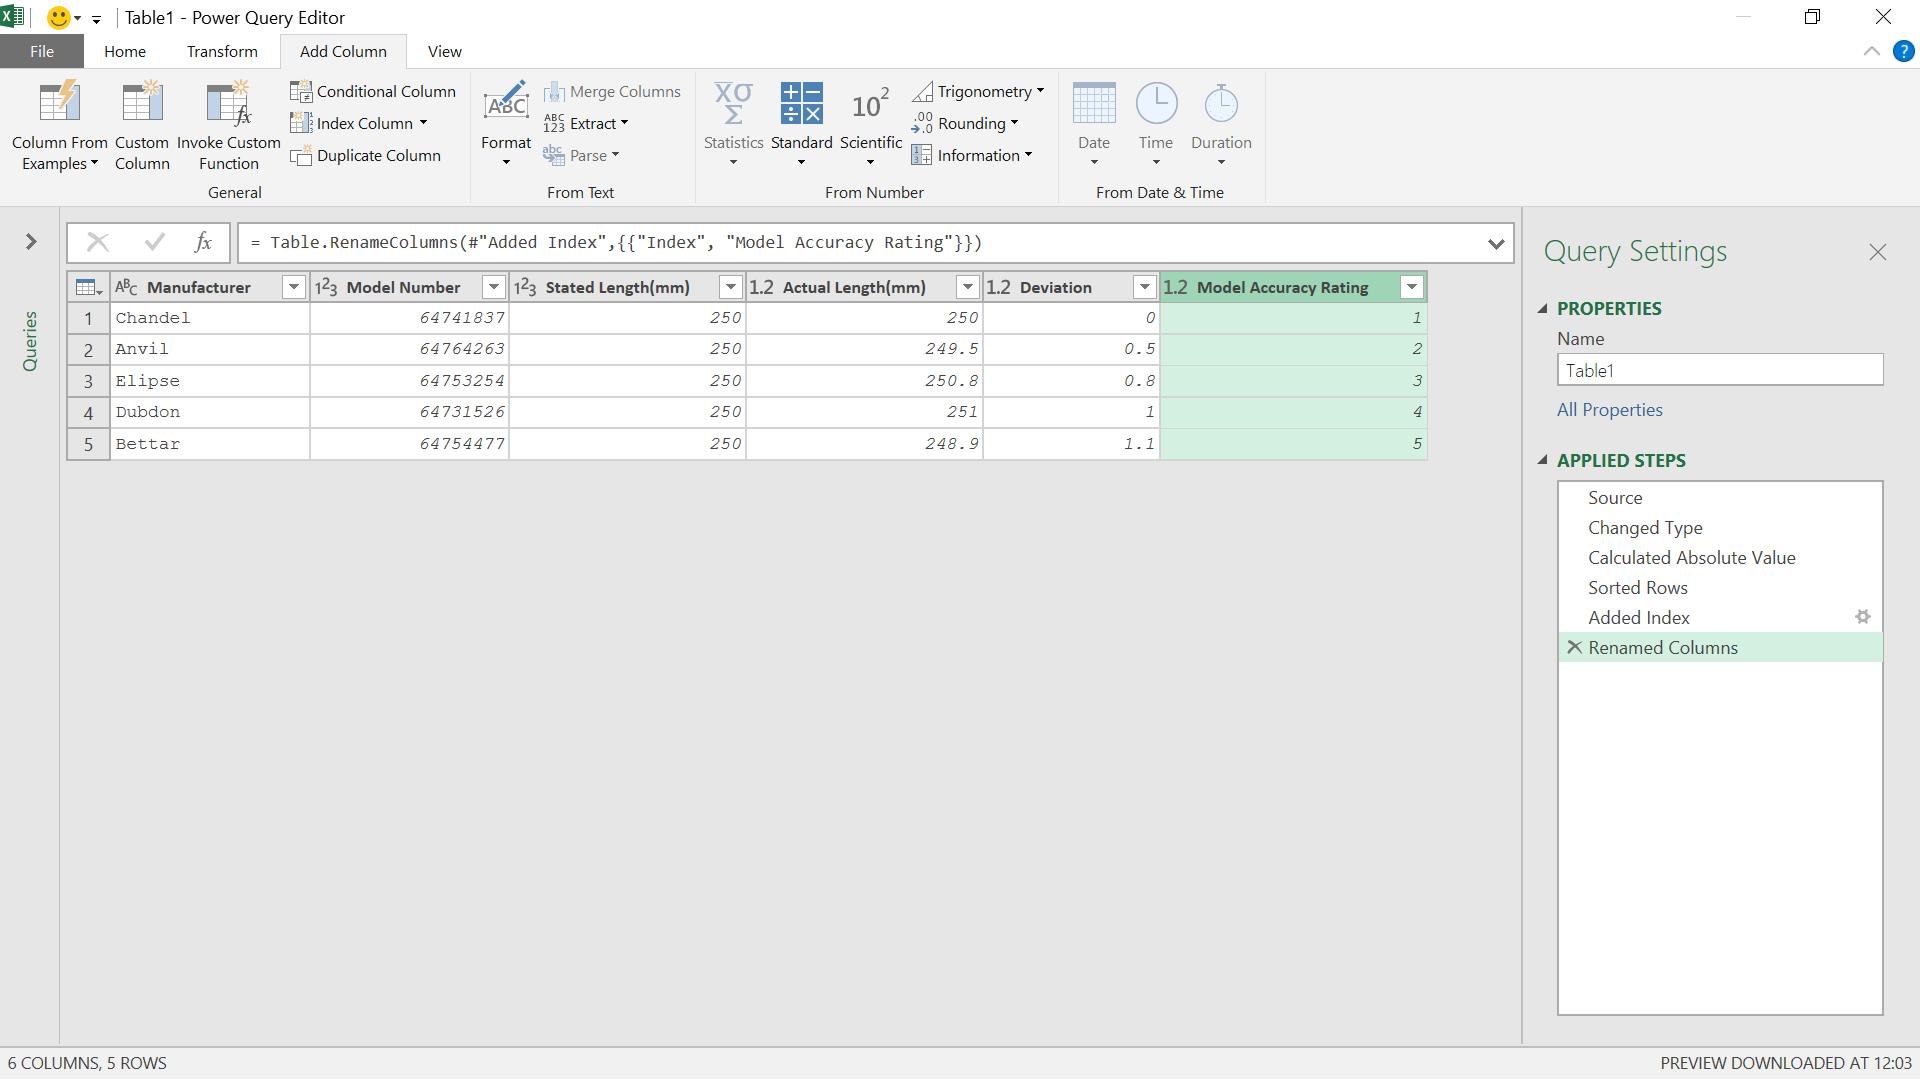
I have assigned a Model Accuracy Rating to each line, which will show me rankings, even when I need to reorder my data to perform other calculations. Then, I may ‘Close & Load’ my query from the ‘Home’ tab and view the information in Excel”.
My data is now more useful, and I can add more rows to my original sheet if I wish.
I can refresh my query to include my new data.
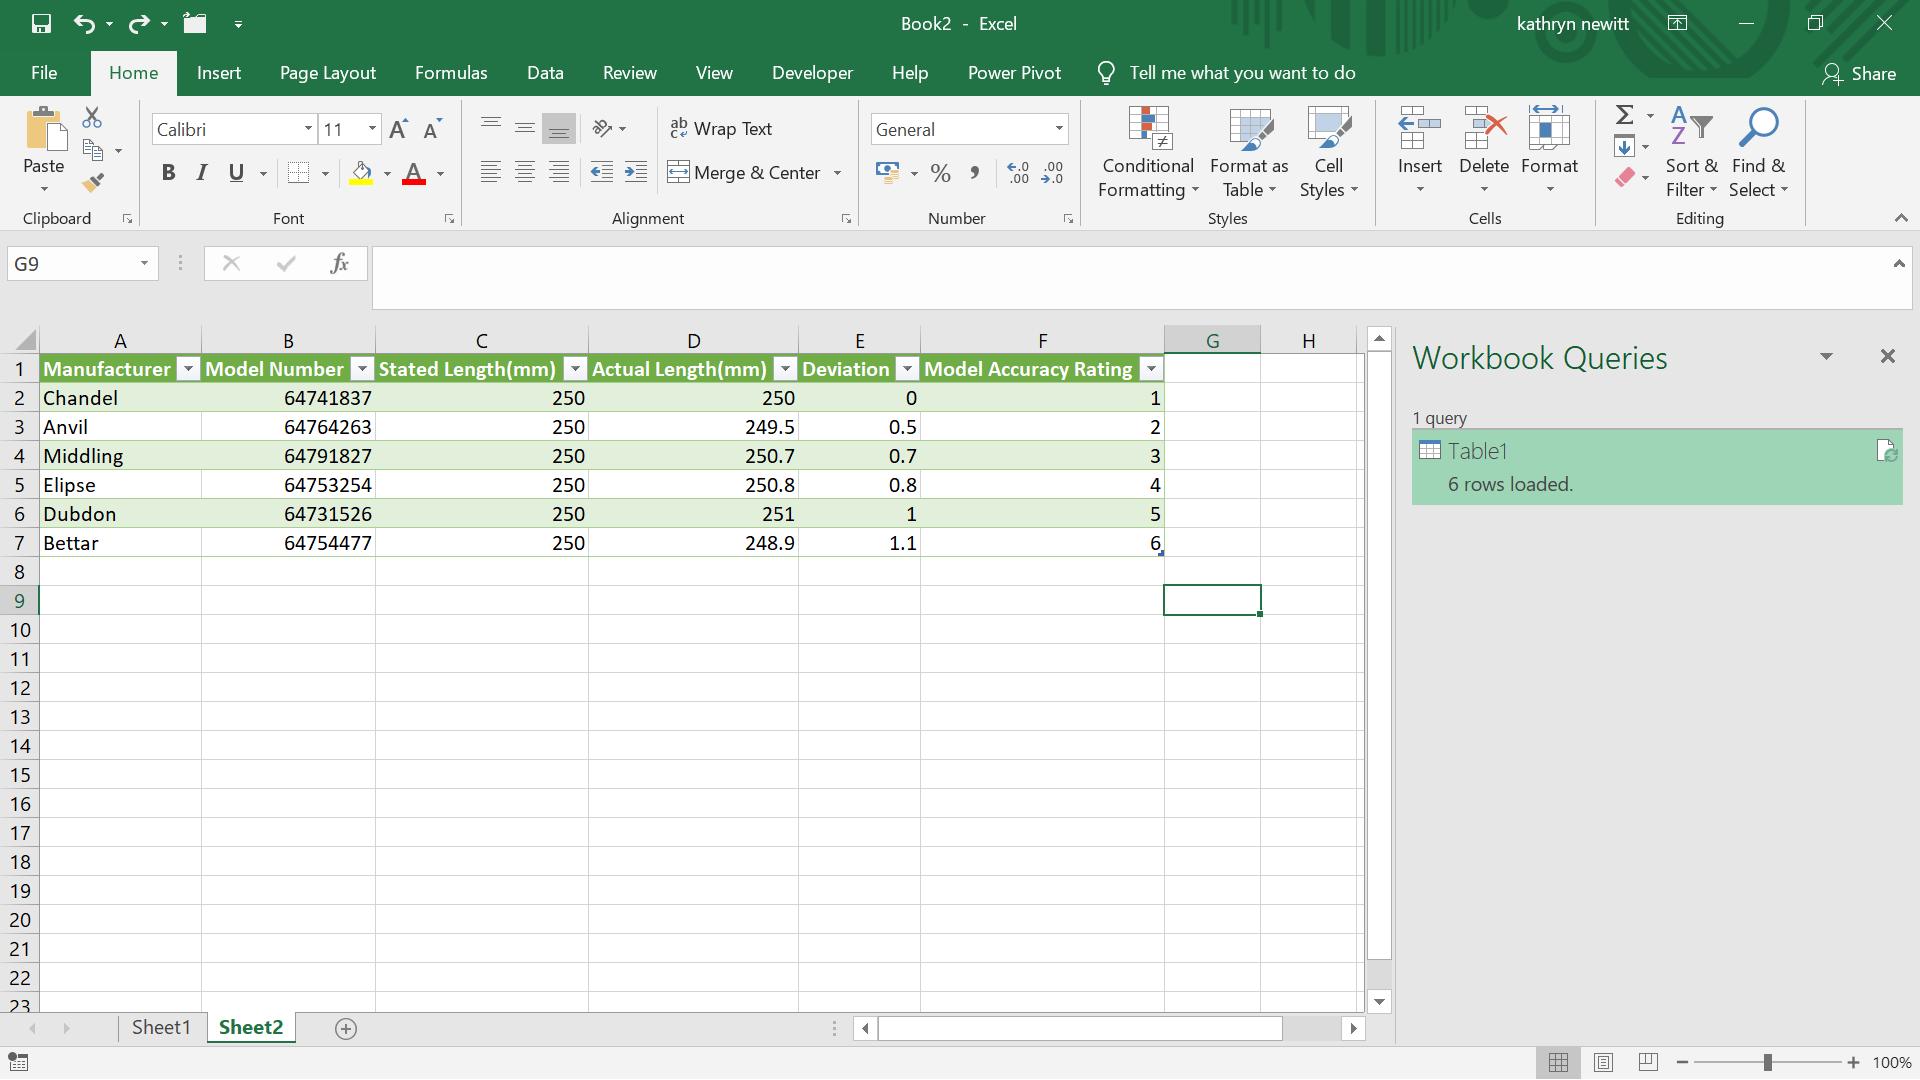
Middling’s model is a new entry at number 3!
Come back next time for more ways to use Power Query!