
Power Query: Join or List - Part 7
11 January 2023
Welcome to our Power Query blog. This week, I continue comparing alternative
approaches to extracting data from another table with approximate matching
using List() functions.
I know you have missed them: my imaginary salespeople are back! They are going to help me compare alternative approaches to pulling in data from one query to another, namely merging and using list functions. There are two examples that I am going to use in this series. I have covered the first example, which used exact matching.
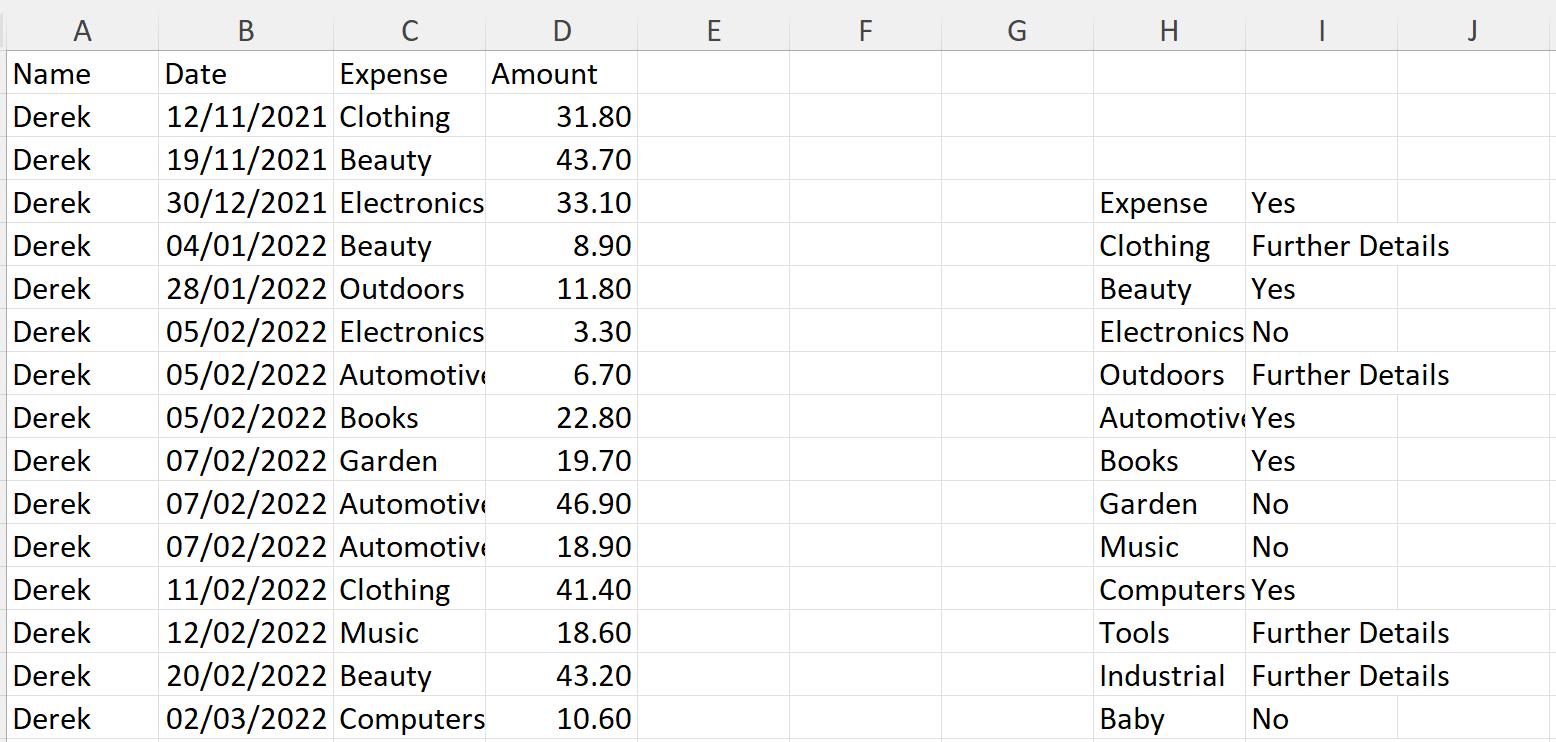
In Part 1 and Part 2, I looked at these two tables. The first is a list of item types that my salespeople have been putting under ‘personal’ on expenses. The second is a list indicating which are allowed and which are not, and any that require further information.
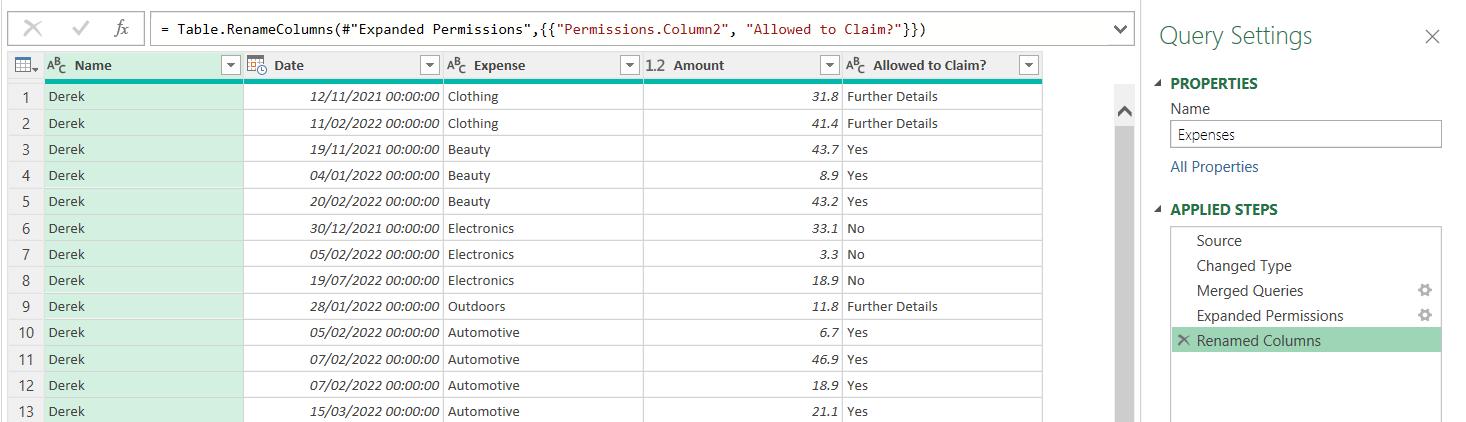
In Part 1, I merged the queries to get the result:
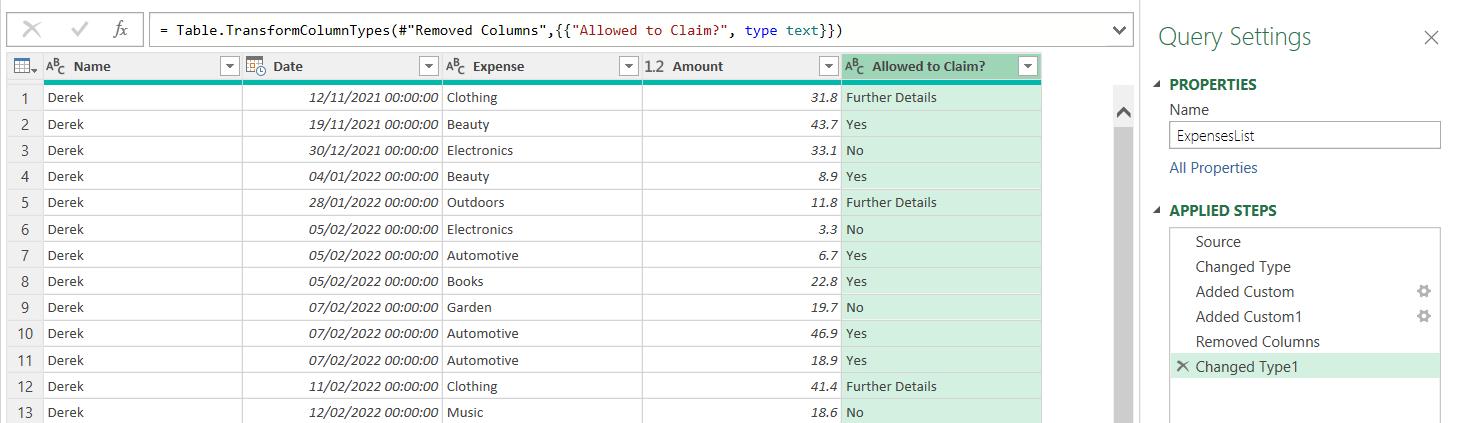
In Part 2, I used List functions to achieve the same result.
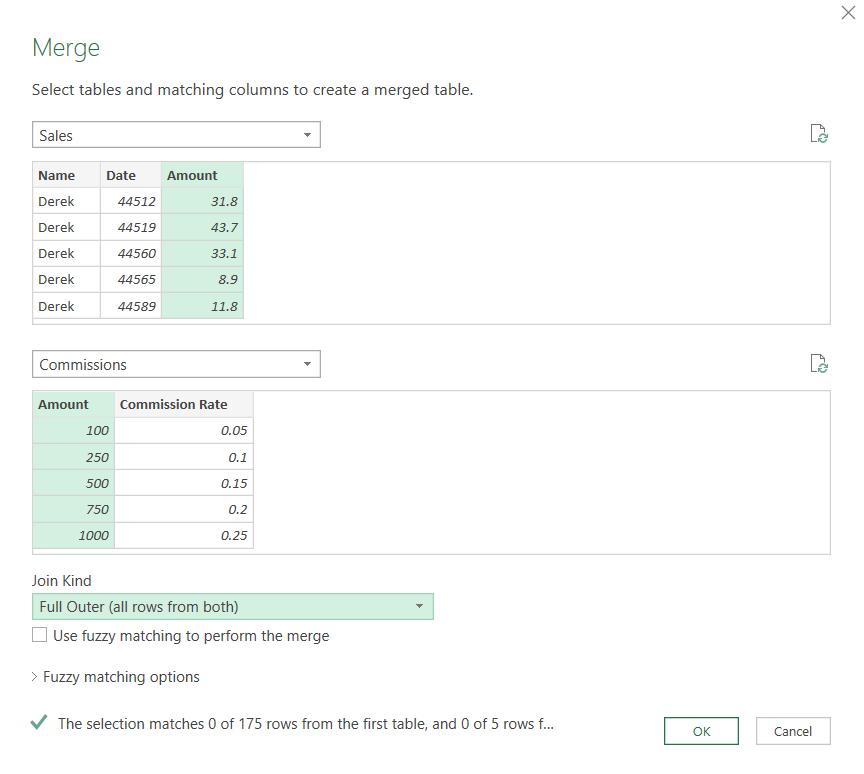
In Part 3, I moved onto the second example, which requires an approximate match. I have two more tables:

The plan is to encourage my salespeople to work harder, by linking their commission to each transaction. I extracted my data to Power Query and set about merging my queries:
Having transformed the resulting data, it seemed like I had a long way to go!

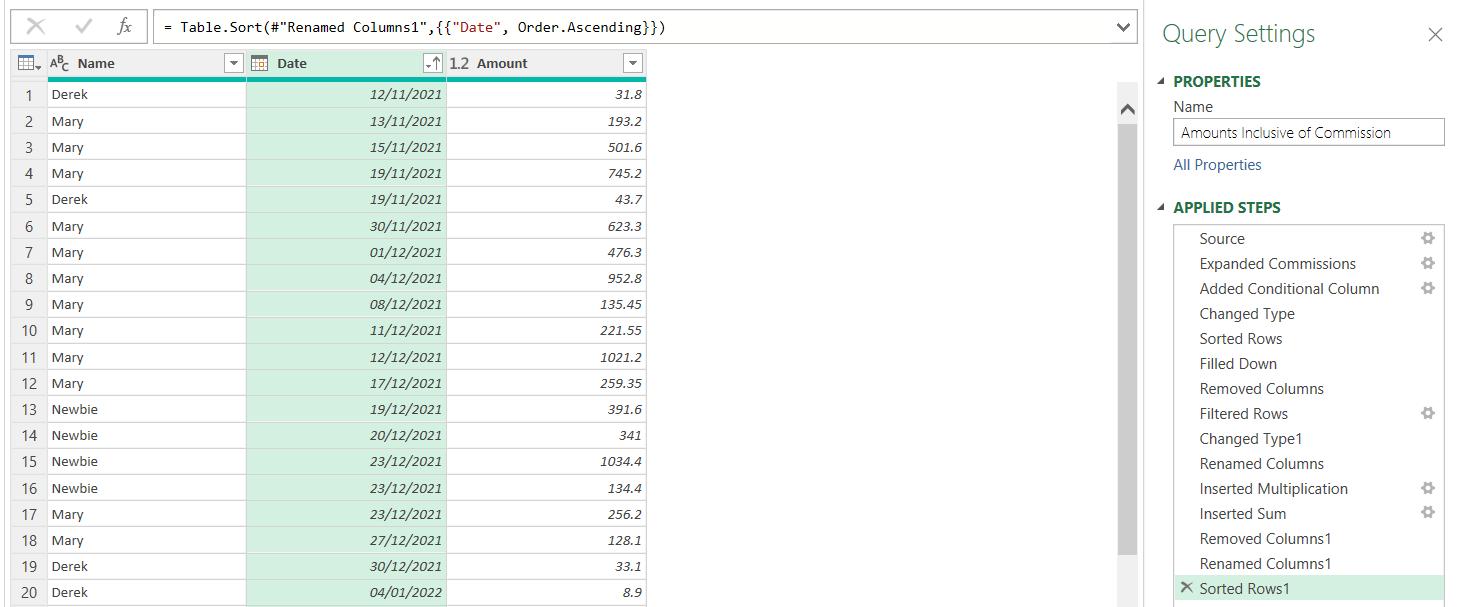
In Part 4, I transformed this data to get to the desired result.
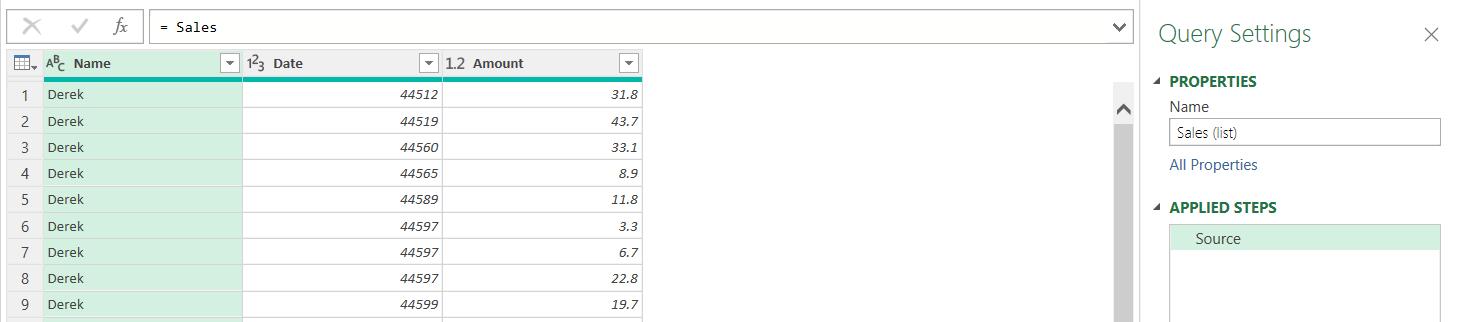
In Part 5, I created a reference of Sales, which I called Sales (list).
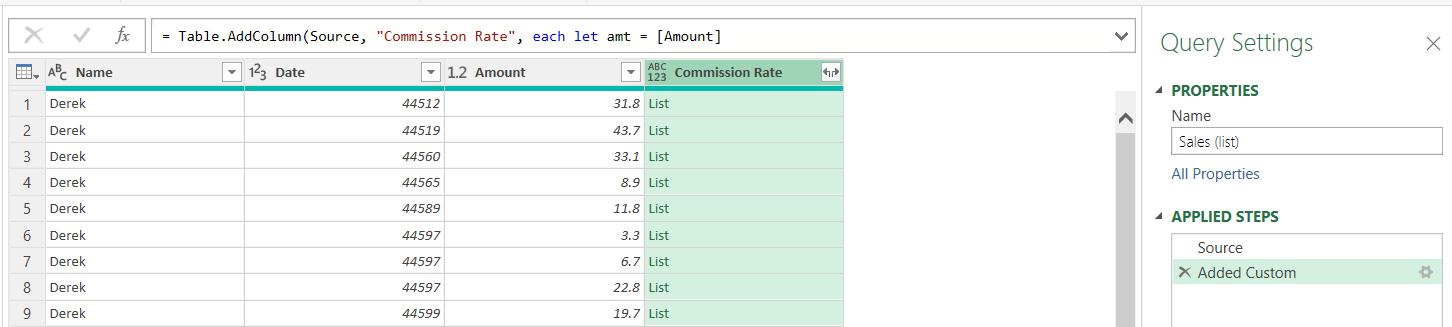
I added a new column Commission Rate to Sales (list), which comprised of a list of all the Amount values from Commissions which were less than or equal to the Amount on Sales (list).
Last time, I used List.Max() and the method from Part 2 to get my result, but this time I will use another method. I begin by creating a Duplicate copy of Sales (list):

I select the ‘Added Custom 3’ step and choose to ‘Delete Until End’.

I continue at the warning by pressing Delete:

Now I create a new Custom Column Commission. This method involves counting the number of list items returned to give the position of the rate associated with the highest band:

The M code is:
= Commissions[Commission Rate]{List.Count([Commission Rate])-1 }
This counts the number of items in the list and subtracts one [1] to get the index position in Commissions (since the index always starts from zero [0] by default). The associated Commission Rate then populates the Commission column.

This achieves the result in less steps than last time. As I did last week, I can replace the errors with zero [0] and proceed with the calculation.
Come back next time for more ways to use Power Query!