
Power Pivot Principles: The A to Z of DAX Functions – EARLIEST
11 July 2023
In our long-established Power Pivot Principles articles, we continue our series on the A to Z of Data Analysis eXpression (DAX) functions. This week, we look at EARLIEST.
The EARLIEST function
The EARLIEST function is one of the filter functions in DAX where it returns the current value of the specific column in an outer evaluation pass of the mentioned column. It employs the following syntax:
EARLIEST(column)
It only has one argument:
- column: this is required and, represents a column or expression that result to a column.
It should be further noted that:
- the EARLIEST function is similar to the EARLIER function which allows you to specify one additional level of recursion
- this function is not supported for use in DirectQuery mode when used in calculated columns or row-level security (RLS) rules.
To illustrate the use of the EARLIEST function, consider the following example:
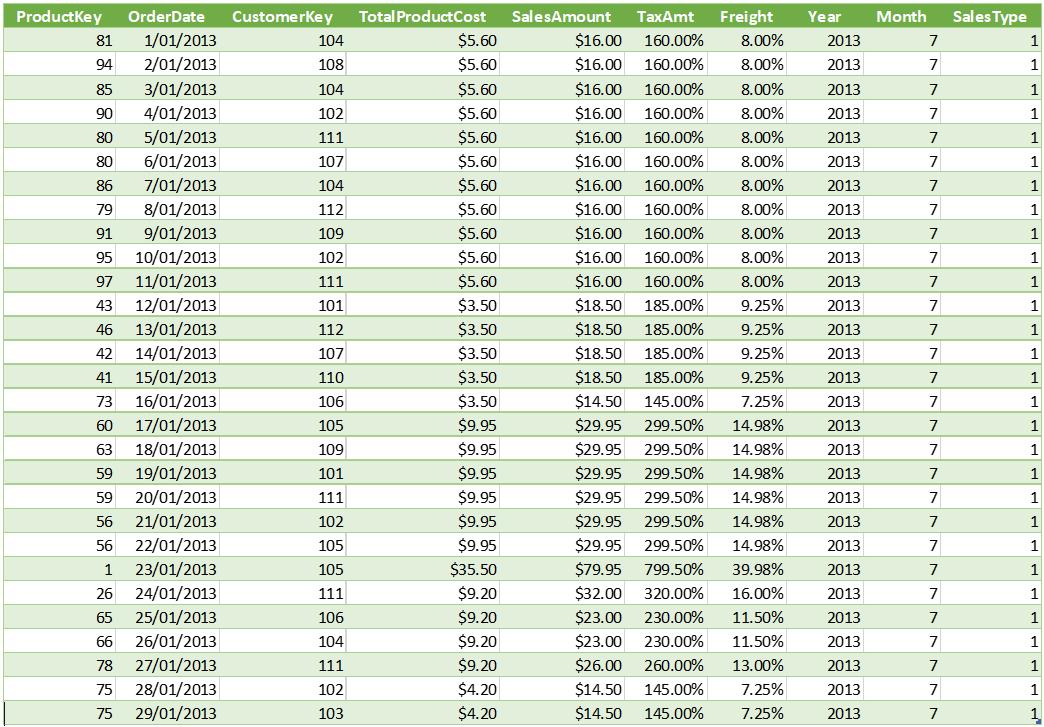
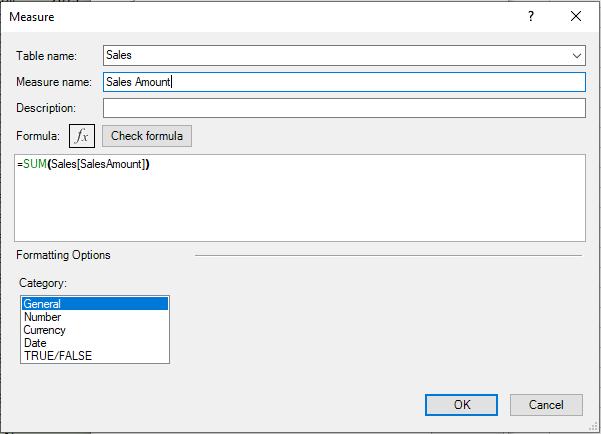
Here, we have the Sales table. We will create an aggregation measure for SalesAmount then we will use this aggregation along with the EARLIEST function to create a cumulative amount for each date, viz.
Next, we move to the Power Pivot data model there to create a calculated column with the following DAX code:
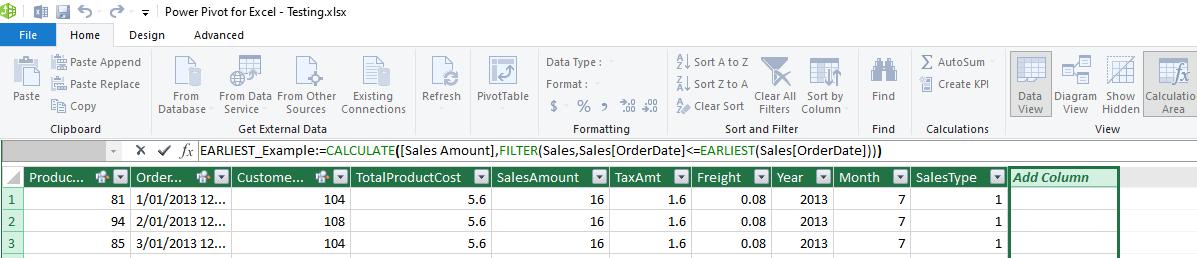
EARLIEST_Example:=CALCULATE([SalesAmount],FILTER(Sales,Sales[OrderDate]<=EARLIEST(Sales[OrderDate])))
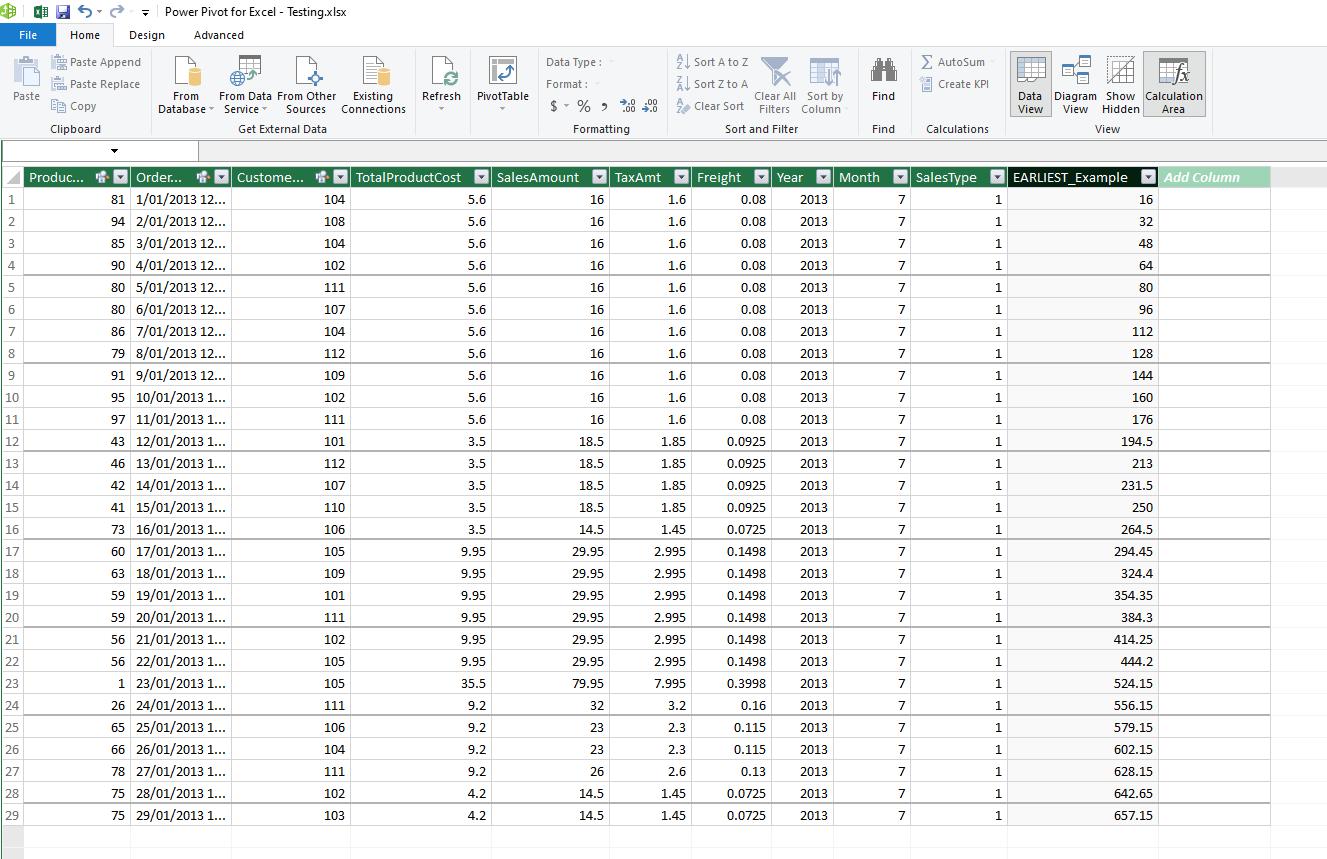
This DAX code will return a cumulative SalesAmount by date:
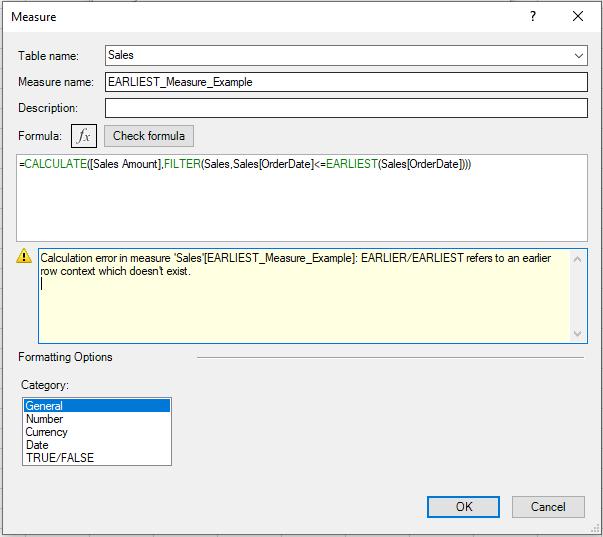
However, similar to the EARLIER function, if we use the same code in the calculated column to create a new measure, we will get an error message:
There is a workaround if you want to create measure instead of calculated column for the EARLIEST function:
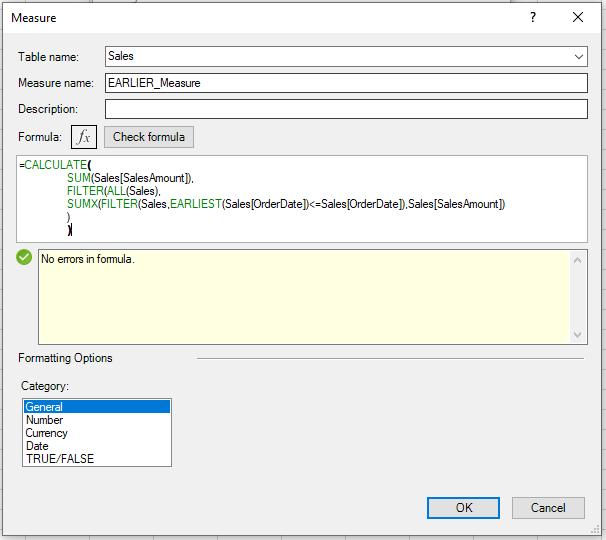
=CALCULATE(
SUM(Sales[SalesAmount]),
FILTER(ALL(Sales),
SUMX(FILTER(Sales,EARLIEST(Sales[OrderDate])<=Sales[OrderDate]),Sales[SalesAmount])
)
)
This DAX code help us replicate the same result we have in the previous example using calculated column for our measure. You can create a Pivot Table to view the result of the measure:
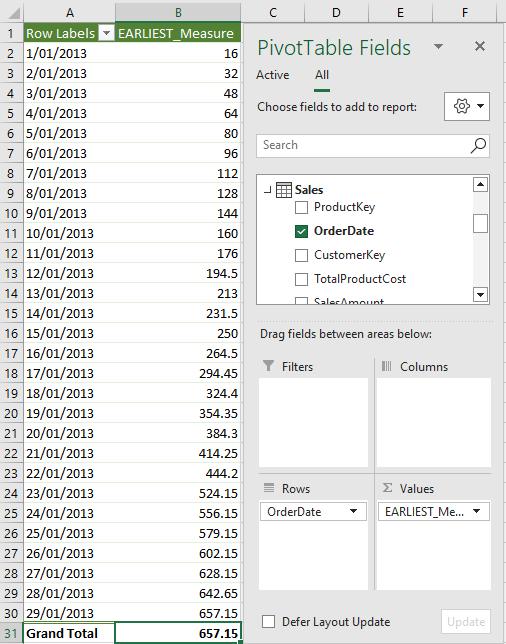
As we can see the result here is identical to the result using the calculated column in Power Pivot.
Come back next week for our next post on Power Pivot in the Blog section. In the meantime, please remember we have training in Power Pivot which you can find out more about here. If you wish to catch up on past articles in the meantime, you can find all of our Past Power Pivot blogs here.