
Power Pivot Principles: The A to Z of DAX Functions – CROSSJOIN
29 November 2022
In our long-established Power Pivot Principles articles, we continue our series on the A to Z of Data Analysis eXpression (DAX) functions. This week, we look at CROSSJOIN.
The CROSSJOIN function
The DAX function CROSSJOIN returns a table that contains the Cartesian product of all rows from all tables in the arguments. Translating this into English, imagine you had two sets, A {x, y, z} and B {1, 2, 3}. Named after the French philosopher and mathematician René Descartes, the Cartesian product, A x B, would be the set of all ordered pairs from (x, 1) to (z, 3), viz.

This can be very useful when we want to analyse all possible combinations from two or more sets – or in this case, tables.
Therefore, CROSSJOIN is a powerful DAX function that joins the contents from different tables to obtain desired lookup parameters. The columns in the new table are all the columns in all the argument tables. It has the following syntax:
CROSSJOIN(table, table[, table]…)
where:
- table is any DAX expression that returns a table of data.
This function returns a table that contains the Cartesian product of all rows from all tables in the arguments. It should be noted that column names from table arguments must all be different in all tables or an error is returned.
Let’s look at one simple example. Consider the following two tables:

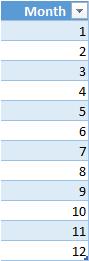
The first table contains the value of year (2019, 2020 and 2021) and the second table contains the value from 1 to 12.
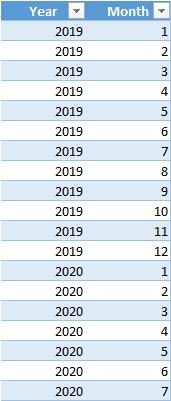
The result we want is something like (not fully displayed):

In total, there would be 36 rows, since there are three years, 12 months and 3 x 12 = 36. The Year table is cross joined with Month table with each individual value.
In order to cross join two tables above, we can evaluate the measure in DAX editor:

The expression here is:
Evaluate
CROSSJOIN(MonthTable, YearTable)
The DAX editor evaluates the syntax and generate the result table directly in the worksheet and the result would be:
Come back next week for our next post on Power Pivot in the Blog section. In the meantime, please remember we have training in Power Pivot which you can find out more about here. If you wish to catch up on past articles in the meantime, you can find all of our Past Power Pivot blogs here.