
Power Pivot Principles: The A to Z of DAX Functions – COLUMNSTATISTICS
18 October 2022
In our long-established Power Pivot Principles articles, we continue our series on the A to Z of Data Analysis eXpression (DAX) functions. This week, we look at COLUMNSTATISTICS.
The COLUMNSTATISTICS function

The COLUMNSTATISTICS function is one of the information functions. It provides statistics regarding every column in every table in the model. This function does not have parameters in its syntax:
COLUMNSTATISTICS()
This function will return a table with six [6] columns in the following order Table Name, Column Name, Min, Max, Cardinality and Max Length. Each of these columns have different functionality:
- Table Name: this is the column containing the name of the different tables within the model
- Column Name: this is the column containing the name of the different columns in the different tables within the model
- Min: this column shows the minimum values visible in the attribute
- Max: this column shows the maximum values visible in the attribute
- Cardinality: this column provides the number of unique values for each attribute in the data table
- Max Length: this column shows the maximum lengths of strings visible in the attribute.
It should be further noted that:
- the COLUMNSTATISTICS function returns the values and attributes to the user considering the security roles. Hence, different users can get different results querying the same model because of different security profiles
- there will be an extra row named RowNumber in Column Name for each table which details the number of rows a table has
- when used with a DirectQuery data source over SQL Server, it is compatible only with SQL Server 2019 or later version, because internally it uses APPROX_COUNT_DISTINCT
- the COLUMNSTATISTICS function is not compatible with Excel and currently it is only compatible with Power BI, SSAS Tabular, Azure AS and SSDT.
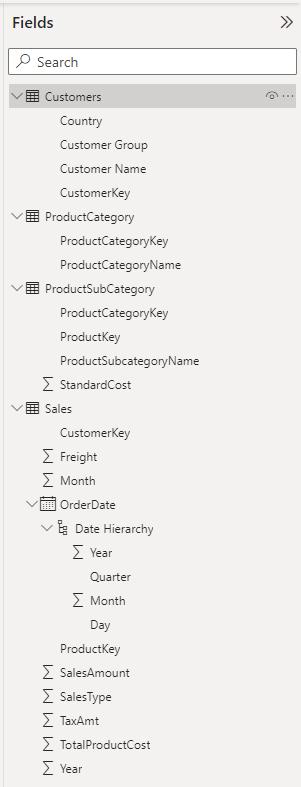
Please have a look at the following example where we have a Power BI file that has four [4] different tables namely: Sales, Customer, ProductCategory, ProductSubCategory.
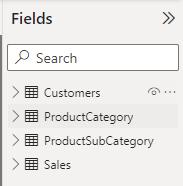
These tables have the following columns:
Since the output of the COLUMNSTATISTICS function is a table, we will write a DAX expression to create a new table with this function:
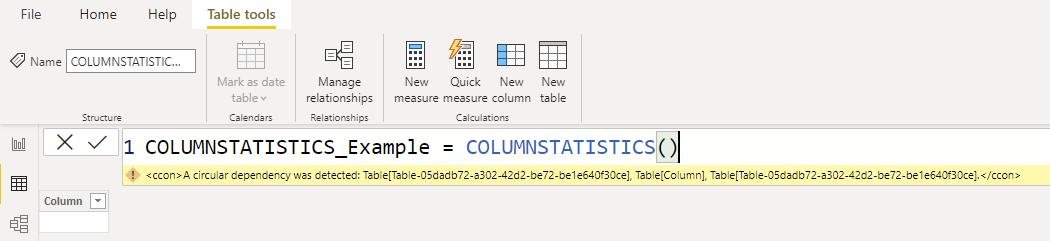
After writing the query and then hitting enter, we have the above error. This error occurred because our COLUMNSTATISTICS function tries to summarise itself along with other tables in the data model – just like the ouroboros eating its own tail here. In technical terms, we created a circular dependency. Thus, writing this DAX code in a new calculated table will not work out. We must find another way.
Instead of creating this as a physical table, what if we create it as a virtual table so that it is not looping back on itself in a circular dependency? Hence, we should create a measure here which I named it COLUMNSTATISTICS_Example, viz.
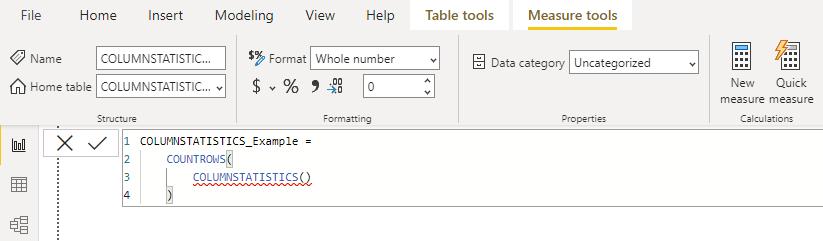
Don’t worry about the red squiggly line here since IntelliSense doesn’t recognise it but the function still works fine in Power BI. When we put this measure into a card visual, we will have the following figure:
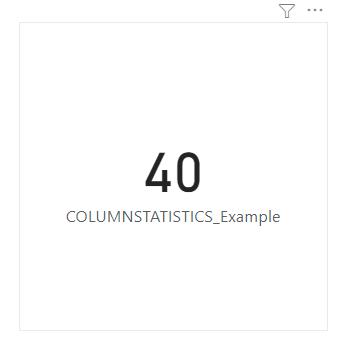
This show that there are 40 lines in the column statistics table.
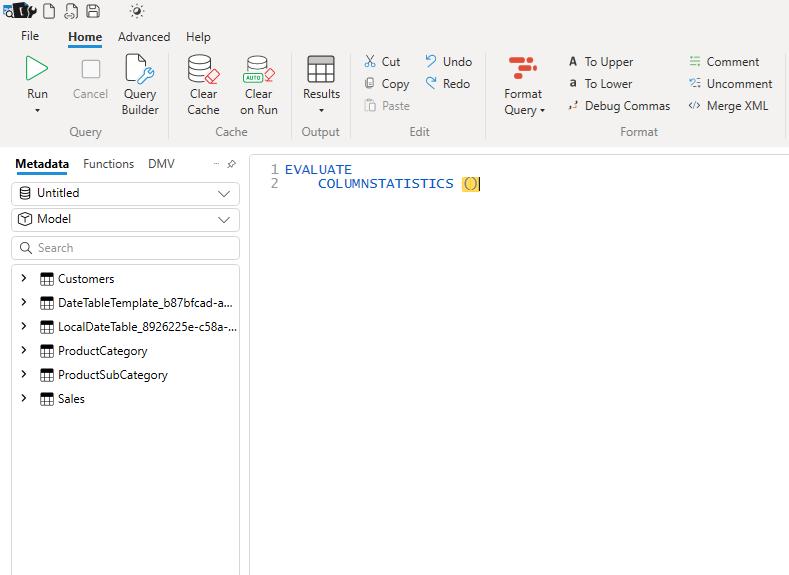
Now, the question is how can we extract the statistics data here? For the purposes of this example, we will use ‘DAX Studio’ to output this to a file. In ‘DAX Studio’. After we connect Power BI to ‘DAX Studio’, we can write the similar ‘DAX expression’ we wrote from the start:
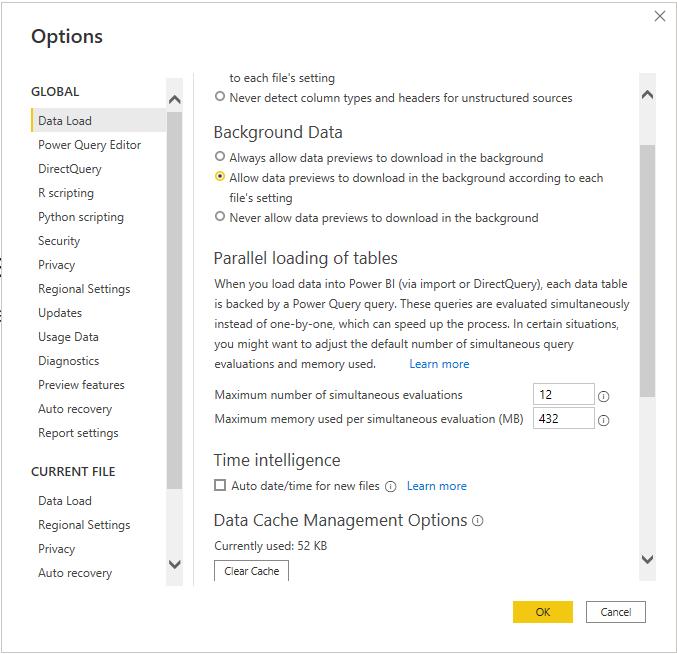
But why are we having six [6] tables here? Aren’t we only inputting four [4] tables here? This is because Power BI will execute its ‘Auto date/time’ functionality which built a hidden Date table name LocalDateTable for the Sales table since only the Sales table has a column containing Date value. If we have more tables containing a column that contains date value Power BI will create more LocalDateTable tables. Whereas the DateTableTemplate table is just a dummy table that Power BI creates to store the Date and Time format. To avoid Power BI creating these tables we can untick the ‘Auto date/time for new files’ under Time intelligence in Settings:
After we press the Run button in the Query section it will give us the following result:
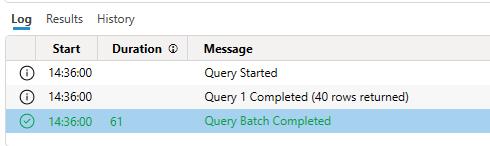
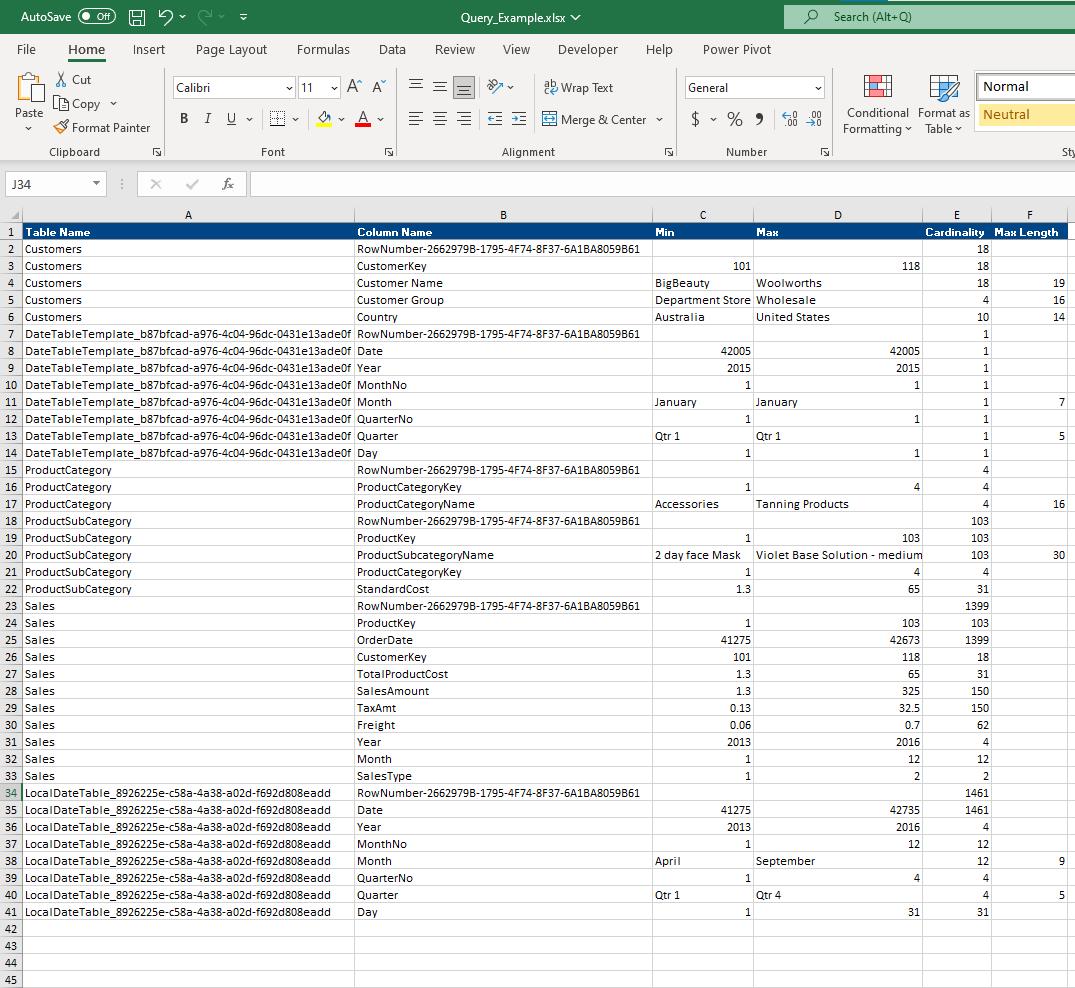
There are 40 rows returned here which matches our example using the COUNTROWS function earlier. It would be fewer rows if we untick the ‘Auto date/time for new files’, but here in our example, we kept the box ticked. Now, to extract the statistics data in Excel here we simply choose Home -> Output -> Results -> Static then we press the Run button and save the files on the local drive. In the example here, I will save my file as Query_Example. We will have the following Excel file that contains the statistics data we want to extract:
Come back next week for our next post on Power Pivot in the Blog section. In the meantime, please remember we have training in Power Pivot which you can find out more about here. If you wish to catch up on past articles in the meantime, you can find all of our Past Power Pivot blogs here.