
Power Pivot Principles: Working with Averages – Part 2
3 November 2020
Welcome back to the Power Pivot Principles blog. This week, we will talk about using the AVERAGEX function when working with averages in DAX.
The AVERAGEX function calculates the average (arithmetic mean) of a set of expressions evaluated over a table. This function follows the syntax:
AVERAGEX (table, expression)
where
- table is the name of a table, or an expression that specified the table over which the aggregation can be performed
- expression is an expression with a scalar result, which will be evaluated for each row of the table in the first argument.
The AVERAGEX function enables you to evaluate expressions for each row of a table, and then take the resulting set of values and calculate its arithmetic mean. Therefore, the function takes a table as its first argument, and an expression as the second argument.
In all other respects, the AVERAGEX function follows the same rules as the AVERAGE function; non-numeric or null cells cannot be included and both the table and expression arguments are required. When there are no rows to aggregate, the function returns a blank; when there are rows, but none of them meet the specified criteria, then the function returns zero (0).
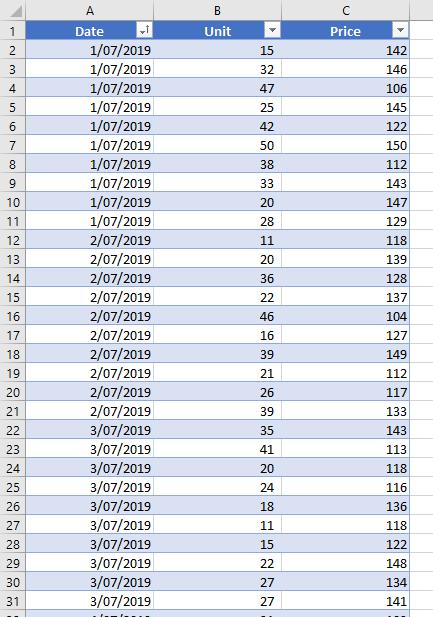
Let’s look at an example. Consider that we have Sales data for a product in a store with the Unit sales and Price changes during the day, which is already loaded into the Power Pivot Data Model, viz.
In the Power Pivot Data Model, we also create a Calendar table and set up the relationship between the two tables:

We want to know the average sales by date, month and year, where total sales equals unit sales multiplied by the unit price.
We can create a Sales column:
Sales = Sales[Unit] * Sales[Price]
Then, we find the average of the Sales column by creating the Average Sales measure:
AVERAGE(Sales[Sales])

Alternatively, we can shorten the process by creating the measure using the AVERAGEX function in just one step:
Average Sales AVERAGEX:= AVERAGEX(Sales, Sales[Unit]*Sales[Price])

The two measures provide the exactly same result in the PivotTable:

The AVERAGEX function is helpful when we have a large data set and creating multiple calculated columns for just one measure is not the most efficient way.
That’s it for this week!
Stay tuned for our next post on Power Pivot in the Blog section. In the meantime, please remember we have training in Power Pivot which you can find out more about here. If you wish to catch up on past articles in the meantime, you can find all of our Past Power Pivot blogs here.