
Power Pivot Principles: Variables and Disconnected Tables in Power BI
29 January 2019
Welcome back to our Power Pivot blog. Today, we discuss how to use a combination of disconnected tables and variables to produce unique slicers in Power BI.
This week we are going to do a bit of a cross over between Power Pivot’s DAX language and Power BI. As you may know, Power BI also uses DAX to create measures and process data just like Power Pivot. The reason why we will be using Power BI for this week’s blog is because the SELECTEDVALUE formula detailed below just isn’t available in Power Pivot’s DAX library – yet.
We are going to create a slicer that is connected to a disconnected table (see Power Pivot Principles: Disconnected Tables and Exchange Rates for further details).
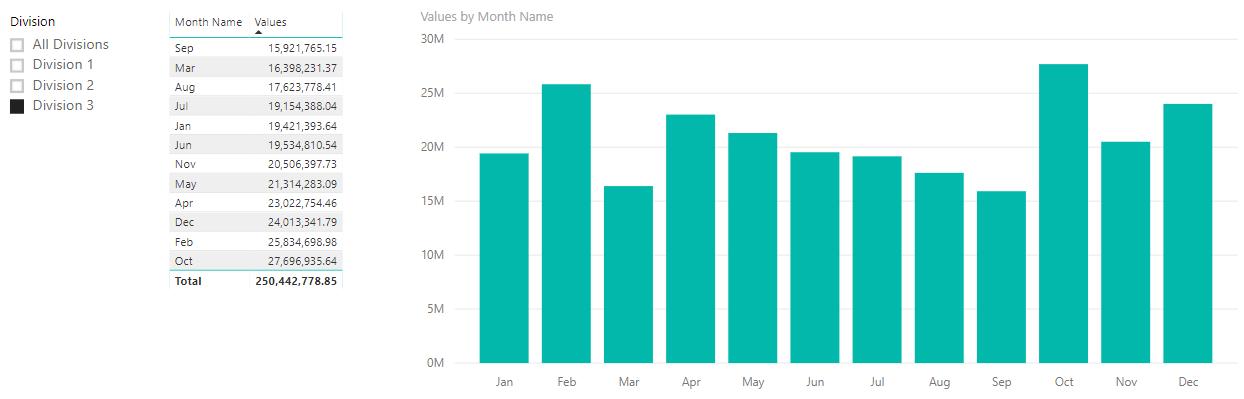
Whilst the slicer will have a direct effect on the disconnected table, the table has no link to all of the other tables currently in our dataset. However, through using variables, the SELECTEDVALUE and the SWITCH function, we will be able to manipulate the visualisations on our dashboard, viz.
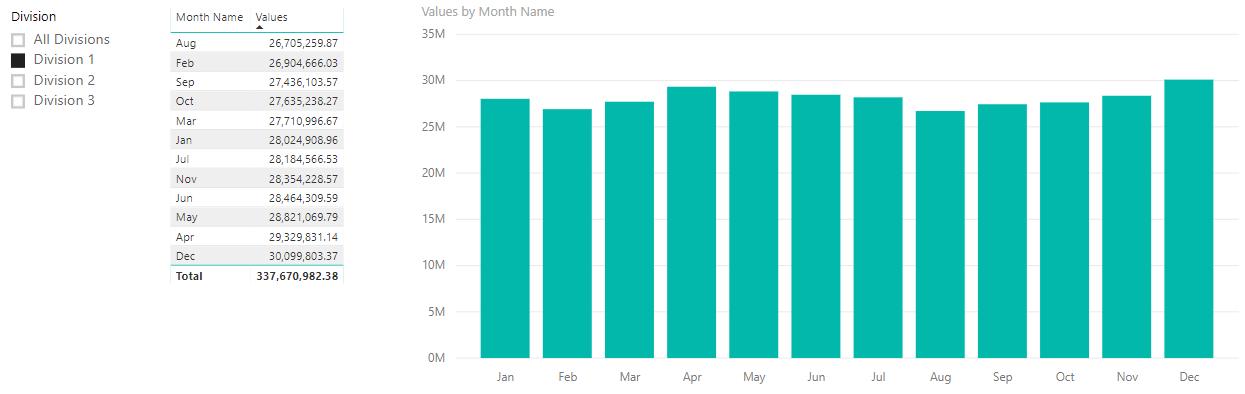
compared with
To begin (assuming we already have all of our data loaded into Power BI and created measures to calculate the sales for Divisions 1, 2, 3, and All Divisions), we need to create a disconnected table with our four categories. We can upload a pre-made table from Excel to detail this categorisation:
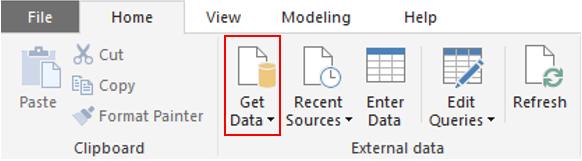
Alternatively, we can create a table directly in Power BI using the ‘Enter Data’ button on the Ribbon (but do not link this table to any other table in the dataset):
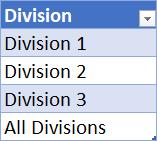
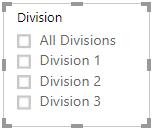
The next step is to create a slicer with the ‘Division’ table:
Now on to the measure. If you need to catch up on what variables are in DAX we have an article here that you may read.
We will use the DAX expression:
Values =
VAR DivisionNo =
SELECTEDVALUE(‘Division Type’[Division], [All Divisions])
RETURN
SWITCH(TRUE(),
DivisionNo = "Division 1", [Division 1],
DivisionNo = "Division 2", [Division 2],
DivisionNo = "Division 3", [Division 3],
[All Divisions])
We use the SELECTEDVALUE function to declare the value that will be used by the variable ‘DivisionNo’. The [All Divisions] measure in the SELECTEDVALUE formula specifies the function to return (with the sum of all divisions) should none be selected.
VAR DivisionNo =
SELECTEDVALUE(‘Division Type’[Division], [All Divisions])
Then, we shall utilise DivisionNo’s value to call one of three measures that calculates the actual, budgeted or forecasted sales. Distinguishing between the three measures is achieved using the SWITCH function:
RETURN
SWITCH(TRUE(),
DivisionNo = "Division 1", [Division 1],
DivisionNo = "Division 2", [Division 2],
DivisionNo = "Division 3", [Division 3],
[All Divisions])
The final step is to insert the Values field into any visualisations where we want to be able to switch between actual, budgeted, or forecasted sales.
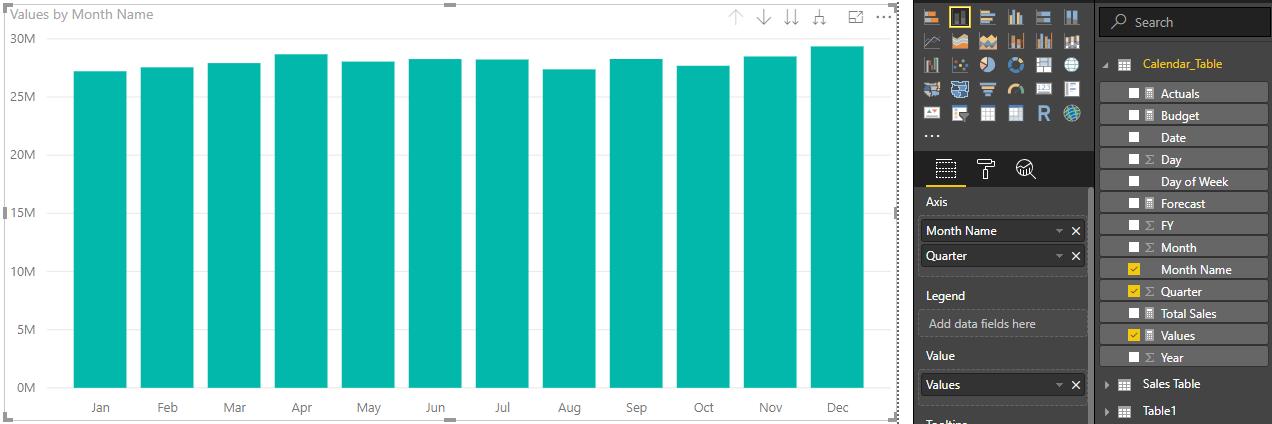
We can now toggle freely between the three divisions that we have specified and have the visualisations updated accordingly!
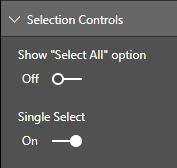
On a final note, we do not need to worry about our users selecting two or three options in the slicer. We’ve deliberately left ‘Single Select’ on which does not allow for multiple option selections in the slicer.
That’s it for this week, happy pivoting and BI-ing!
If this topic interests you we also have a Power BI blog that goes up every Thursday. A complete list of our Power BI blogs can be found here.
Stay tuned for our next post on Power Pivot in the Blog section. In the meantime, please remember we have training in Power Pivot which you can find out more about here. If you wish to catch up on past articles in the meantime, you can find all of our Past Power Pivot blogs here.