
Power Pivot Principles: Introducing the SAMEPERIODLASTYEAR Function
5 November 2019
Welcome back to the Power Pivot Principles blog. This week, we are going to look at the function SAMEPERIODLASTYEAR function.
Previously in our Blog, we have introduced a method of comparing the value of current periods with other periods by using DATEADD. This week, we are going to learn another function that returns the result one year back, SAMEPERIODLASTYEAR.
The SAMEPERIODLASTYEAR function returns a table that contains a column of dates shifted one year back in time from the dates in the specified dates column, in the current context. For example, we can use this function to calculate the data for the last year and compare this amount with current context.
Consider the data table shown below:
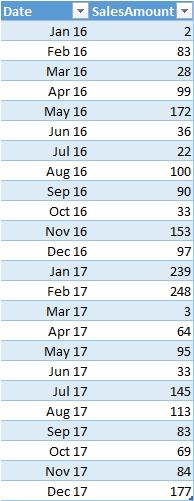
This data table contains the sales amount for a specific date. We want to calculate the sales for the last year and compare it with current year’s data by using SAMEPERIODLASTYEAR function.
The SAMEPERIODLASTYEAR function uses the following syntax to operate:
SAMEPERIODLASTYEAR(<dates>)
- The <dates> parameter refers to a column containing dates.
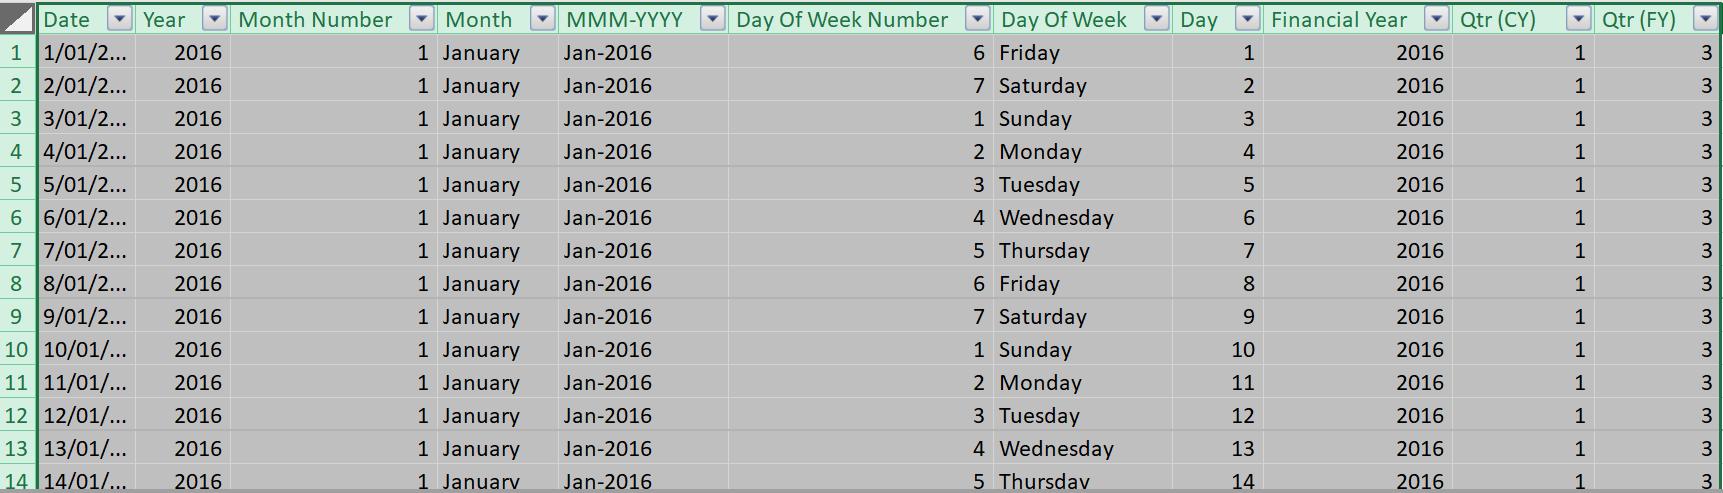
To begin, we create a calendar table as per the steps described in our last blog. The calendar table could be:
Next, in the Diagram View, we link the calendar table to the SalesData table by Date field on a one-to-many basis. The relationship diagram would be:

We create a measure, salesSamePeriodLastYear, as shown below:

In the formula, we use CALCULATE to evaluate the total sales context by defining a filter of time intelligence. The SAMEPERIODLASTYEAR function returns a table with one single column of Date and the result is used as a filter. The result would be:

In the result, it shows that the SAMEPERIODLASTYEAR function returns the same date last year with the filter context in month level. Do note that the dates are all in one column. Many time series functions require dates to be like this (“contiguous”) in order to work as intended.
Next, we create another measure, YOY% Changes, as shown below:

We use the DIVIDE function to calculate the YOY percentage changes and the result would be:

The YOY% Changes column shows the changes from same month last year and provides clear insight on the performance of current periods.
Stay tuned for our next post on Power Pivot in the Blog section. In the meantime, please remember we have training in Power Pivot which you can find out more about here. If you wish to catch up on past articles in the meantime, you can find all of our Past Power Pivot blogs here.