
Power Pivot Principles: Power Pivot Principles : Introducing the HASONEVALUE Function
15 October 2019
Welcome back to the Power Pivot Principles blog. This week, we are going to learn a new function, HASONEVALUE.
The HASONEVALUE function returns TRUE when the context of a specific column has been filtered down to one distinct value only; otherwise, the function returns FALSE. It can verify if the context is being sliced by one value for calculation purposes.
For example, consider that we want to estimate a percentage against a predefined scenario. In this instance, we compare each year’s sales amount against the base year’s sales in FY 2018. We need to confirm if the context is filtered by single years. If not, then the result must return BLANK.
The HASONEVALUE function uses the following syntax to operate:
HASONEVALUE(<columnName>)
- The <columnName> parameter is the name of an existing column, using standard DAX syntax. It cannot be an expression.
In this case, we create a measure, OneValueTest, for the data column of Date, as shown below:

The HASONEVALUE function evaluates the value in the Date column: it will return TRUE if the selected year is unique. If not, the result would be FALSE.
The function can be used for conditional criteria. We create another measure, TotalSales, as shown below:

The sum of sales data is assigned to the variable TotalSales. Then, the HASONEVALUE function is used to determine if the data has been filtered down to one distinct of value. If so, it returns the total sales amount. If not, return BLANK. The result is summarised as follows:
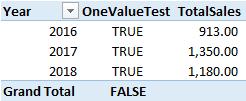
The OneValueTest column returns TRUE for each filtered year and returns FALSE for the Grand Total row, since no distinct value has been selected. Then, the TotalSales column returns the sum of sales for each year. However, it returns nothing for the Grand Total row, since there is no unique value for Date column that may be selected.
Further, we can create another measure, SalesComparison, to compare the sales amount against the threshold in 2018. In this formula, the total sales and 2018 sales are assigned to the variables TotalSales and CYSales respectively. Then, we use the HASONEVALUE function again to determine if the value of Date is unique. If it is, it returns the ratio of TotalSales to CYSales. If not, it will return BLANK:

If we insert a Year slicer and choose the FY 2016, the result would be:
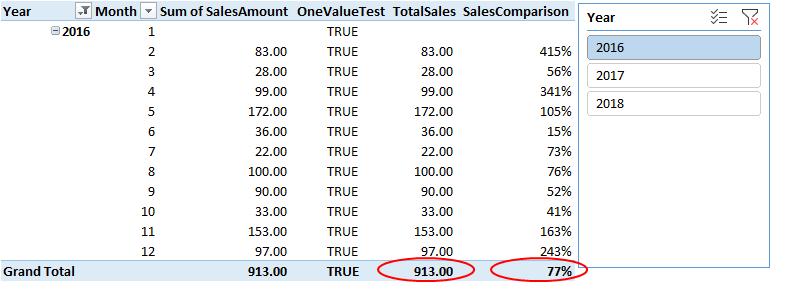
In the Grand Total row, the sales amount of FY 2016 is 77%, compared to the threshold amount of FY 2018. If we choose FY 2016 and FY 2017 in the slicer, the SalesComparison column shows BLANK instead:

That’s it for this week, tune in next week for more Power Pivot / DAX tips.
Stay tuned for our next post on Power Pivot in the Blog section. In the meantime, please remember we have training in Power Pivot which you can find out more about >here. If you wish to catch up on past articles in the meantime, you can find all of our past Power Pivot blogs here.