
Power Pivot Principles: Introducing Measures and Aggregations
17 April 2018
Welcome back to our Power Pivot blog series. Today we talk about measures.
A measure is a calculation that can be created to be used in PivotTable analysis. When measures are created, they sit in the values area of the PivotTable ready to be used in a PivotTable. Unlike creating formulae in Excel, a measure in Power Pivot is saved and can be used time and time again.
Example
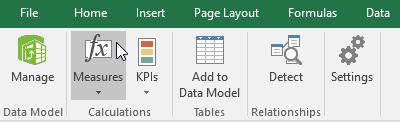
Let’s create a simple measure. Select the ‘Power Pivot’ tab on the Ribbon and then choose the ‘Measures’ option.
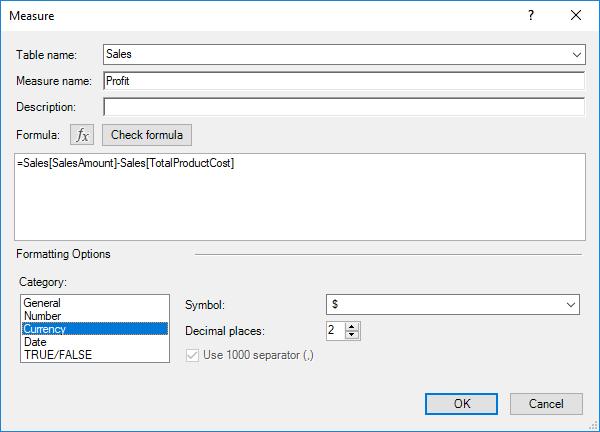
Enter the following inputs into the resulting dialog box:
If we click on ‘Check formula’ Power Pivot will return with this warning message:
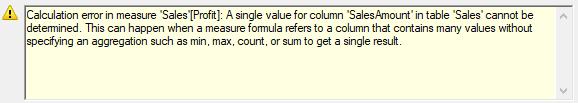
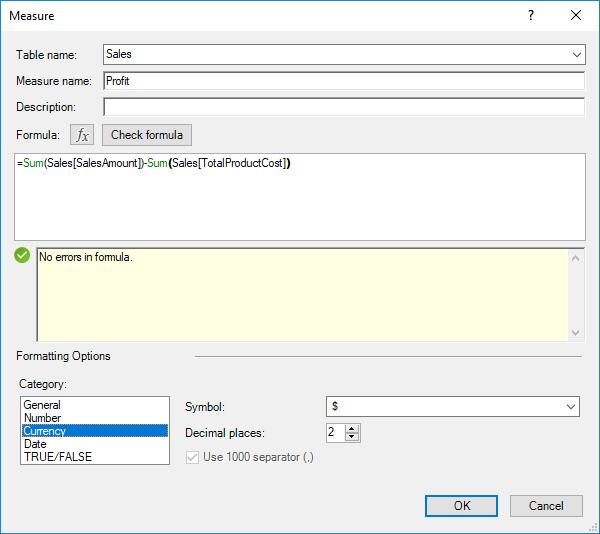
This is because we need to include an aggregation function such as SUM, MAX, MIN, AVERAGE or COUNT. A quick fix would be to include the ‘SUM’ aggregation in front of the fields, which will make Power Pivot happy:
Profit will then appear as the sole field in the ‘Values’ section of the PivotTable.
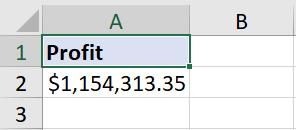
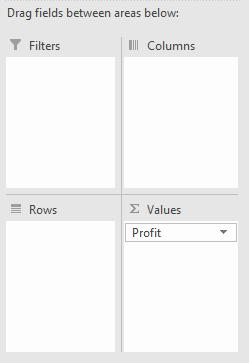
Do you see how the value is simply ‘Profit’ and not ‘Sum of Profit’ which is an annoying irritation in PivotTables? This is another benefit of creating a measure. We can now bring in other fields to complete our PivotTable – but more on that next time!
That’s it for this week. Stay tuned to our blog page for more on Power Pivot. In the meantime, please remember we have training in Power Pivot which you can find out more about here. If you wish to catch up on past articles in the meantime, you can find all of our Past Power Pivot blogs here.