
Power Pivot Principles: Creating Relationships
27 February 2018
Welcome back to our Power Pivot blog series, today we discuss what are relationships (in Power Pivot) and how we may create them.
What is a Relationship in Power Pivot?
A relationship is a connection between two tables of data, based on one or more columns in each table. Why do we need relationships? As discussed in previous blogs, Power Pivot allows you to take multiple sources of data and combine the data tables together into one interrelated database known as a relational database. Once we have imported our tables of data into Power Pivot, you may need to create a relationship between these tables of data (you can read about importing data here). This will enable you to filter data in one table by columns of data from related tables, which will enable a broader analysis of the data. However, it should be noted for tables to connect they must contain columns with matching values.
Let’s run through how to create relationships with two examples. You can download our example data here.
Example 1: Diagram View
The Diagram View provides a visual diagram layout of the data tables which enables us to easily identify relationships between our data. To see this, select the ‘Diagram View’ on the ‘Home’ tab of the Power Pivot window. This will bring up a list of all the tables that are incorporated in the model:
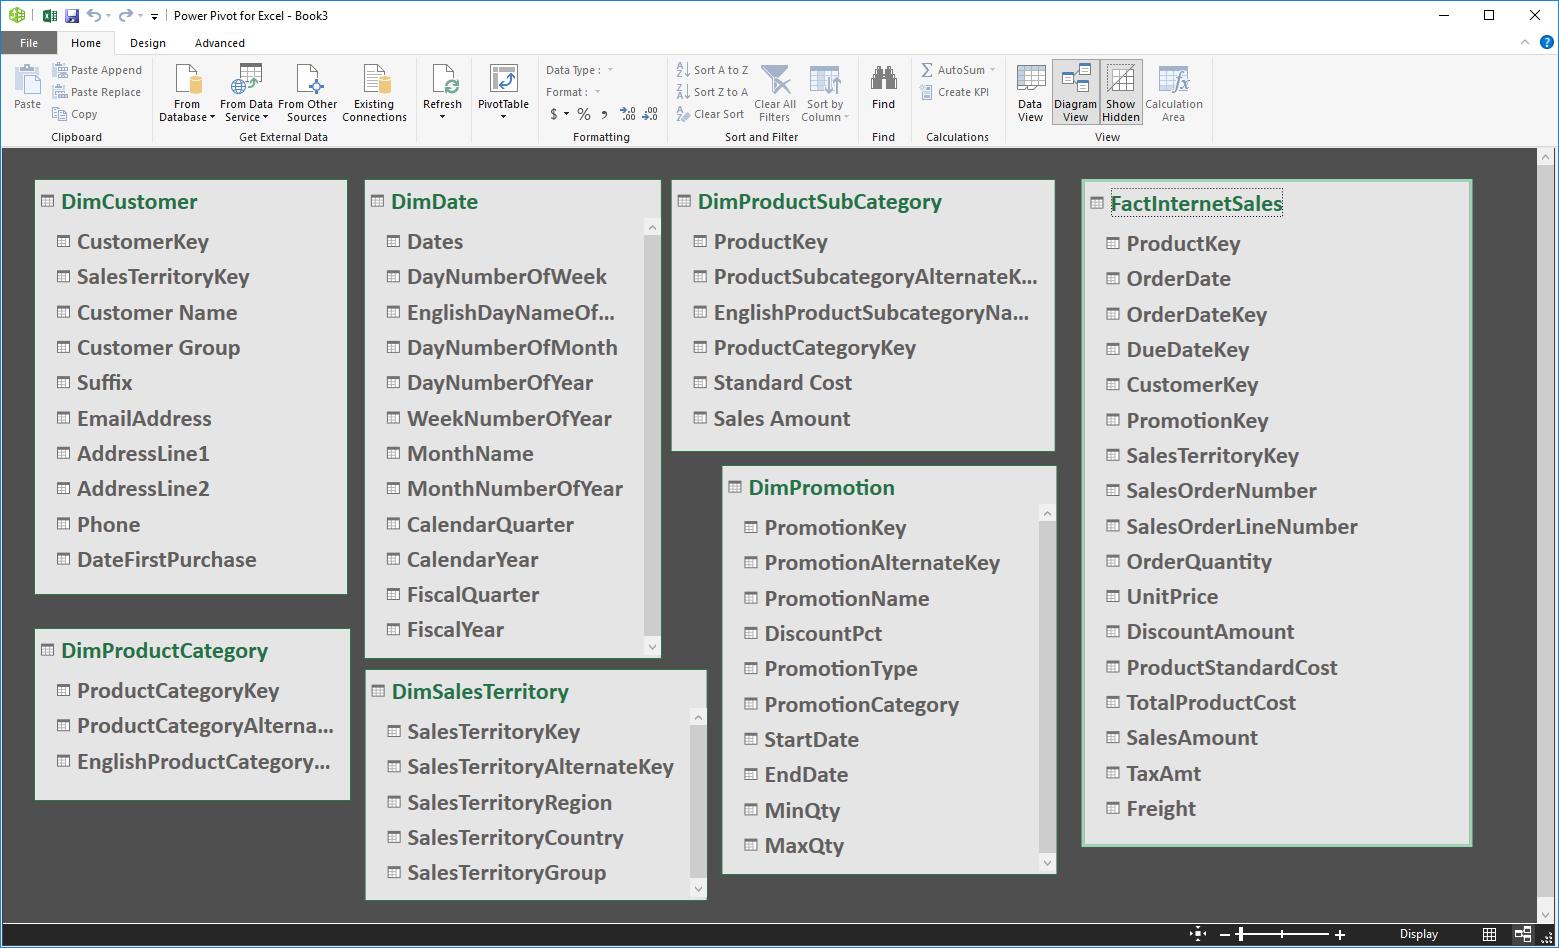
Here, we can see there is an obvious match: ‘Sales Territory Key’ is shown in both the ‘FactInternetSales’ table and the ‘DimSalesTerritory’ table so let’s join these columns together.
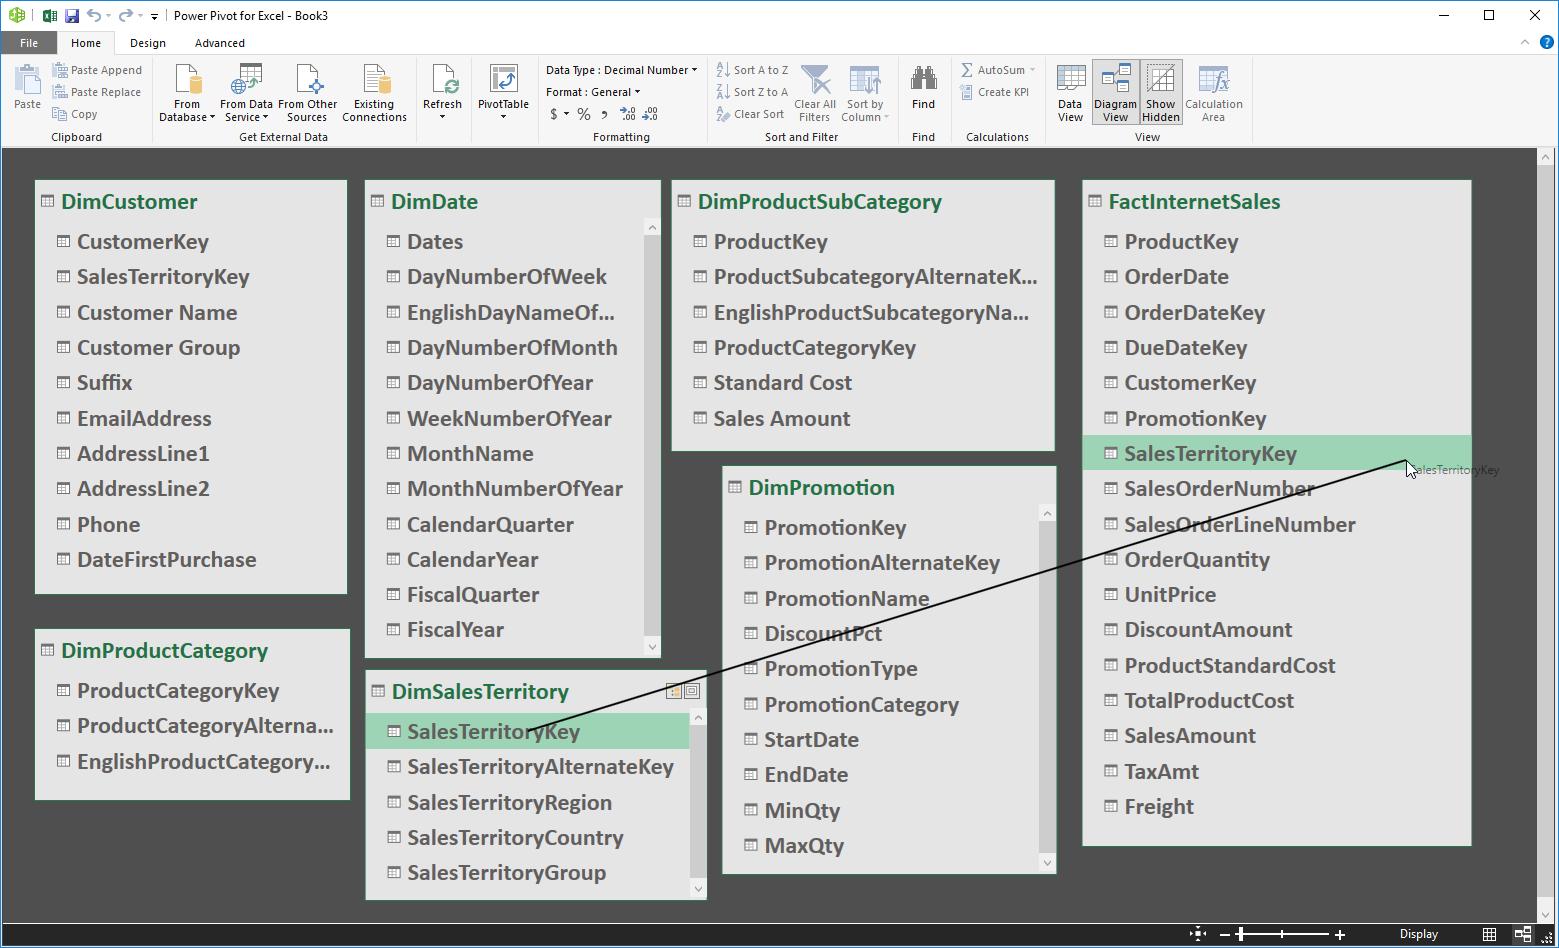
Click on the ‘Sales Territory Key’ in the ‘FactInternetSales’ table and drag it down to the ‘Sales Territory Key’ in the ‘DimSalesTerritory’ table. That was easy (in other software, you have to specify both the direction and the type of linkage, not so here). This will now create a connection between these two tables based on the columns of data that we have selected. Clicking on the line connecting the tables will highlight the columns of data creating the link.
Links are allowed on a “one to one” and “many to one” basis presently in Power Pivot.
Another way to create relationships in Power Pivot is through the ‘Design’ option on the ‘Relationships’ group tab of the Power Pivot window:
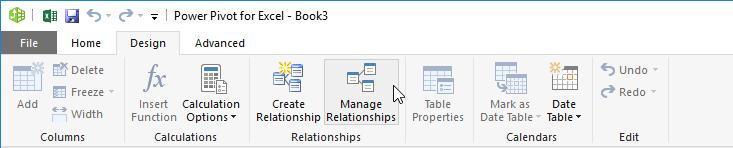
Select ‘Create Relationships’. The following dialog box will appear; showing all of the existing relationships.
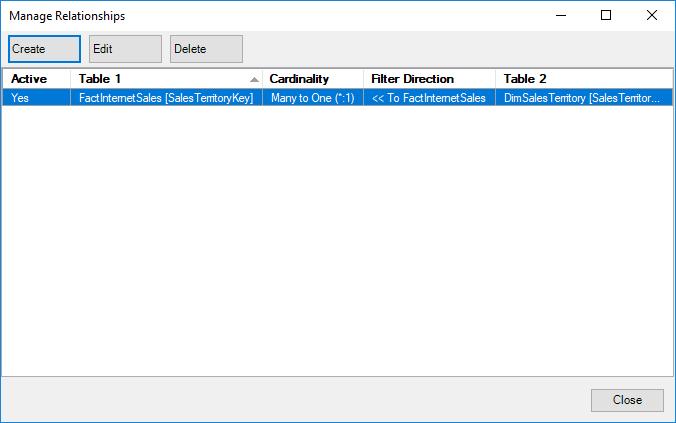
From here we can select ‘Create’ and the ‘Create Relationship’ dialog box will appear.
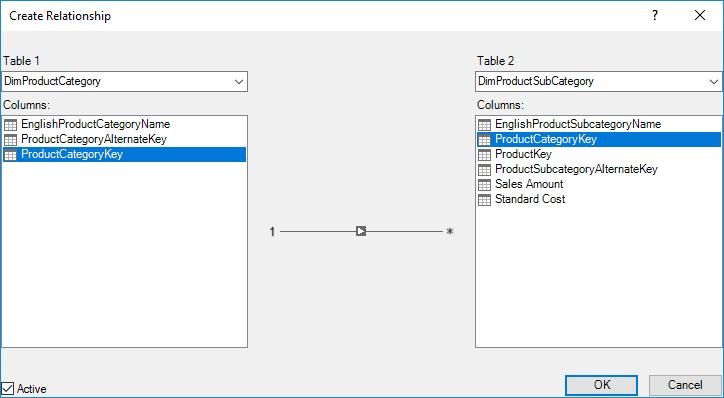
We want to connect the ‘DimProductCategory’ and the ‘DimProductSubCategory’ tables together using the common column ‘ProductCategoryKey’:
- Under the ‘Table 1’ drop-down box, select the table ‘DimProductCategory’
- In the Columns box, select the column ‘ProductCategoryKey’
- Under the ‘Table 2 drop-down box, select the table ‘DimProductSubCategory’
- Under the Columns box, select the table ‘ProductCategoryKey’
- Select ‘OK’ to link these tables together.
We can now go through the rest of the dataset and create relationships between the tables. Have fun practising!
Stay tuned for our next post on Power Pivot. In the meantime, please remember we have training in Power Pivot which you can find out more about here. If you wish to catch up on past articles in the meantime, you can find all of our Past Power Pivot blogs here.