
Power Pivot Principles: The A to Z of DAX Functions – CONFIDENCE.NORM
14 June 2022
In our long-established Power Pivot Principles articles, we continue our series on the A to Z of Data Analysis eXpression (DAX) functions. This week, we look at CONFIDENCE.NORM.
The CONFIDENCE.NORM function
Is CONFIDENCE your NORM? This DAX function returns the confidence interval for a population mean, using the theory associated with the Normal distribution.
To explain: the confidence interval is a range of values around a sample mean, x, which sits at the centre of this range, i.e. the range is x ± CONFIDENCE.NORM. For example, if x is the sample mean of delivery times for products ordered through the mail, x ± CONFIDENCE.NORM is a range of population means.
For any population mean, μ0, in this range, the probability of obtaining a sample mean further from μ0 than x is greater than the significance level required, alpha; for any population mean, μ0, not in this range, the probability of obtaining a sample mean further from μ0 than x is less than this level, alpha. In other words, assume that we use x, a standard deviation standard_dev, and size to construct a two-tailed test at significance level alpha of the hypothesis that the population mean is μ0. Then we will not reject that hypothesis if μ0 is in the confidence interval and will reject that hypothesis if μ0 is not in the confidence interval. The confidence interval does not allow us to infer that there is probability 1 – alpha that our next package will take a delivery time that is in the confidence interval.

The CONFIDENCE.NORM function employs the following syntax to operate:
CONFIDENCE.NORM(alpha, standard_dev, size)
- alpha: this is required. This represents the significance level used to compute the confidence level. The confidence level equals 100*(1 - alpha)%, or in other words, an alpha of 0.05 indicates a 95 percent confidence level
- standard_dev: this is also required. This is the population standard deviation for the data range and is assumed to be known
- size: also required. This is the sample size.
It should be further noted that:
- if any argument is non-numeric, CONFIDENCE.NORM returns the #VALUE! error value
- if alpha is ≤ 0 or ≥ 1, CONFIDENCE.NORM returns the #NUM! error value
- if standard_dev ≤ 0, CONFIDENCE.NORM returns the #NUM! error value
- if size is not an integer, it is truncated
- if size < 1, CONFIDENCE.NORM returns the #NUM! error value
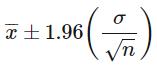
if we assume alpha equals 0.05, we need to calculate the area under the standard normal curve that equals 1 - alpha, or 95%. This value is ± 1.96. The confidence interval is therefore:
- this function is not supported for use in DirectQuery mode when used in calculated columns or row-level security (RLS) rules.
Please see my example below:

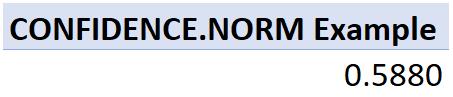
i.e. for an alpha of 5% (or a confidence interval of 95%), with a standard deviation of the population of 3.0 and a sample size of 100 (for a Normal distribution), the confidence interval around the sample mean will be 0.5880.
Come back next week for our next post on Power Pivot in the Blog section. In the meantime, please remember we have training in Power Pivot which you can find out more about here. If you wish to catch up on past articles in the meantime, you can find all of our Past Power Pivot blogs here.