
Power Pivot Principles: The A to Z of DAX Functions – CALCULATE
16 November 2021
In our long-established Power Pivot Principles articles, we continue our series on the A to Z of Data Analysis eXpression (DAX) functions. This week, we look at one of the key functions in DAX: CALCULATE.
This function evaluates an expression in a modified filter context. Think of it as a “turbo charged” SUMIF function. Its syntax is as follows:
CALCULATE(expression [, filter1 [, filter2 [, …]]])
It has several arguments:
- expression: this is required and is the expression to be evaluated
- filter1, etc: these are optional Boolean expressions or table expressions that define filters of filter modifier functions.
The expression used as the first parameter is essentially the same as a measure. Filters may be:
- Boolean filter expressions
- filter modification functions
- table filter expressions.
The last filter, a table expression filter, applies a table object as a filter. It could be a reference to a model table, but more likely it's a function that returns a table object. You can use the FILTER function to apply complex filter conditions, including those that cannot be defined by a Boolean filter expression.
When there are multiple filters, they can be evaluated by using the AND (&&) logical operator, meaning all conditions must be TRUE, or by the OR (||) logical operator, meaning either condition can be TRUE.
In case you were wondering, a Boolean expression filter is an expression that evaluates to either TRUE or FALSE. Furthermore, there are several rules that they must abide by:
- they can reference columns from a single table
- they cannot reference measures
- they cannot use a nested CALCULATE function.
Beginning with the September 2021 release of Power BI Desktop, the following also apply:
- they cannot use functions that scan or return a table unless they are passed as arguments to aggregation functions
- however, they can contain an aggregation function that returns a scalar value, e.g.
Total sales on the last selected date =
CALCULATE (
SUM ( Sales[Sales Amount] ),
'Sales'[OrderDateKey] = MAX ( 'Sales'[OrderDateKey] )
)
Example
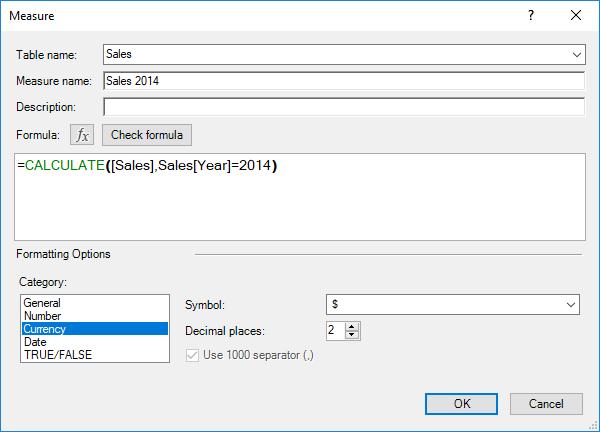
Let’s create a measure that retrieves the sale for the year of 2014:
We can check that our CALCULATE filter is working correctly by creating the following PivotTable:
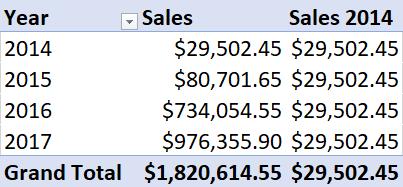
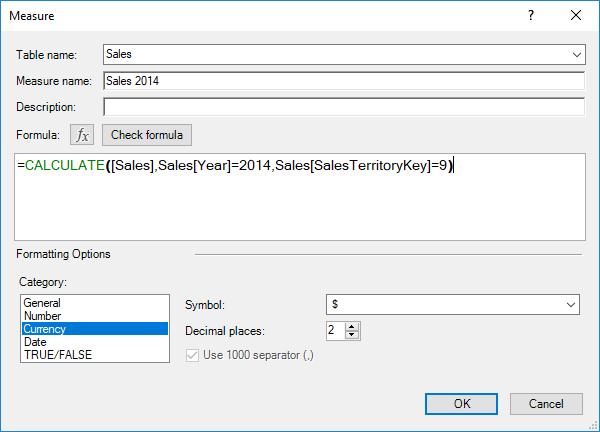
As you can see, no matter what the year in each row of the PivotTable the CALCULATE-based measure always relates to 2014 data. We can also apply multiple filters:
Do note that we are not limited to filter on what is in the PivotTable, we can also filter based upon other fields. It should be noted that applying filters through this method may not be very transparent. Therefore, if you wish to apply multiple filters it is recommended that you use filters (but more on this anon).
Come back next week for our next post on Power Pivot in the Blog section. In the meantime, please remember we have training in Power Pivot which you can find out more about here. If you wish to catch up on past articles in the meantime, you can find all of our Past Power Pivot blogs here.