
Power Pivot Principles: The A to Z of DAX Functions – ADDMISSINGITEMS
27 July 2021
In our long-established Power Pivot Principles articles, we are starting a new series on the A to Z of Data Analysis eXpression (DAX) functions. This week we look to add back missing items…
The ADDMISSINGITEMS function
The ADDMISSINGITEMS function adds rows with empty values to a table returned by the DAX function SUMMARIZECOLUMNS.
The syntax is given by
ADDMISSINGITEMS([showAll_columnName[, showAll_columnName[, … ] ] ], table[, groupBy_columnName[, [filterTable][, groupBy_columnName[, [filterTable] [, … ] ] ] ] ] ] )
Well that looks wonderful! The arguments are as follows:
- showAll_columnName (optional): a column for which to return items with no data for the measures used; if not specified, all columns are returned
- table: a SUMMARIZECOLUMNS table
- groupBy_columnName (optional): a column to group by in the supplied table argument
- filterTable (optional): a table expression that defines which rows are returned.
This will then return a table with one or more columns.
It should be noted that this function is not supported for use in DirectQuery mode when used in calculated columns or row-level security (RLS) rules.
If this all seems a little confusing, it’s perhaps easier to explain with a simple example. Consider the following Sales table in Power BI Desktop:
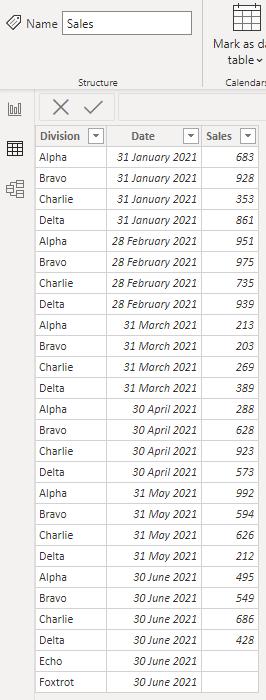
This has monthly sales data for the divisions Alpha, Bravo, Charlie and Delta, with Echo and Foxtrot seemingly added as a bit of an afterthought.
If you wanted to formulaically summarise this table’s sales for each division, this could be performed in DAX using the SUMMARIZECOLUMNS function. To do this, on the ‘Table tools’ tab, click on ‘New table’
and then in the formula bar enter the following formula:
Summarised Table =
SUMMARIZECOLUMNS(Sales[Division],"Total Sales",SUM(Sales[Sales]))
This will create the following table called Summarised Table:
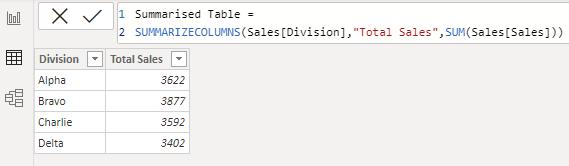
Note that only date for Alpha, Bravo, Charlie and Delta is incorporated because there is no (null) data for Echo or Foxtrot divisions.
If we want to “force” Echo and Bravo’s results onto this SUMMARIZECOLUMNS table, we should add another new table and this time use the following formula:
Full Summarised Table =
ADDMISSINGITEMS(
Sales[Division],
SUMMARIZECOLUMNS(Sales[Division],"Total Sales",SUM(Sales[Sales])
),
Sales[Division]
)
Here, ADDMISSINGITEMS “wraps” the previously constructed formula. This does exactly what it says on the tin and ADDSMISSINGITEMS, in particular, the additional Division data from the Sales table:
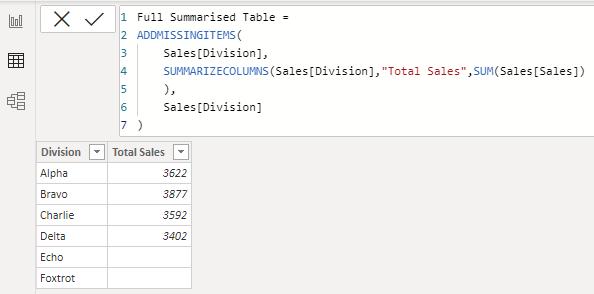
This can be useful when you need to highlight all elements have been considered.
Come back next week for our next post on Power Pivot in the Blog section. In the meantime, please remember we have training in Power Pivot which you can find out more about here. If you wish to catch up on past articles in the meantime, you can find all of our Past Power Pivot blogs here.