
Power Pivot Principles: Sensitivity Analysis
2 March 2021
Welcome back to the Power Pivot Principles blog. This week, we’ll perform a sensitivity analysis for different rates of Goods & Services Tax (GST) on the Sales transactions.
I know I left most of you wondering last week about the use of a disconnected table for GST. I know you might have had a busy week, so let’s refresh your memory with a brief recap of last week’s outcome.
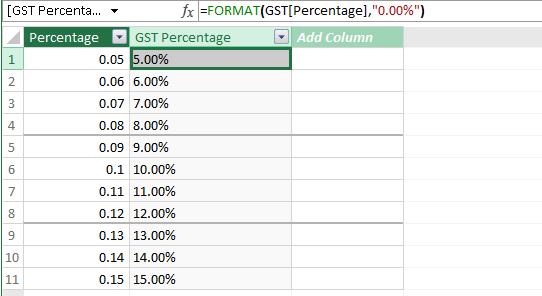
To perform a sensitivity analysis, I start of by creating a measure as shown below:
=MAX(GST[Percentage])
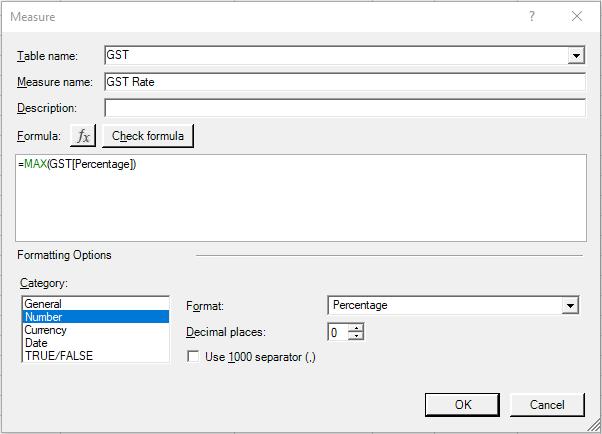
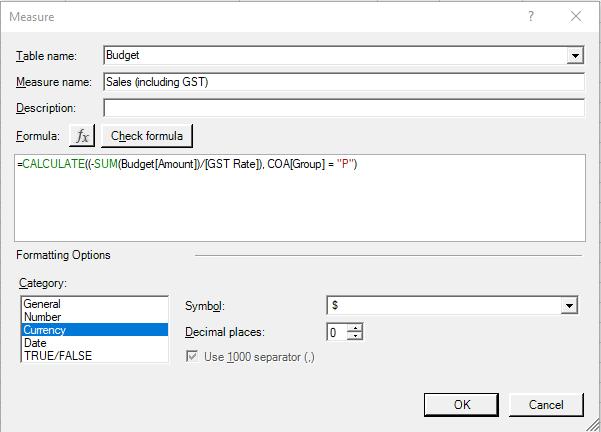
The next step is to create a new Sales (including GST) measure that accommodates for the changes in GST rate:
=CALCULATE((-SUM(Budget[Amount])/[GST Rate]), COA[Group] = "P")
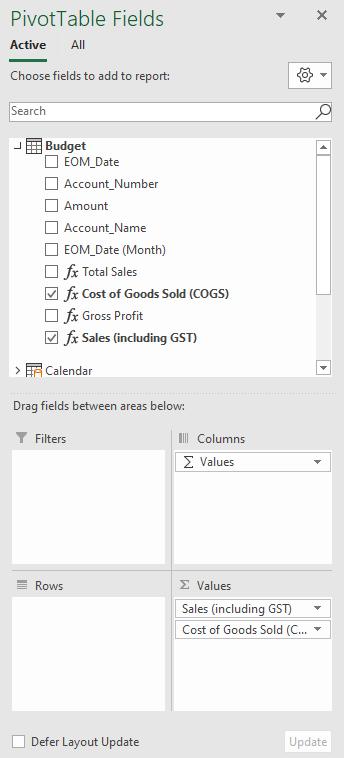
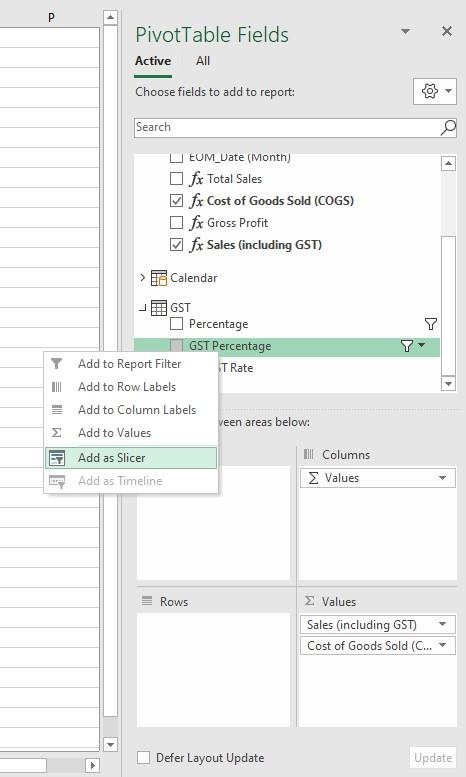
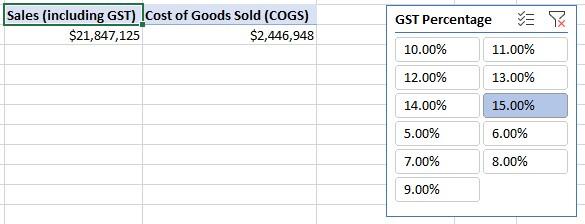
Now, let us include the Sales (including GST) in our Pivot table.
We now add the GST Percentage as a slicer.
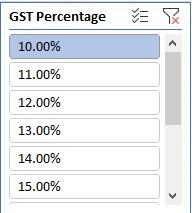
This is what the slicer looks like:
In the Slicer tab on the Ribbon, select two columns to make it look more presentable in a single view:
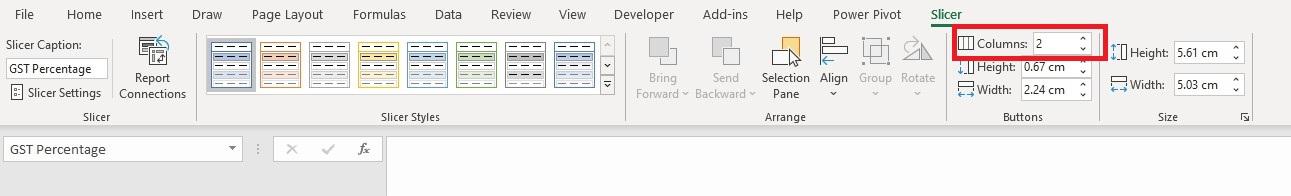
In the Slicer tab on the Ribbon, select two columns to make it look more presentable in a single view:
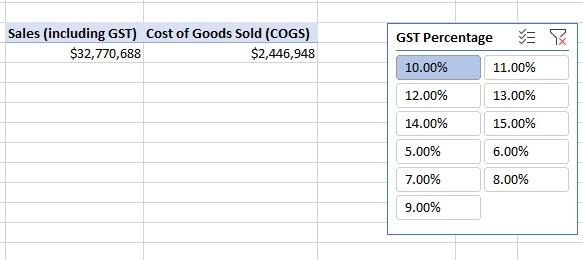
Let’s click on another rate for double checking:
Our sensitivity analysis is now created. That’s it for this week!
Come back next week to see how we use the disconnected table for performing a sensitivity analysis by staying tuned for our next post on Power Pivot in the Blog section. In the meantime, please remember we have training in Power Pivot which you can find out more about here. If you wish to catch up on past articles in the meantime, you can find all of our Past Power Pivot blogs here.