
Power Pivot Principles: PREVIOUSQUARTER Comparison
18 May 2021
Welcome back to the Power Pivot Principles blog. This week, we are going to compare quarterly data using a new Power Pivot function.
If you have read my previous summaries of DATEADD, PARALLELPERIOD, and PREVIOUSMONTH you should be aware that I have been outlining options to look at monthly changes in Sales. This week, I am here to offer you a simple and user-friendly method of performing the quarterly analysis. Ooh, something new…
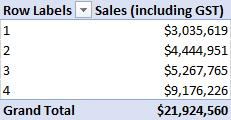
Let’s pull the quarterly Sales data in a table to start the process:
To analyse quarterly performance, I will compare results with the preceding quarter, using the PREVIOUSQUARTER function. The syntax is as follows:
PREVIOUSQUARTER(dates)
I can simply use this and create the following measure:
=CALCULATE([Sales (including GST)],PREVIOUSQUARTER('Calendar'[Date]))

Now, I simply pull this measure into my PivotTable to generate the following results:
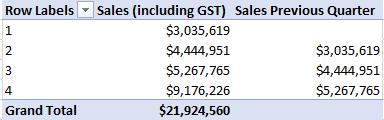
Yes, it really is that simple and similar to PREVIOUSMONTH.
That’s it for this week!
Come back next week to see how we use the disconnected table for performing a sensitivity analysis by staying tuned for our next post on Power Pivot in the Blog section. In the meantime, please remember we have training in Power Pivot which you can find out more about here. If you wish to catch up on past articles in the meantime, you can find all of our Past Power Pivot blogs here.