
Power Pivot Principles: Generating a List of Measure Descriptions
14 December 2021
Welcome back to the Power Pivot Principles blog. This week, we’ll talk about how to generate a list of measure or column descriptions using DMV queries.
Sometimes, you may have a long list of complex measures with some descriptions and want to generate that list to easily refer to when you need. Measure descriptions are not obviously visible as you need to go into each measure’s Edit window or ‘Measure Description’ window within Power Pivot to check.
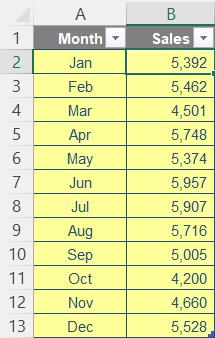
In this example, I randomly created a Sales table for a year as a source to pull into Power Pivot, viz.
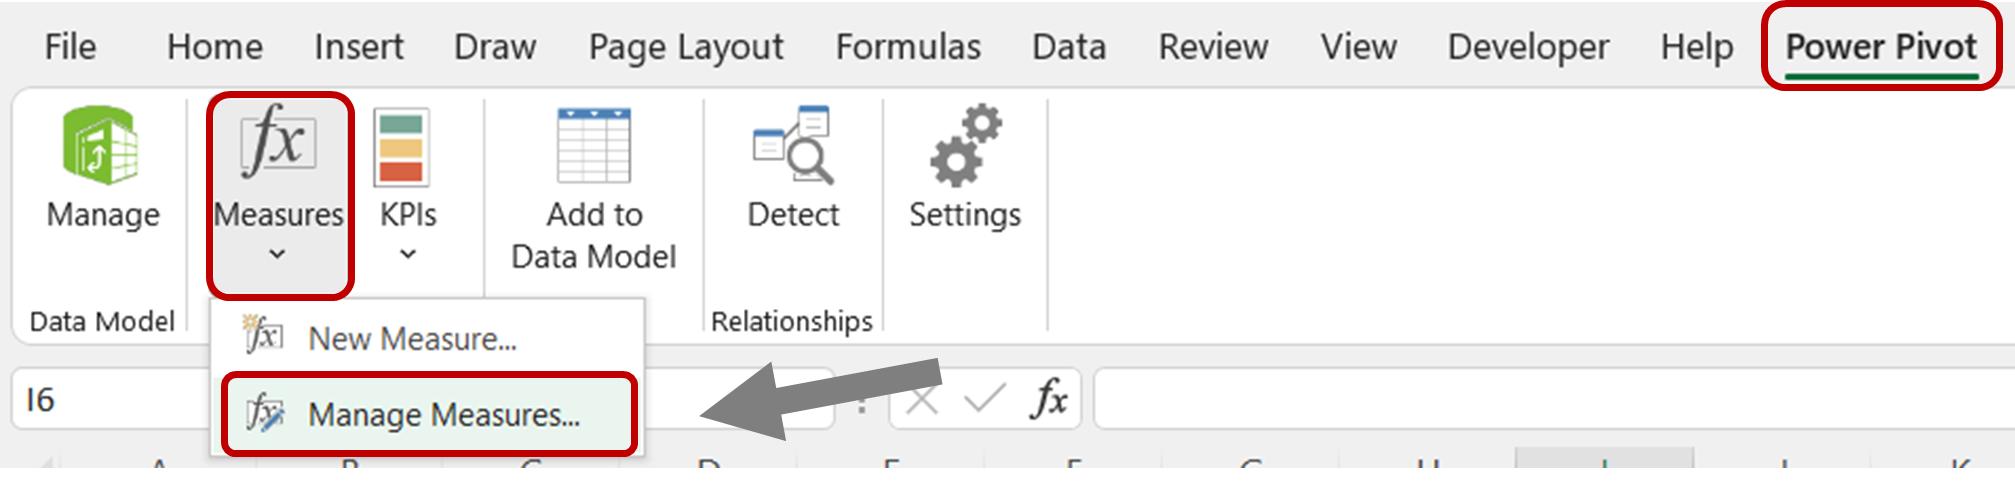
To see a measure description, we need to access the ‘Manage Measures’ window. To do this, go to Power Pivot tab -> Measures -> Manage Measures…
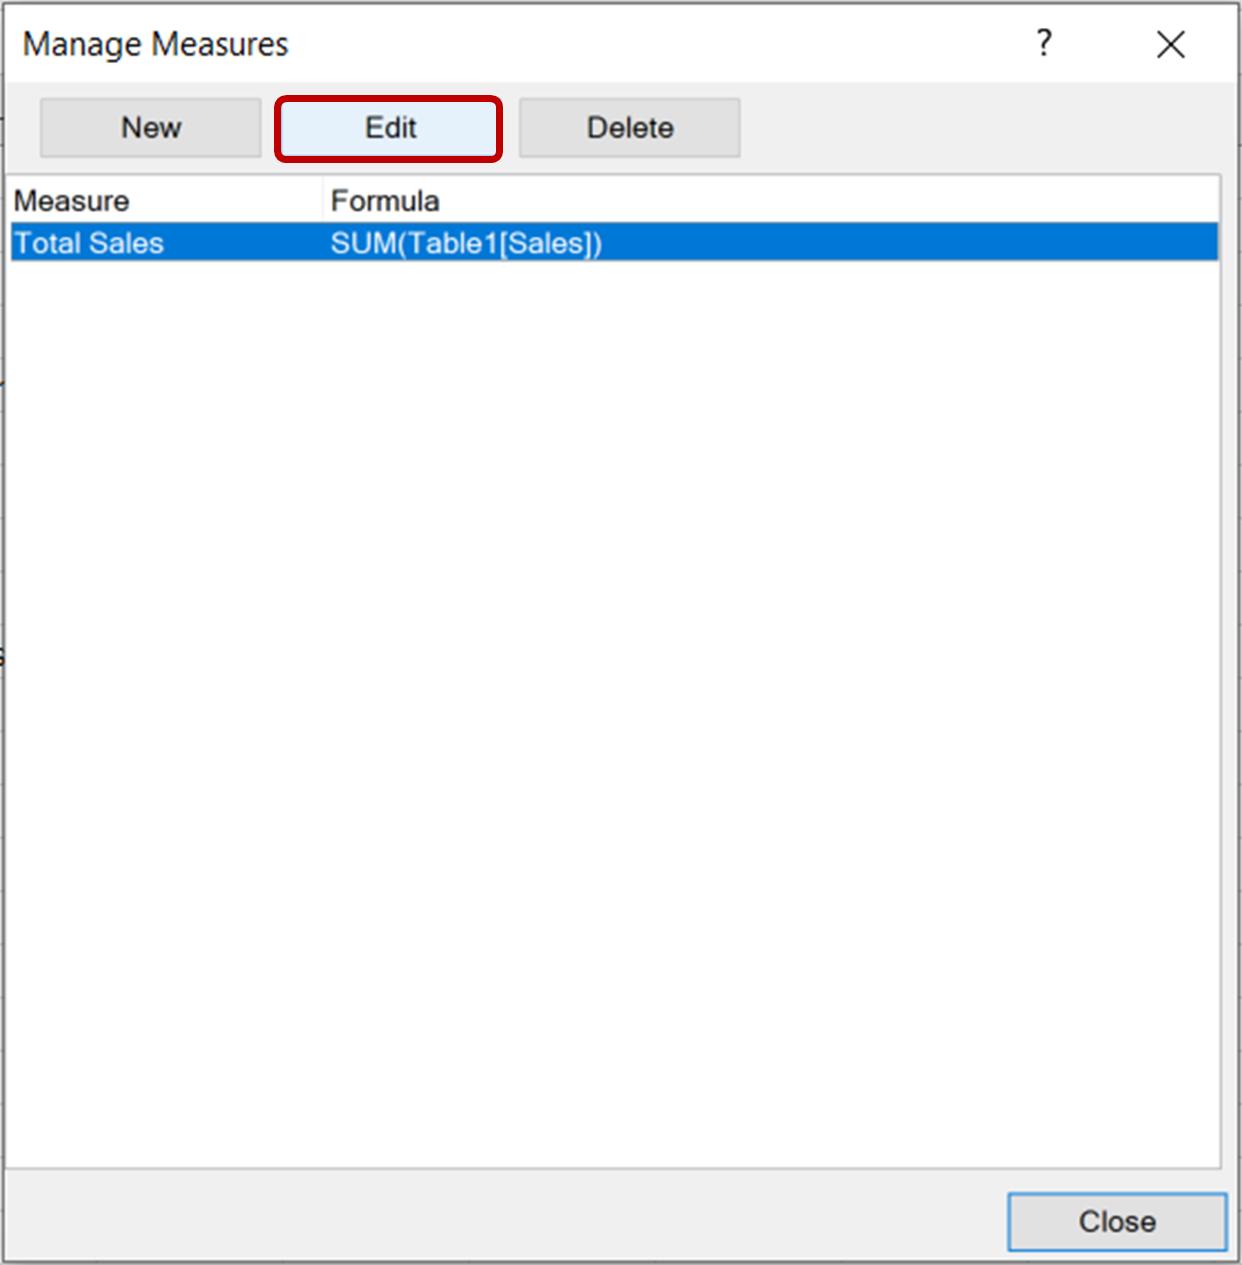
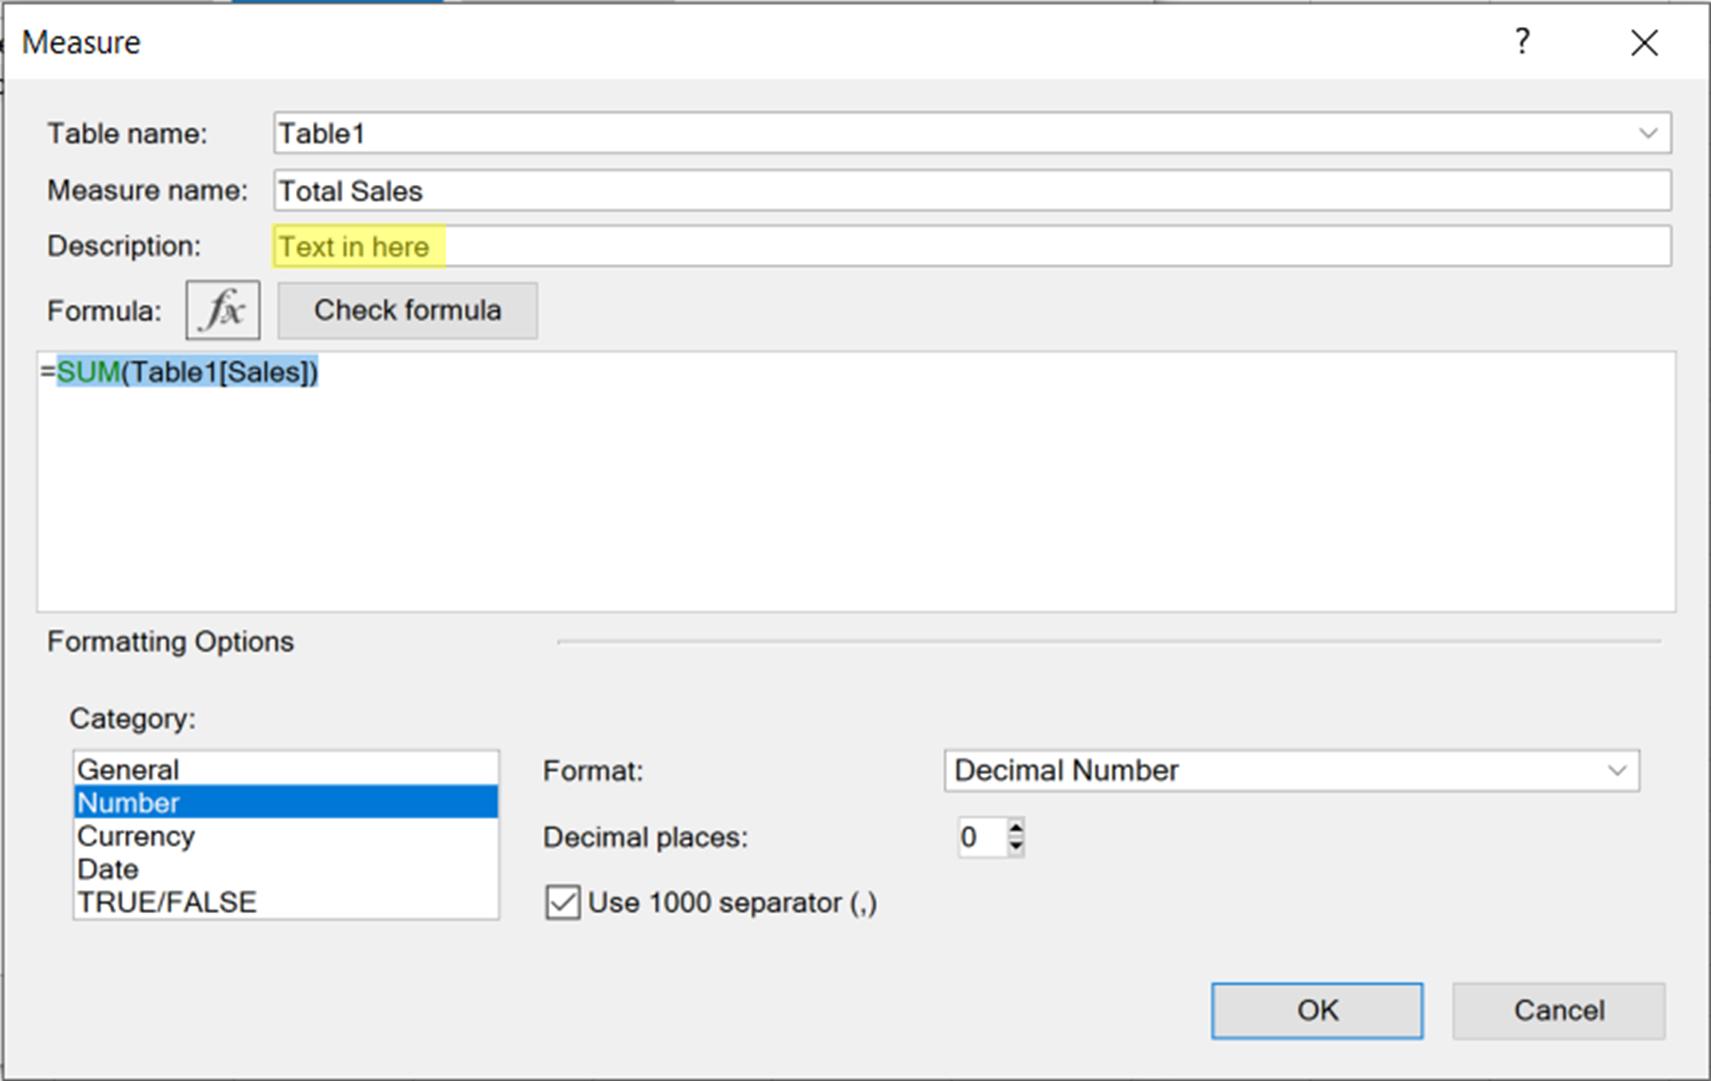
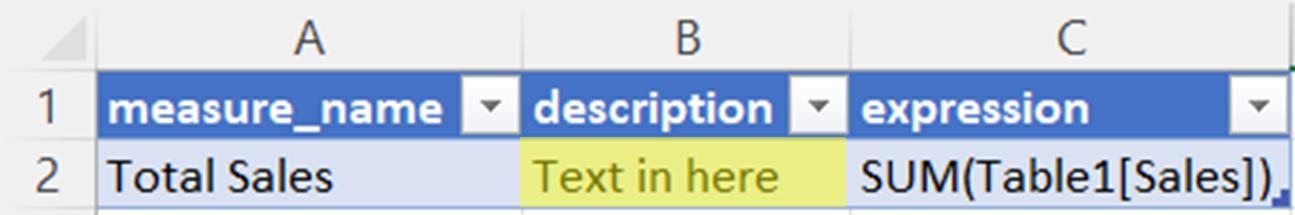
For example, I have a simple measure called Total Sales below. In order to see the description, you need to select it and click Edit.
If you have more than 10 measures, it is very time consuming to click into every single measure to see their descriptions or just simply copy DAX formulae. Instead, we will show you a trick to access the whole list of measure details. This feature is hidden so we need to follow the steps below to trigger it. We assume that you have already had at least a table and a measure in Power Pivot.
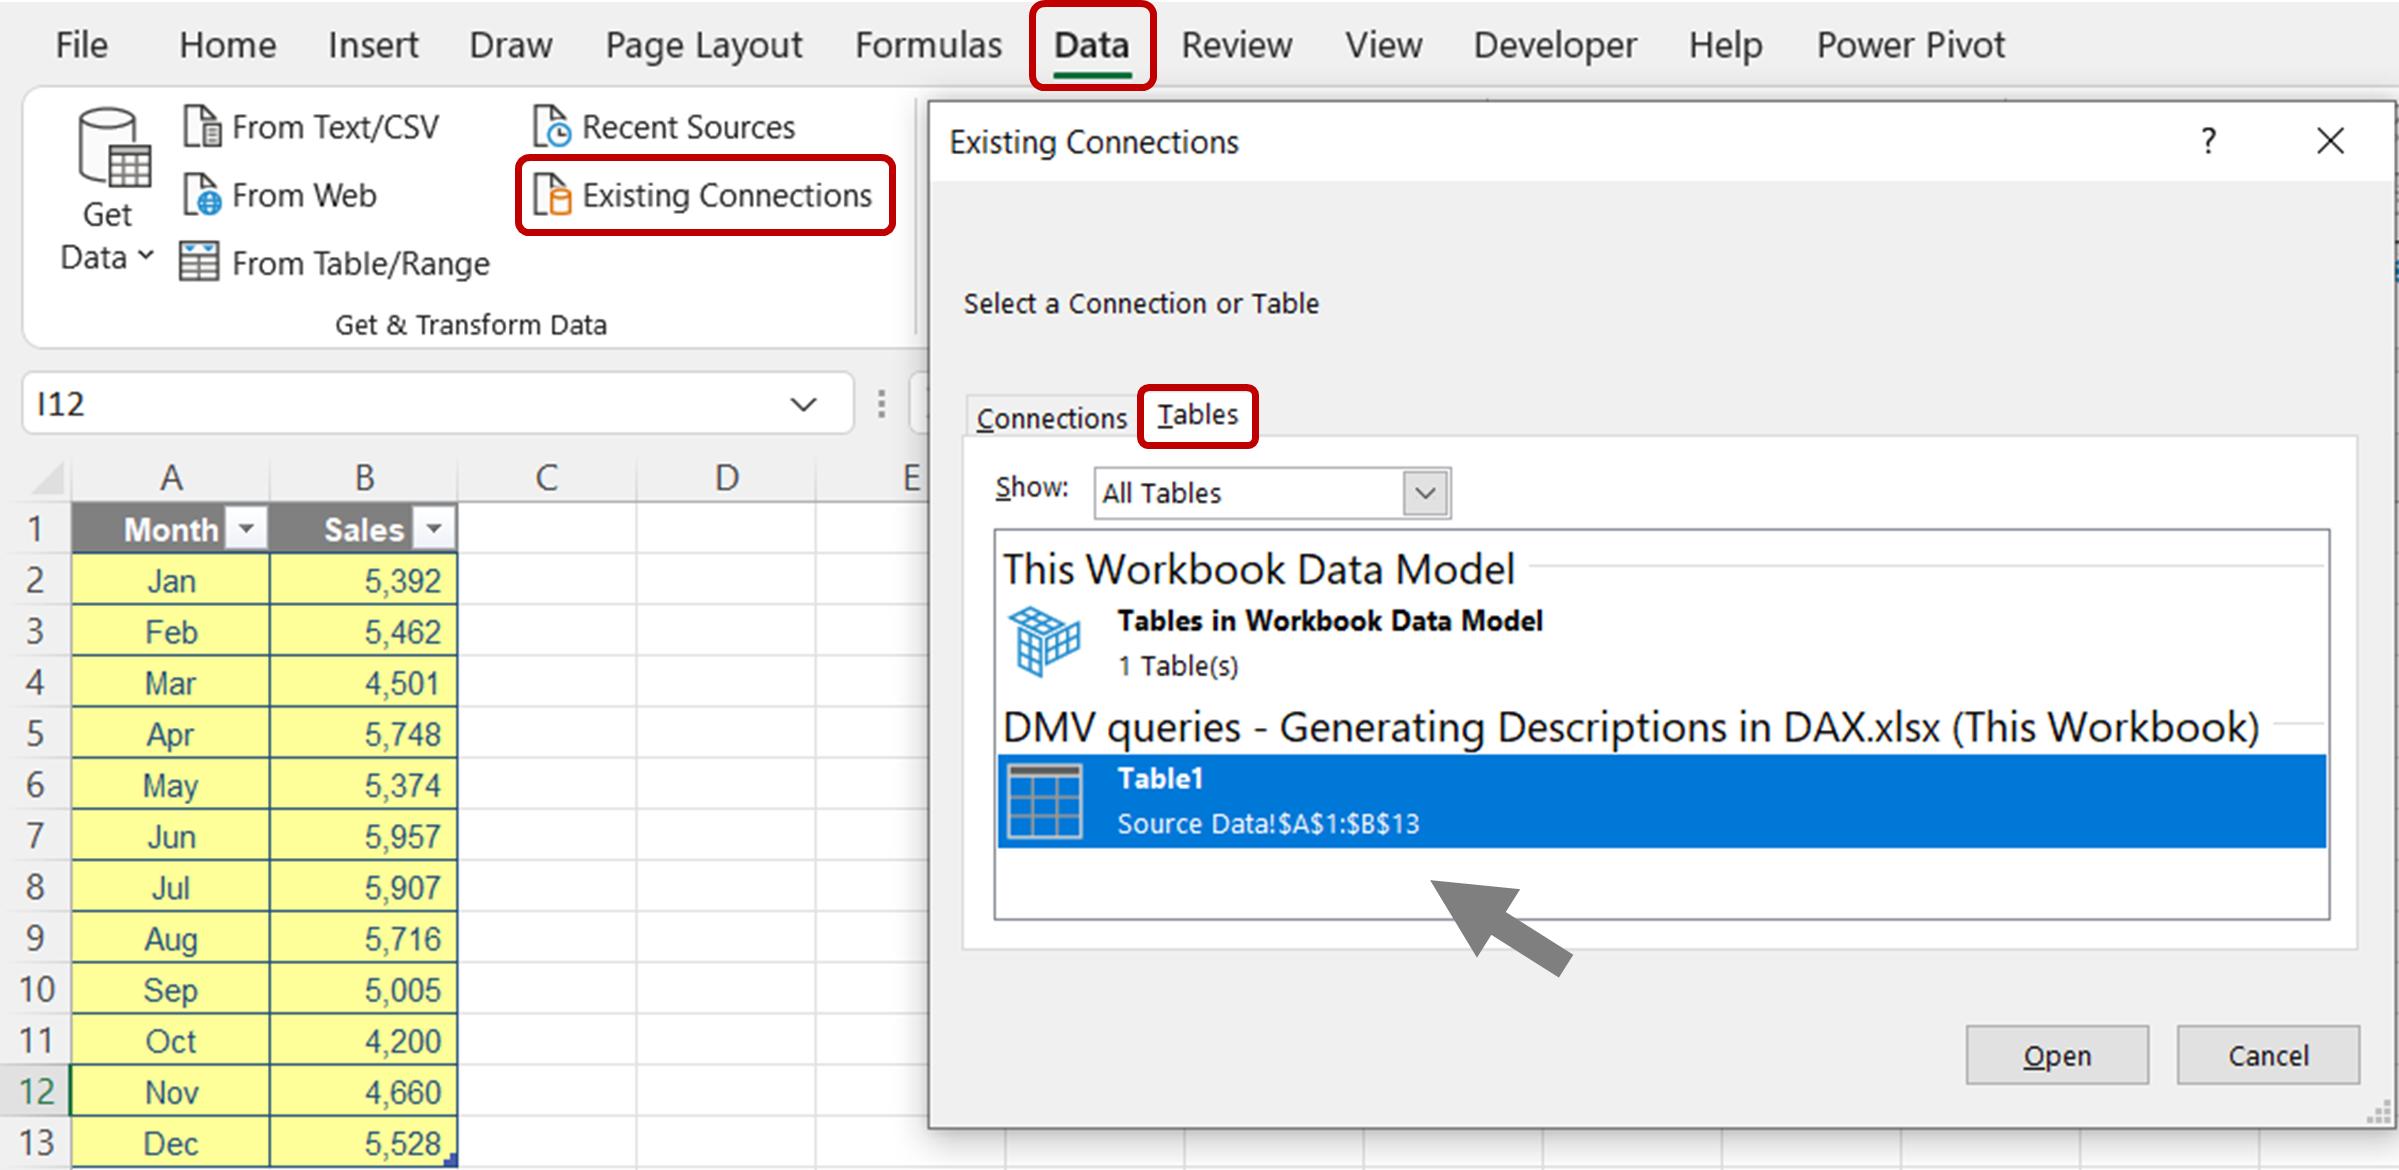
Firstly, go to Data -> Existing Connections -> Tables tab and double-click on one of the tables under your workbook name with a table symbol at the front (not the one with ‘Data Model’ in the name).
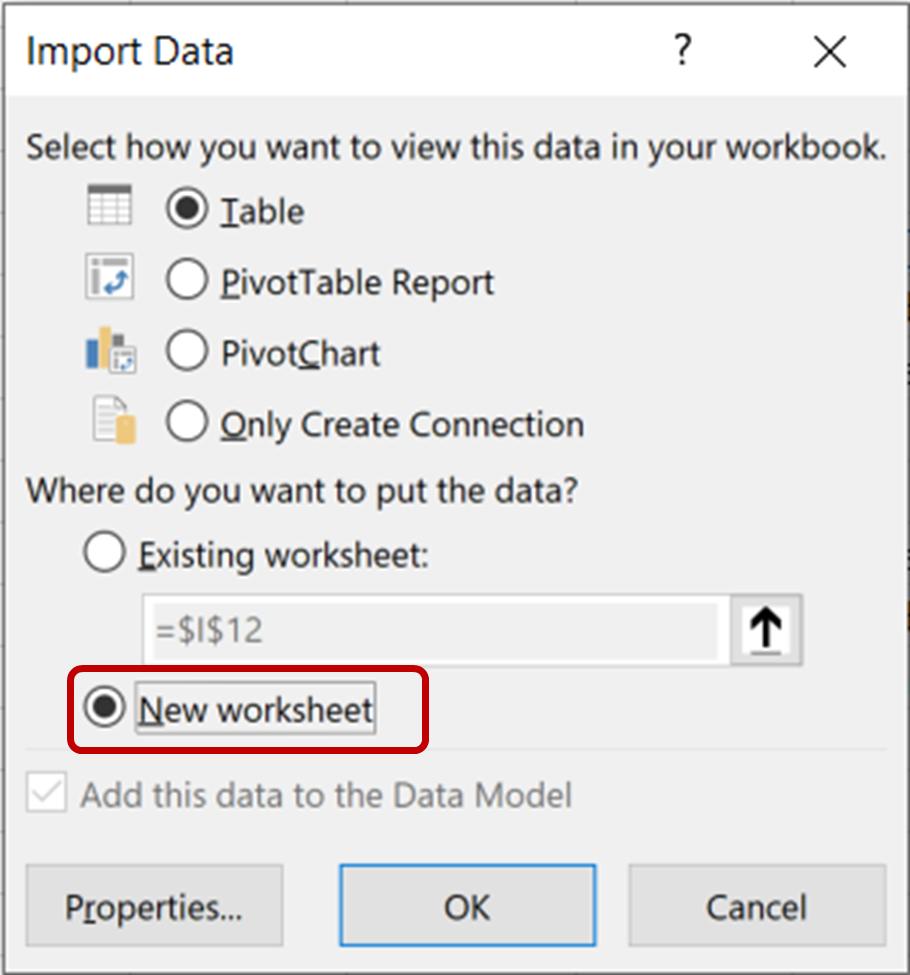
This ‘Import Data’ dialog will appear. Select ‘New worksheet’ and then click ‘OK’.
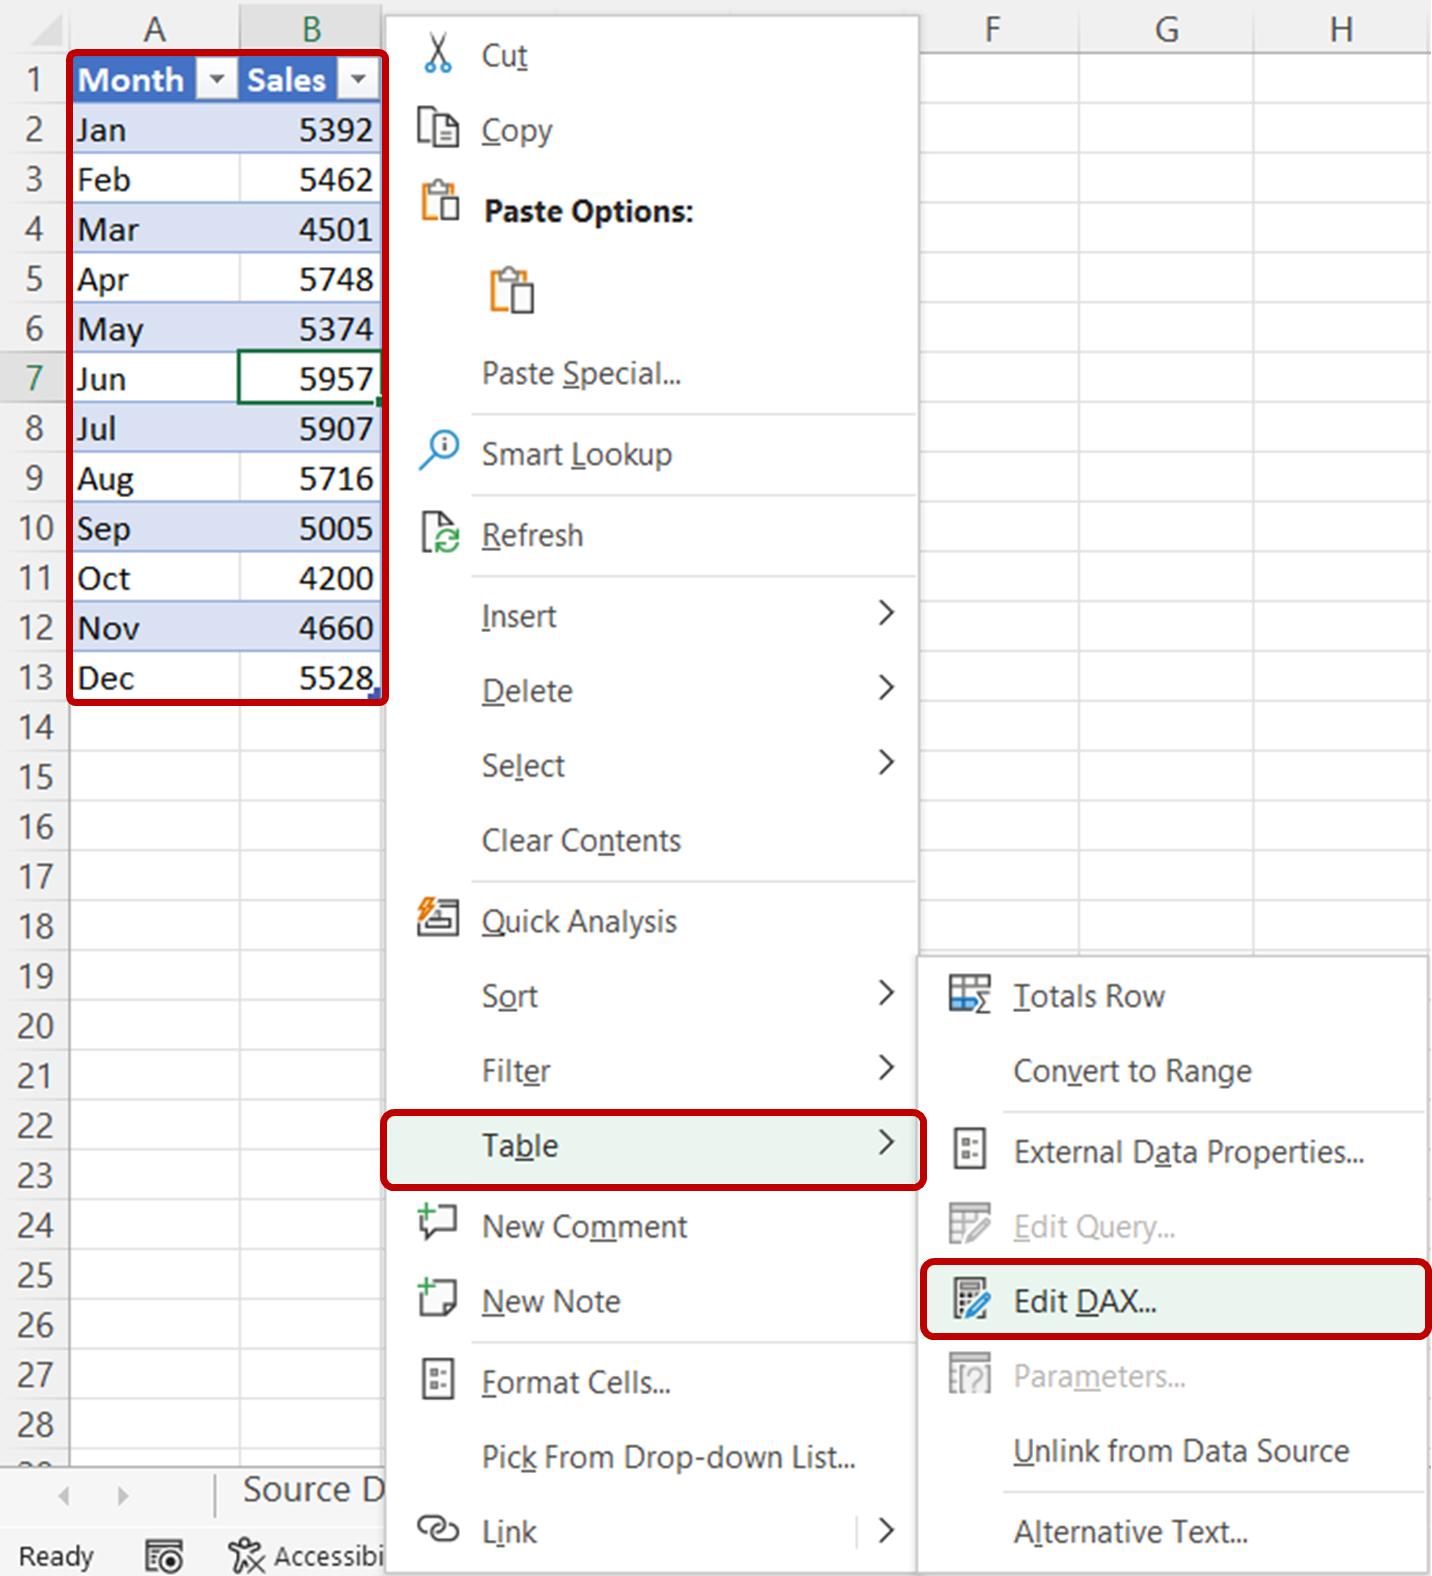
A table from Power Pivot will be put on a new sheet as below. Then, right-click on a cell within the new table and go to Table -> Edit DAX…
The following ‘Edit DAX’ dialog will appear, where you should change ‘Command Type:’ to ‘DAX’.
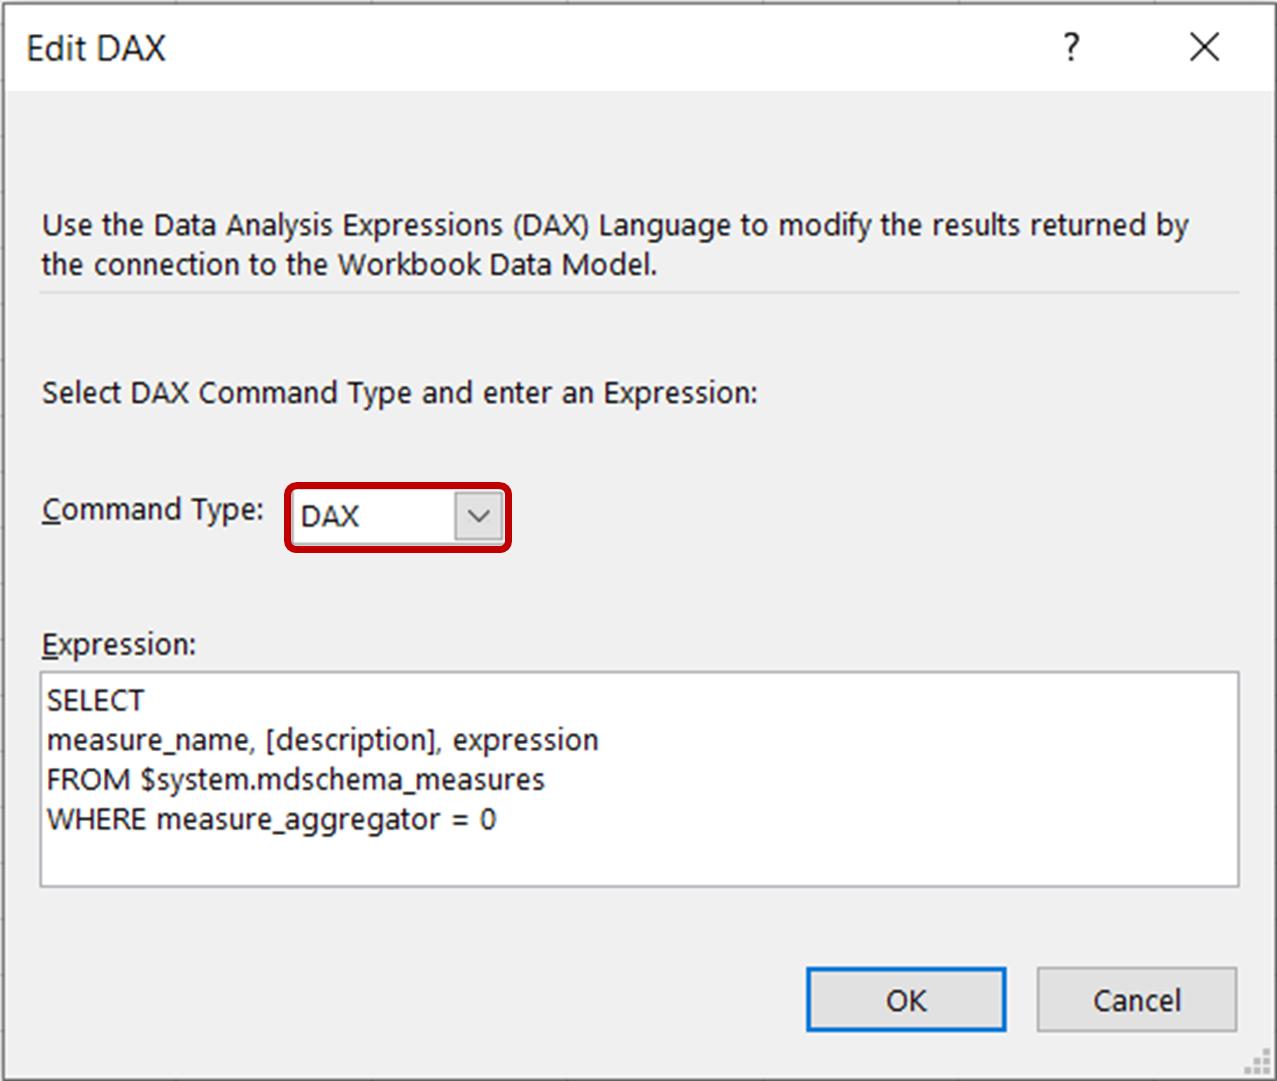
Then, you are able to enter any DMV query into the Expression box to ask it to generate the data that you want. DMV query syntax is similar to a SQL SELECT statement.
So as to generate a list of measure details, please use the query below.
SELECT
measure_name, [description], expression
FROM $system.mdschema_measures
WHERE measure_aggregator = 0
Your new table will change into a measure table as follows. You can now see both measure descriptions and DAX formulas under the same table.
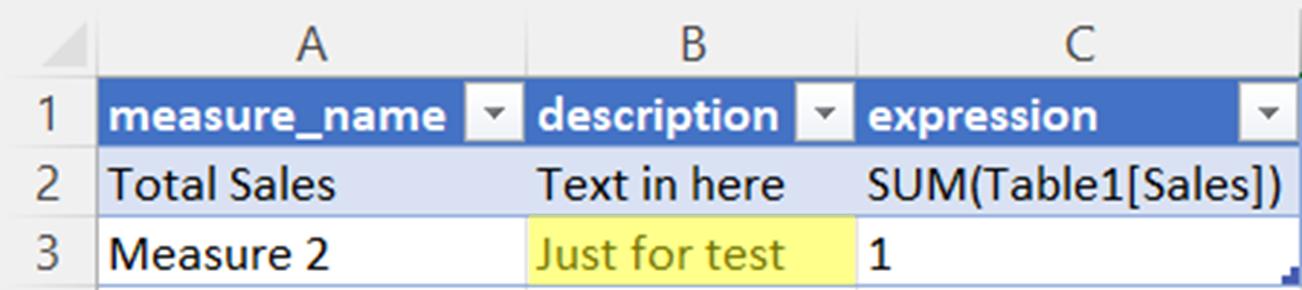
If you create a new measure, the table above will be updated automatically. For example, I created a test measure below.
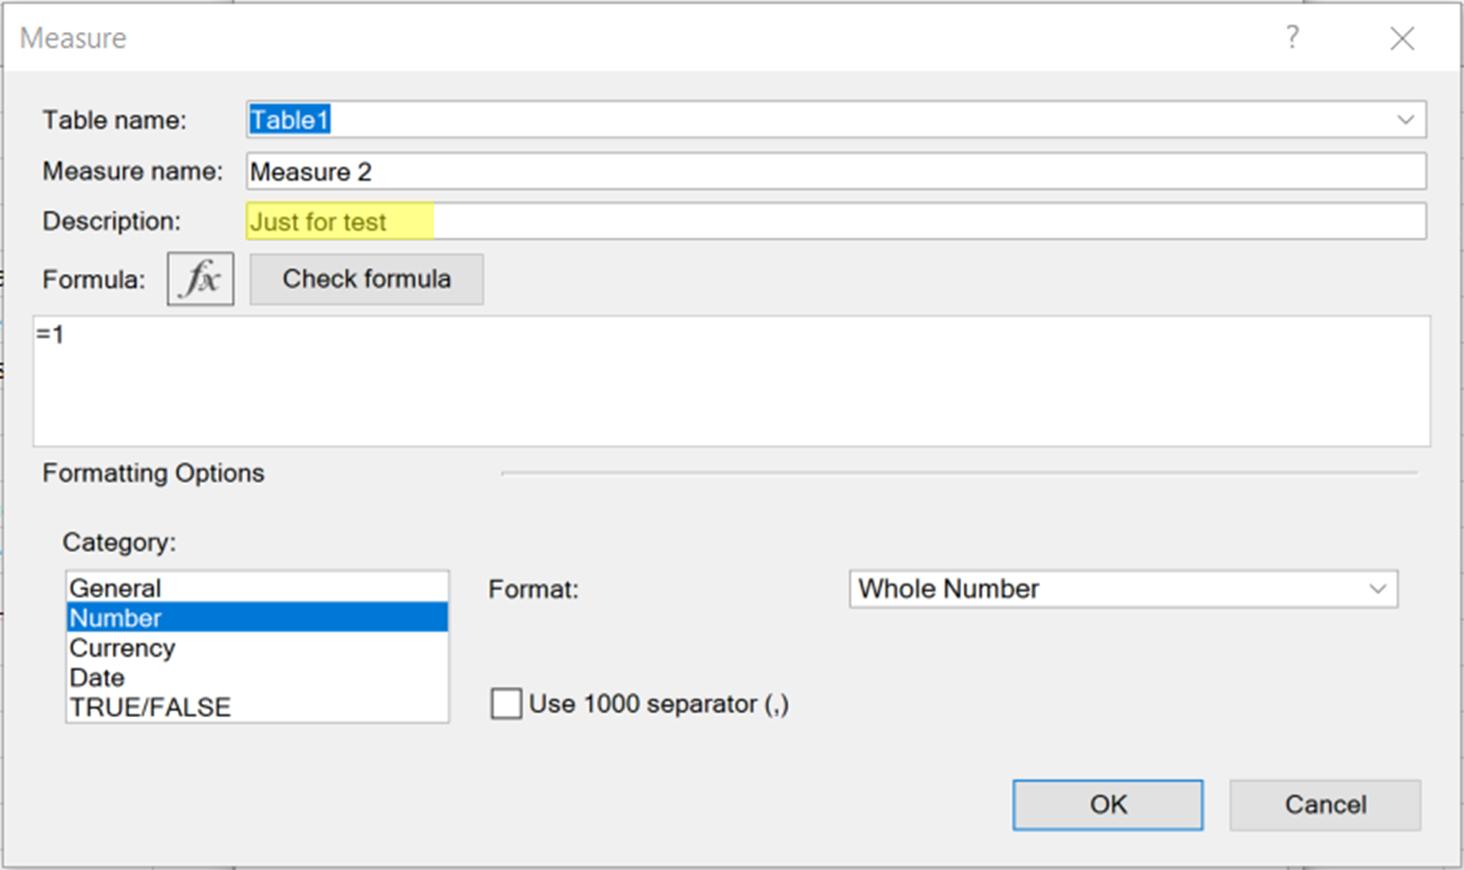
After you click ‘OK’, the measure table will be updated as below.
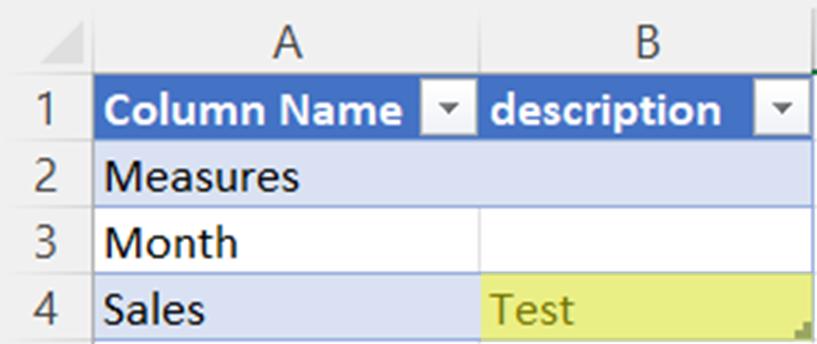
Similar to DAX measures, you can also generate a table including descriptions of all columns in Power Pivot using the DMV query below.
SELECT
hierarchy_name as [Column Name], [description]
FROM $system.mdschema_hierarchies
WHERE cube_name='model'
Come back next week for our next post on Power Pivot in the Blog section. In the meantime, please remember we have training in Power Pivot which you can find out more about here. If you wish to catch up on past articles in the meantime, you can find all of our Past Power Pivot blogs here.