
Power BI Blog: When should we use Power BI and when should we use Excel?
25 January 2018
This is a common question that we’re asked. If we already have Excel for reporting, and it’s currently getting the job done, why should we use Power BI? Or if we want to use Power BI, what processes should we switch over?
Here’s our general view on what the benefits of the two programs are.
- Excel is designed for ad-hoc analysis. The great thing about Excel is that it’s powerful enough to do what you want to do, easy enough to use, and flexible enough to do pretty much whatever you want to do. As a result, we tend to do everything in Excel, and put in place manual processes and ‘hacks’ in order to get our reports to work the exact way we want it to.
- Seems like a familiar, monthly process?
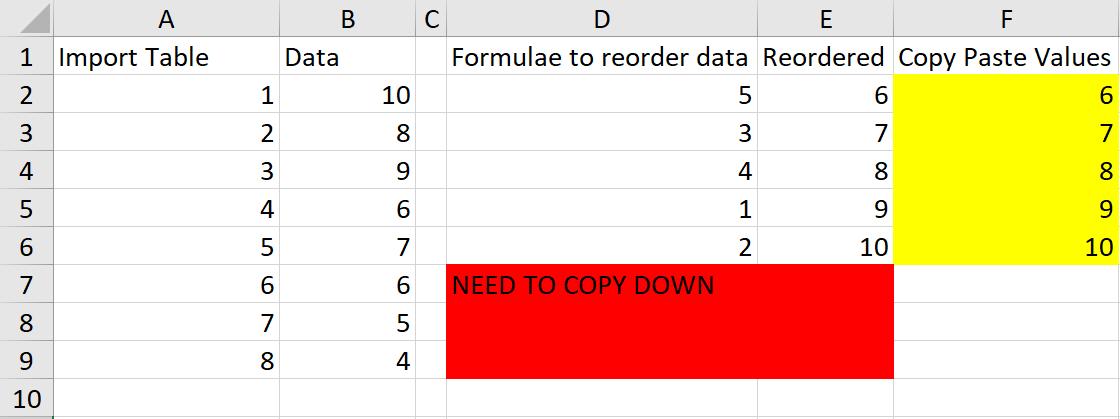
- The problem is that we’ve learned to rely on this flexibility, and end up locking ourselves into doing some steps manually (e.g. copying and pasting, copying formulae down columns / across rows, updating dates, etc.), seeing it as a trade-off against the flexibility we have to perform our reporting tasks that Excel can do. Remember this point – this is going to be important in understanding when we should use Excel.
- Power BI is designed for business-as-usual reporting – quarterly, monthly, daily, real-time, etc.. It doesn’t really let you perform ad-hoc calculations outside of the ‘standard’ reporting tools that you have – you can do it, but it’s a lot more effort than it would take in Excel. However, where it shines is its ability to automate the process of data cleansing and transformation, and set up consistently applied calculations that span across the entire dataset, without the need to manually adjust and tweak the formulae.
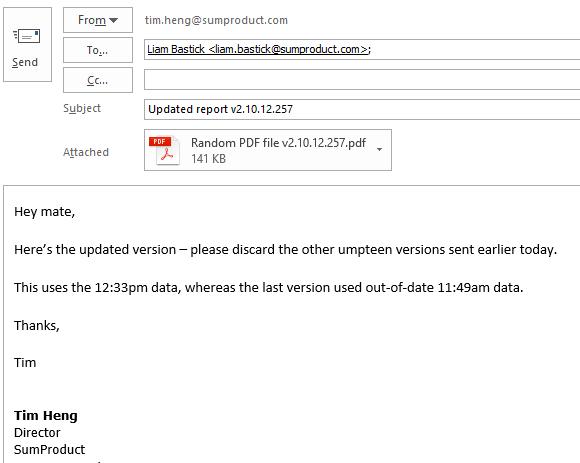
- The other part of Power BI involving the online service also means that to share the results of your reports, you can simply provide access to the live dataset to a colleague, rather than email a file and run the risk of having version control issues.
We see Power BI as being more suitable for regular reporting processes. Once the reports and dashboards have been set up, it’s a case of set-and-forget – the reports will continue to be updated without further input from users. This allows you to reduce the amount of work that is performed on a regular basis, and report consumers can log in and access their reports on demand, without the need for manual intervention. This could even be set up as part of a budgeting process, where each business unit saves their files in a common location to be picked up by a Power BI consolidation report.
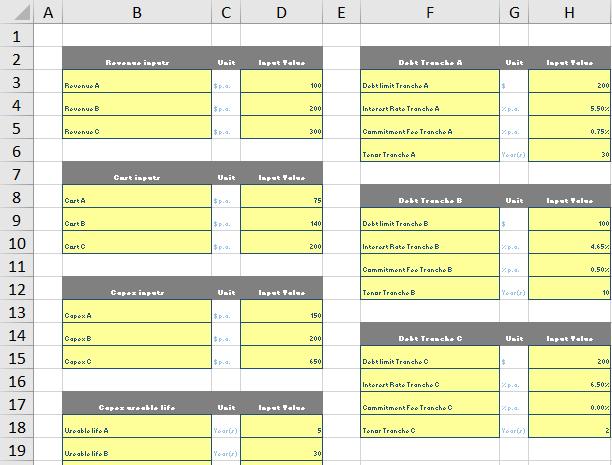
On the flip side, where calculations need to be constantly tweaked, it’s generally faster to make the change in Excel and to see the consequences of those changes. It also allows you to customise your calculations to that they only apply to certain rows or columns (not that we would endorse the use of multiple formulae per column, only that you can!). Finally, it gives you more flexibility to highlight and flag to users which cells and tables might be work in progress, finalised, or any other form of status that might be meaningful to your business. For transaction / financial modelling work, due to the ever-changing nature of a deal, it’s most likely better to perform this sort of work in Excel.
So, if your process is locked down and calculations aren’t open to change, Power BI is perfect to reduce the time spent in making manual adjustments and sending out reports. However, for ad-hoc analysis and calculations that are still in a state of flux, Excel will give you the flexibility you need.
P.S. There’s one exception to the above rule, and that is, if you’re using earlier / other versions of Excel that don’t have access to the features in Power BI. For example, it’s a bit harder to get Power Pivot in Excel – you need to have the right version of Office. It’s much harder to build a waterfall chart in Excel 2013 or earlier, whereas it’s a built-in visual in both Excel 2016 and Power BI. So if you’re trying to achieve things that you can’t do in Excel but can do in Power BI… well, it’s a no-brainer then, isn’t it?