
Power BI Blog: Recent Improvements to the Power BI Experience in Excel
21 July 2022
Welcome back to this week’s edition of the Power BI blog series. This week, we look at recent improvement in the Power BI experience.
This month (July) saw several improvements to the Power BI experience in Excel that will help many easily search data artifacts (including Power BI datasets and Power BI datamarts) and uncover better data insights all inside a spreadsheet environment. These improvements are rolling out to users in phases and should have been completed before you read this!
With these new changes to the Power BI experience in Excel, you may:
- more easily search for data in a new user-friendly interface
- discover new data artifacts with a deep link to the Power BI Data hub where you can find recommended datasets and other trusted data in your organisation
- derive additional insights from your data with direct links to Power BI reports from inside Excel.
Power BI has become a common central data repository for many organisations and now you can access all that data right inside Excel.
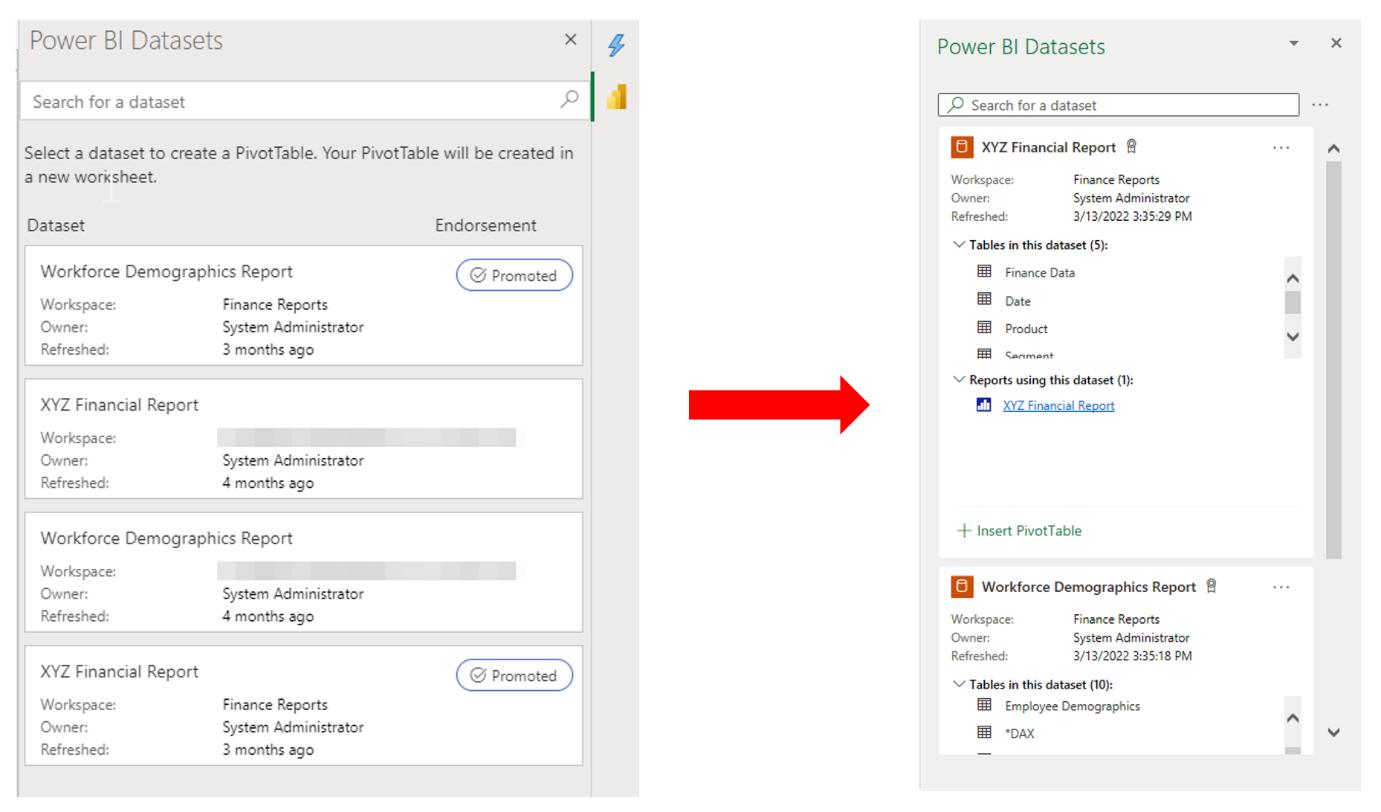
The new Power BI User Interface (UI) in Excel strives to be an improvement from the prior interface. Now it is easier for you to discover the right Power BI data for your analysis in Excel. Also, it now shows the names of the tables contained in a particular dataset so you may better understand your data.
You can easily search for data using any of the following parameters:
- Dataset name
- Dataset Owner
- Workspace Name.
Any search will return an exact (or near exact match) for the dataset(s) you are looking for. For example, if the dataset you are looking for is owned by system administrator and you search using that term, all datasets that you have access to that are owned by system administrator will be returned.
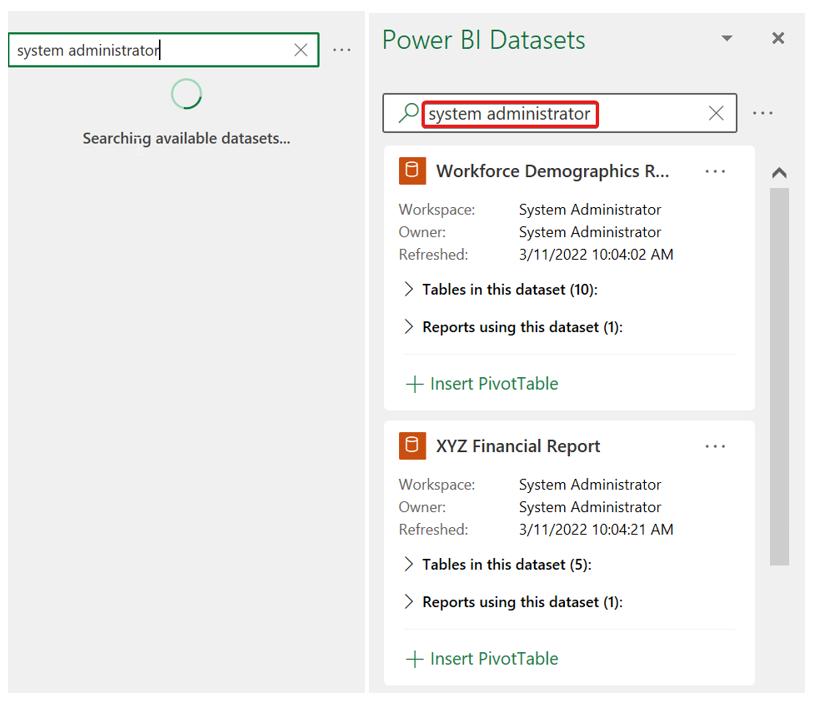
The ‘Refreshed’ field shows you the exact timestamp for the day and time when the data was last updated so you know you are working with the most up-to-date data.
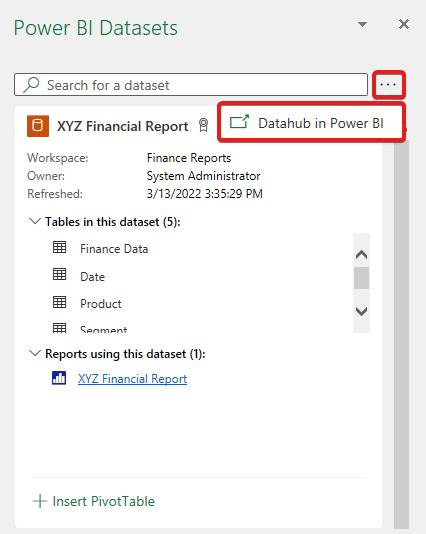
Furthermore, in the Power BI datasets pane in Excel, you can now navigate to the Data hub in the Power BI Service where you can view all Power BI datasets and other data artifacts you have access to. To navigate to the Power BI data hub from Excel, select the ellipsis (…) beside the search bar in the Power BI datasets pane and click ‘Datahub in Power BI’. A new browser window will open that then takes you to the Power BI Service.
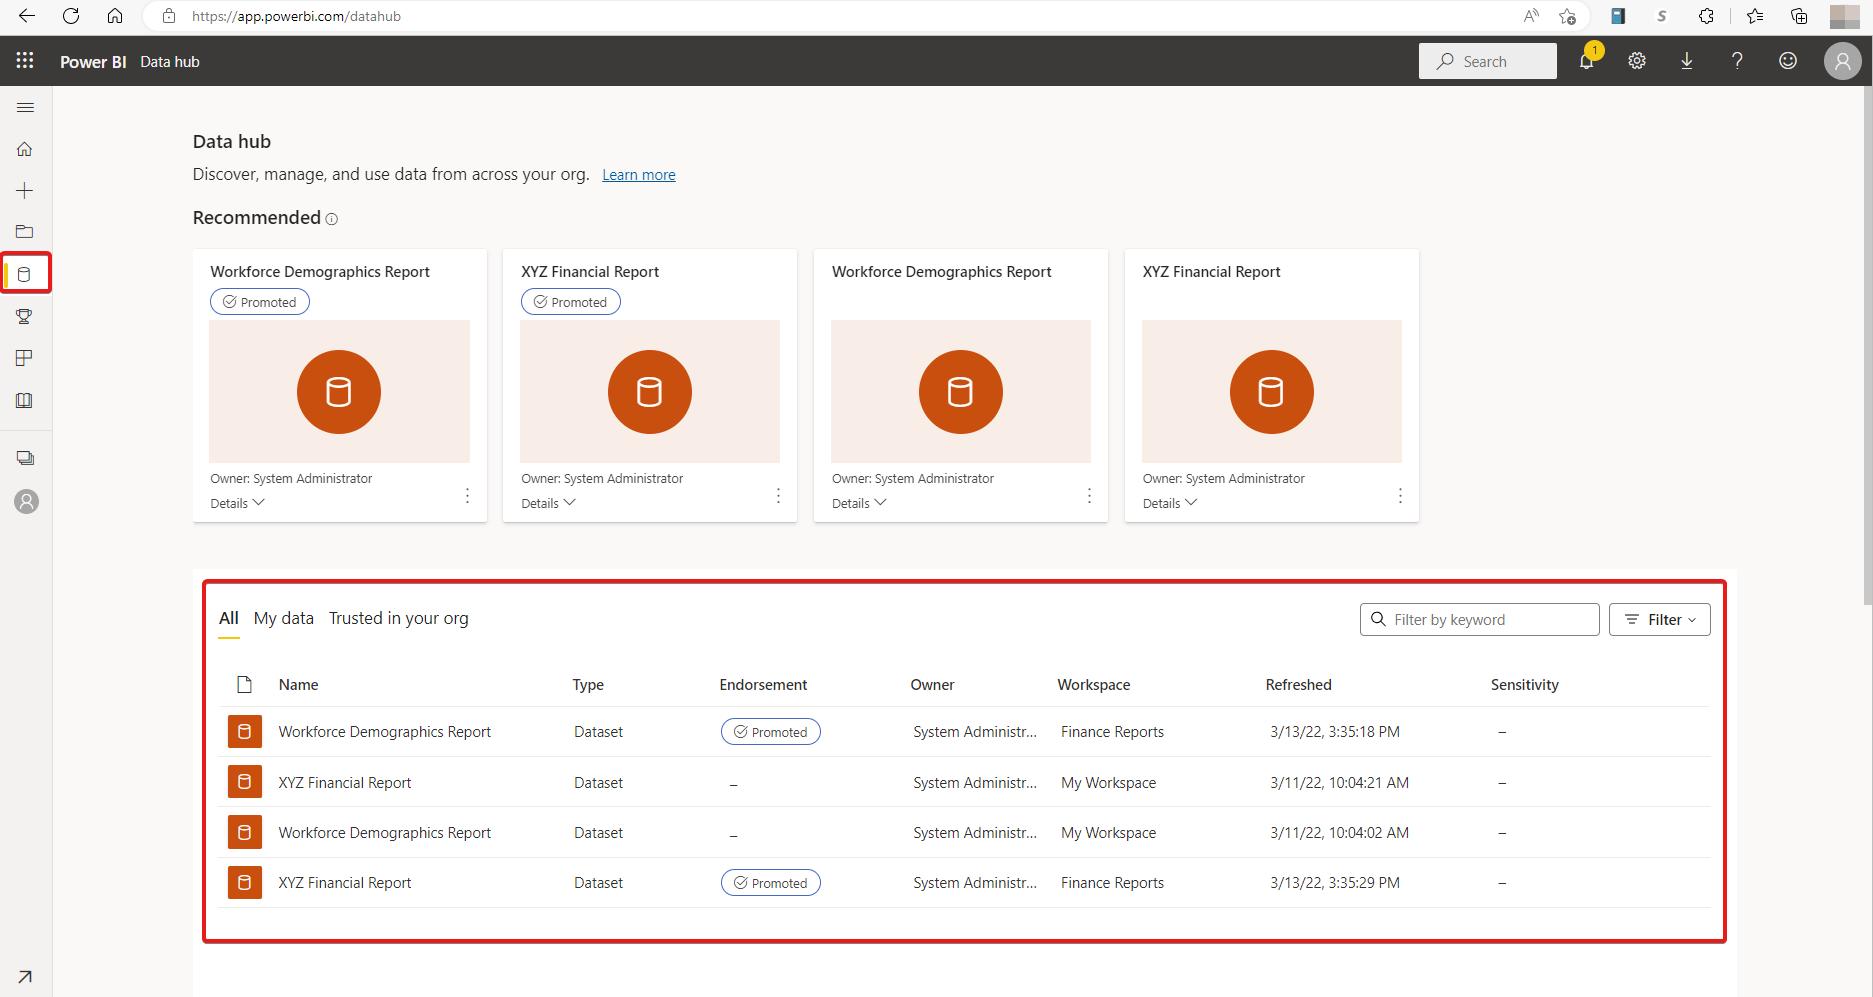
In the Power BI Data hub, you can discover recommended datasets based upon the activity of people you work closely with and find datasets trusted in your organisation. From any dataset in the Power BI Data hub, you can create new reports, download the PBIX file or create an ‘Analyze in Excel’ workbook in OneDrive to share with others.
Also, while you can connect directly to a Power BI dataset from Excel and build connected reports in the spreadsheet using PivotTables, you may also want to discover Power BI reports that use the same dataset either to get additional insights or validate your analysis in Excel. Under the ‘Reports using this dataset’ item in the pane, you can now see the Power BI reports that use a particular dataset.
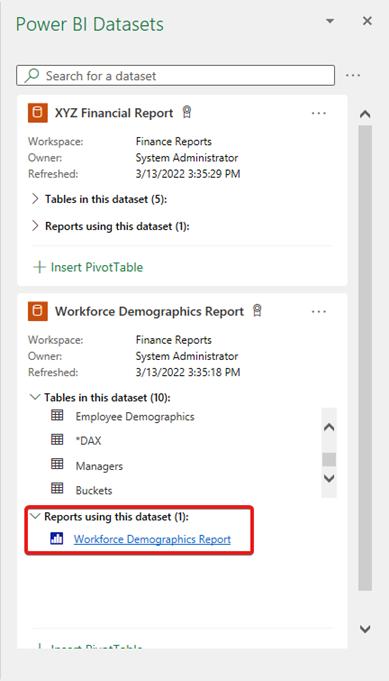
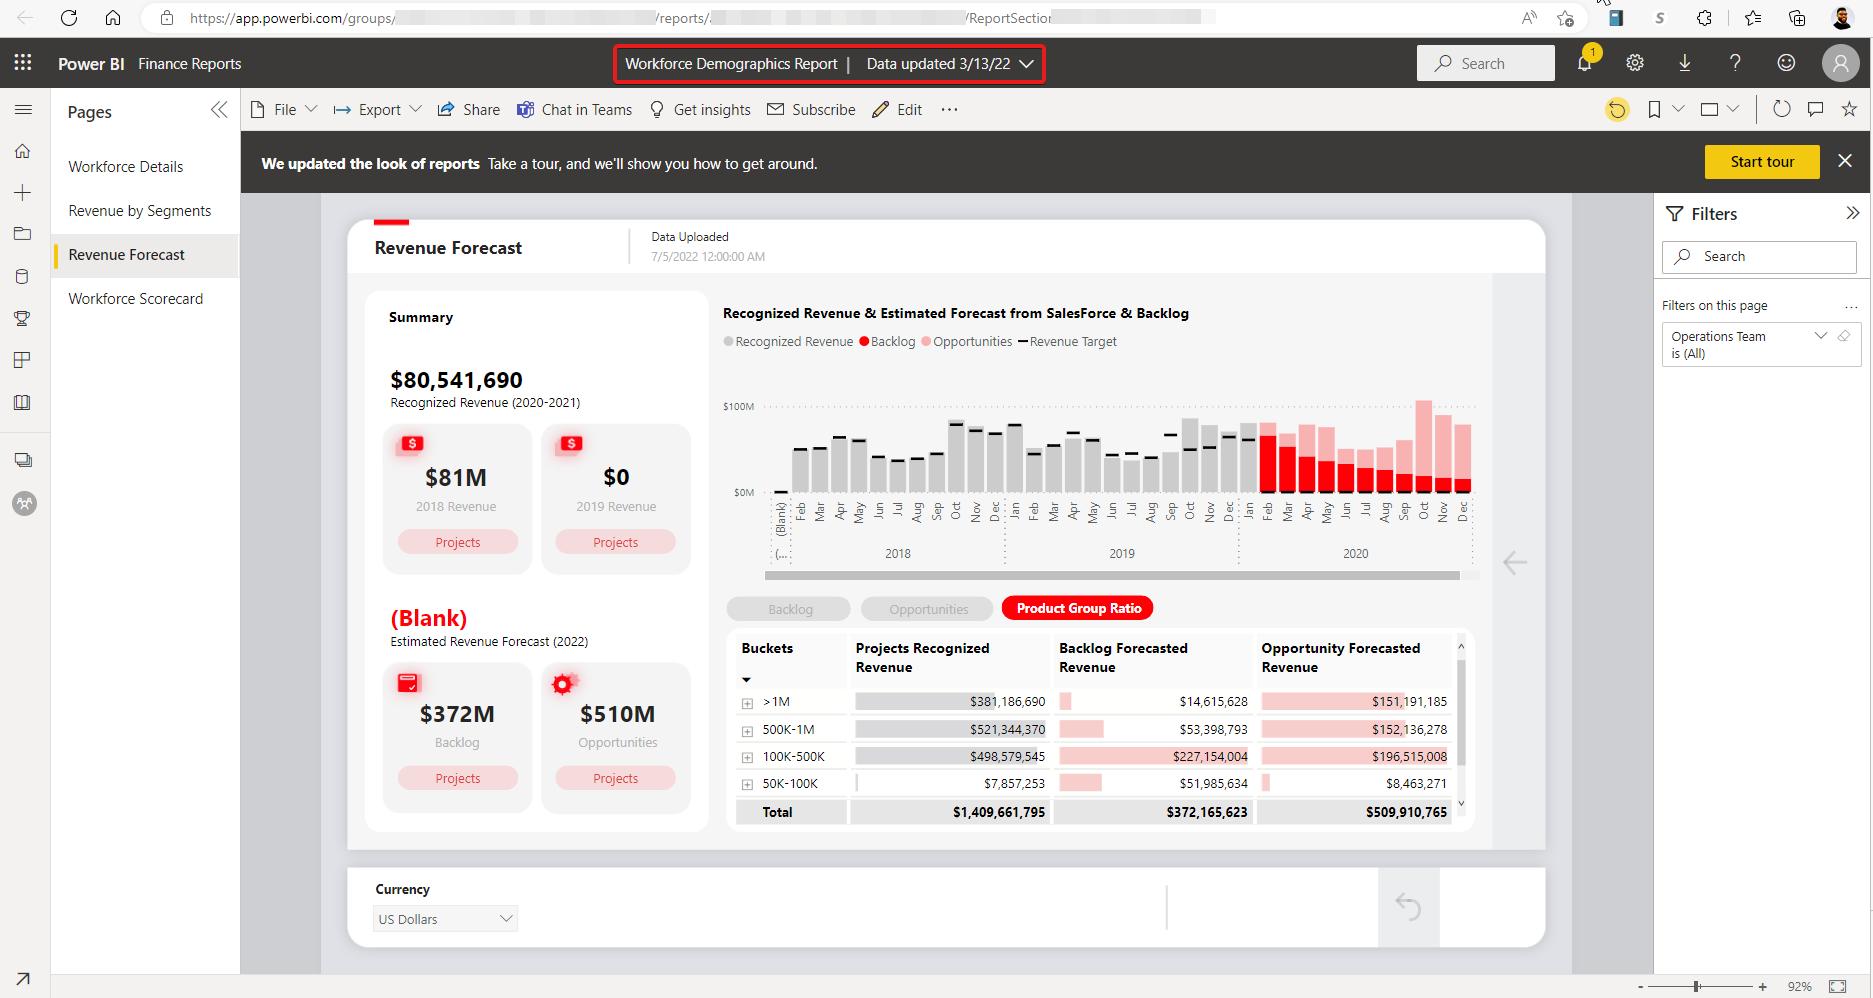
Each of those reports are direct links to the Power BI Service and clicking on any of the reports will open a new browser tab where you may view the report.
Check back next week for more Power BI tips and tricks!