
Power BI Blog: Upgraded Quick Insights
2 August 2018
As we promised in our recent newsletter, we’ll be spending the next couple of months talking about some of the new Power BI features that are being rolled out.
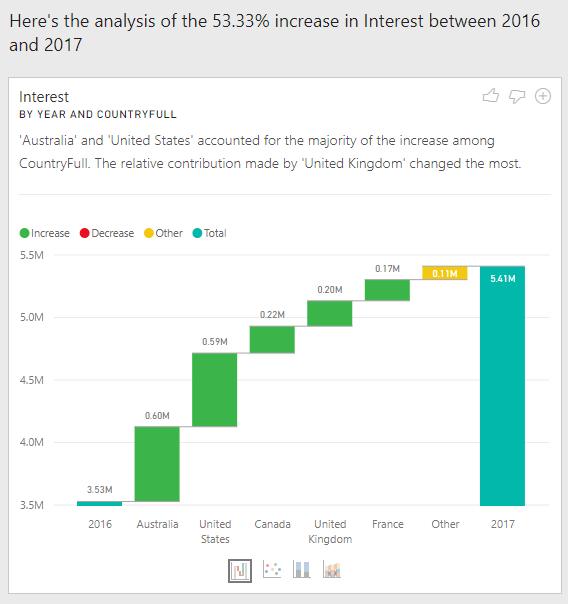
This week, we’re going to talk about a cool feature that’s extending the Insights feature in Power BI Desktop. Currently, we have tools that can “Explain the increase/decrease’ in a time series-based chart. At the moment, using this will help identify the shift in values from one period to another period, and propose a series of charts that will help define why that shift may have occurred, highlighting the categories that have the biggest difference – an increase in sales of one product, a decrease of sales in another product, etc..
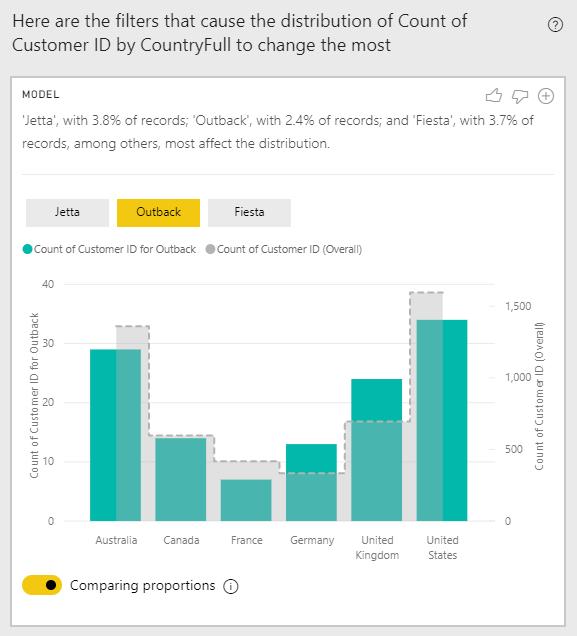
The Power BI team are extending this feature to look at distributions next. This will show a variety of charts that break down the distribution by different factors, filtering to values that have the biggest difference to the original distribution. This helps identify the impact on metrics without having to manually slice and dice by each different item in your dataset.
This is in preview right now, so make sure you download the latest version of Power BI Desktop to access this feature. Check back next week for more on the newest tools to arrive in Power BI!