
Power BI Blog: Q&A Power BI Desktop
13 September 2018
As we promised in our recent newsletter, we’ll be spending the next couple of months talking about some of the new Power BI features that are being rolled out.
This week, we’re talking about Q&A – not in the Power BI Service, but in Power BI Desktop. This is a feature that has been in preview for a long while, but has only recently made it into general release.
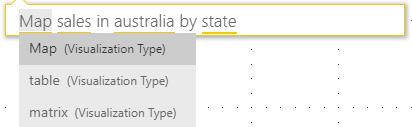
Q&A gives you the ability to ask plain language questions about your data. To access this, you can find it on the Home tab under Insert, or you can double click anywhere on a report page. Doing either of these will pop up a new visualisation and text box as follows:
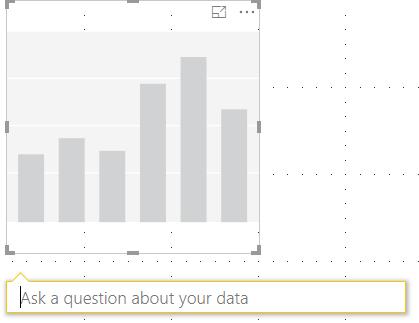
We can use this facility to ask questions about our dataset. Typing in a question will generate visualisations as Power BI attempts to answer them, using field names, looking through values, and trying to choose an appropriate visualisation to match.
If we’re happy with this visualisation, we can simply select anywhere else on the report page, and the visualisation will be set. Otherwise, we can keep typing new words in the visualisation to keep updating and customising it.
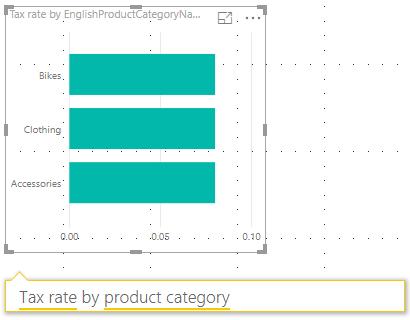
You can use this as a quick way to populate a report. For example, rather than setting up visualisations manually, you can type in five quick questions and rearrange your results.
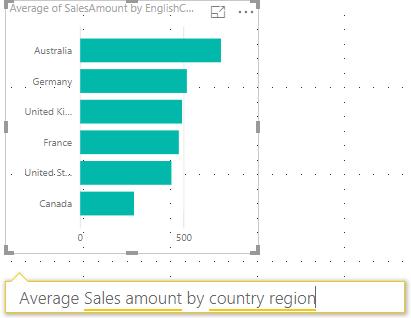
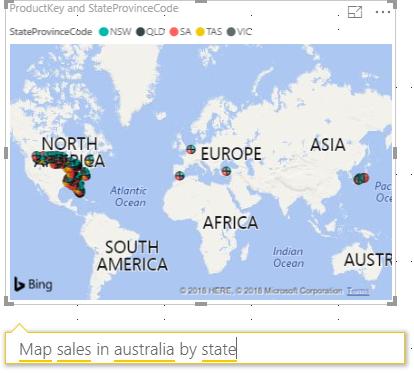
The challenge in getting Q&A working well is to have well defined table and field names. This has the biggest impact in helping Power BI understand what your dataset contains and where it can find the answers to your questions. Let’s take a look at an example:
In the example above, we are asking Power BI to “map sales in Australia by state”. However, it’s giving us this very strange result – we’ve got a whole range of different map points listed (none of which are actually in Australia!), and a legend that breaks down each point to values relating to the Australian states.
If we click on some of the underlined words, we can see what it’s trying to do:
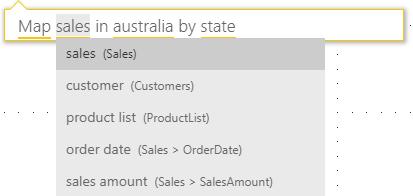
It correctly recognises that the “Map” element is intended to pick up the Map visualisation type. However, it looks at “sales” and interprets that as referring to the Sales table, rather than the SalesAmount field (i.e. the value that we might refer to in a business as “Sales”) that is located in the Sales table. We can select the sales amount item to help Power BI identify what it is that we’re looking at.
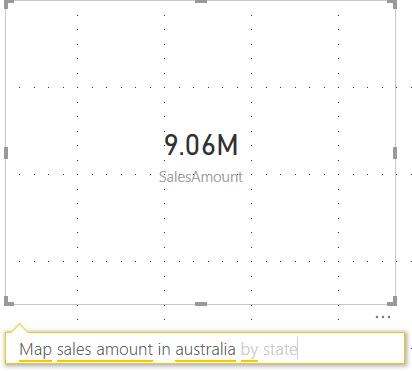
In this case though, it’s getting confused again because now it’s failing to recognise “state” as something that could be linked to the sales amount. So, we can try to be more specific and use the entire field name where the State is stored:
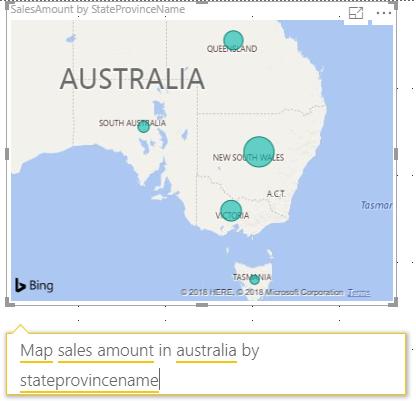
Finally, this gets us the visual that we want to see! We can see some of the shortfalls with working with field names and table names if they haven’t been set up appropriately for use in Q&A.
Here are some tips for improving your Q&A results:
- Use distinctly different names for tables and fields. Instead of calling our transaction table “Sales”, we could have referred to it as “Transactions”, allowing for a distinction between “Sales” the table, and “Sales” the field
- Rename your field values to reflect the terms that your business would use. For example, instead of “int_cust_no_key”, being the field coming out of your data warehouse, you could use “Customer Number”. In the example above, instead of “SalesAmount”, we could use “Sales”
- Create and label measures appropriately to calculate ratios, as Q&A will generally will only be able to understand basic aggregations
These tips also apply to using Q&A in the Power BI Service. Keep on top of your data when you’re bringing it in, and it will pay dividends in the long run.
See you next week for more new features and tips!