
Power BI Blog: Power BI Dataflows – Part 1
4 May 2023
Welcome back to this week’s edition of the Power BI blog series. This week, we look at what Power BI dataflows are, and how they may be created.
In Power BI Desktop, we use Power Query to extract, transform and load the data needed for our reports. In Power BI Service, dataflows allow us to manage group of tables in a similar way to Power Query, but dataflows run on the cloud using Power Query Online and are independent of the Power BI dataset or solution.
Similarly to Power Query in Power BI Desktop, Dataflows is a powerful tool that allows us to extract, transform and load data from various sources into a single, unified data model in an easily accessible location. This data model can then be used across multiple reports and dashboards within a Power BI workspace, making it a great tool for data preparation and management.
Some of the benefits of using dataflows in a workspace are:
- the data model can be shared between reports, reducing repetitive processing
- data management within the workspace is improved
- we may control the way data sources are accessed
- report refresh times are improved
- scheduled automatic data refreshing, which keeps the data up to date without manual work.
Dataflows also allow sharing of data models among multiple users within an organisation. This enables teams to work together more efficiently, since they can access and use the same data model. If each team member has their own data model to maintain, discrepancies may arise between the reports produced by different members.
To create a dataflow, we need to launch Power BI Service. Dataflows are not available in Power BI Desktop. We log in to Power BI Service and navigate to (or create) the workspace that we are going to use the dataflow for. Note that dataflows cannot be created from ‘my-workspace’.
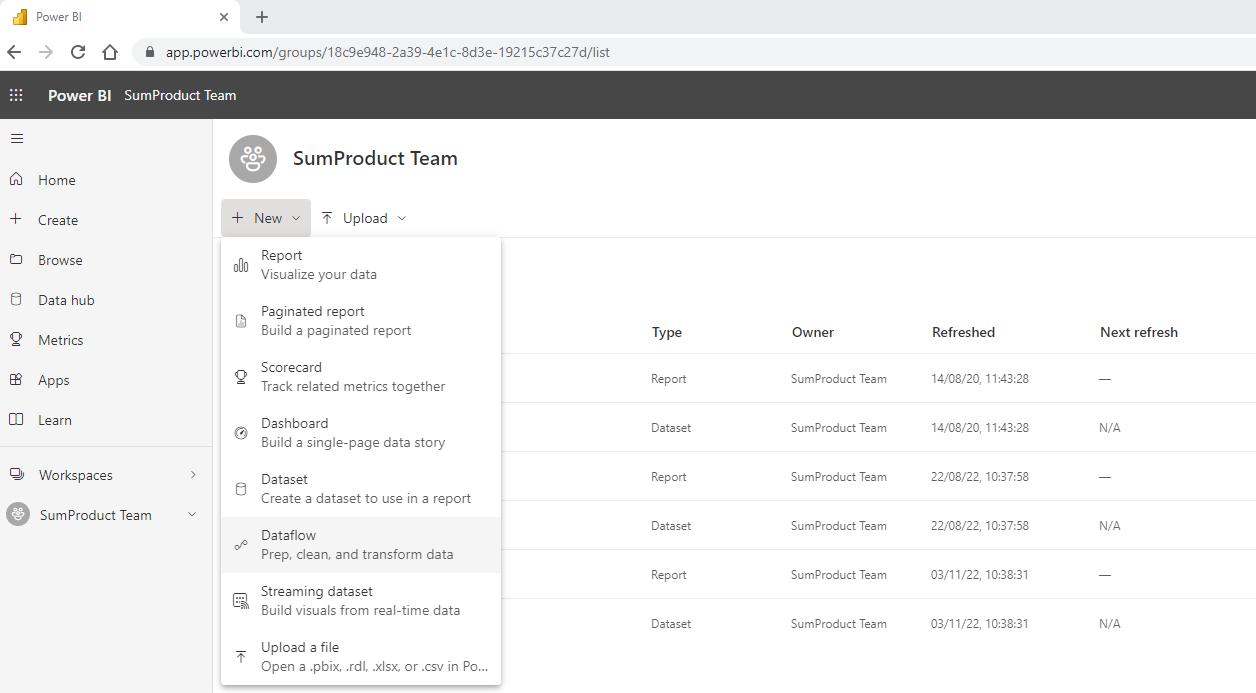
To create a new dataflow, we click on the ‘+ New’ button on the workspace and select Dataflow.
We are then presented with four [4] possible ways to start creating the new dataflow:
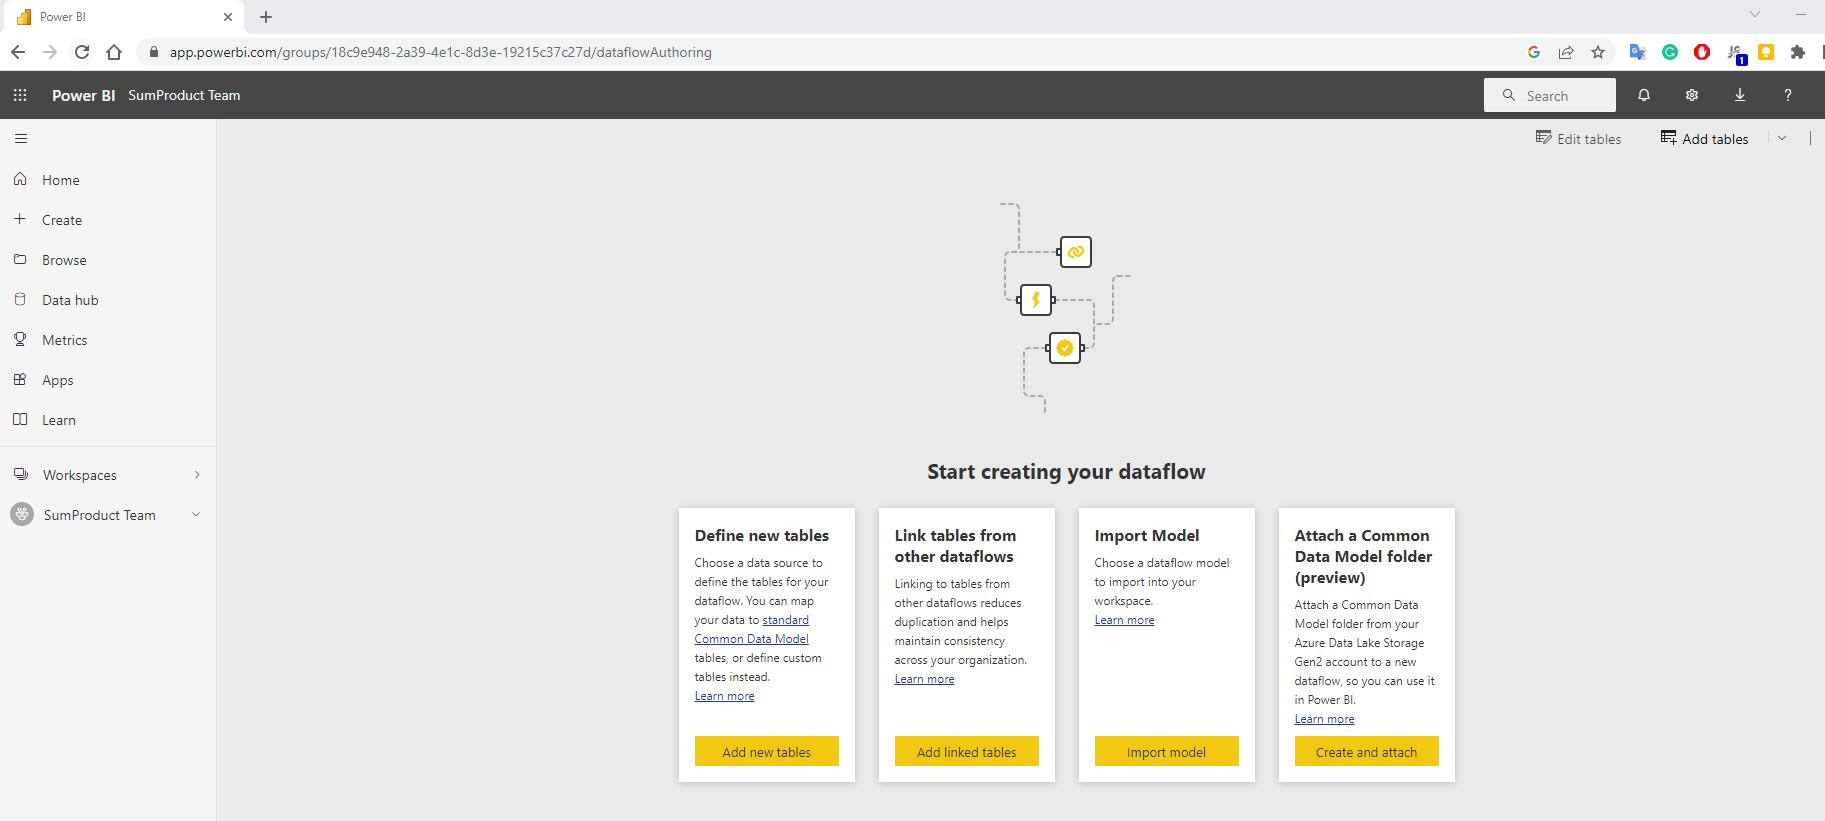
The methods are:
- define new tables
- linked tables from other dataflows
- import model
- attach a Common Data Model (CDM) folder.
Since the other
options are using existing dataflows as a basis, we will describe how to create
a dataflow by using ‘Define new tables’.
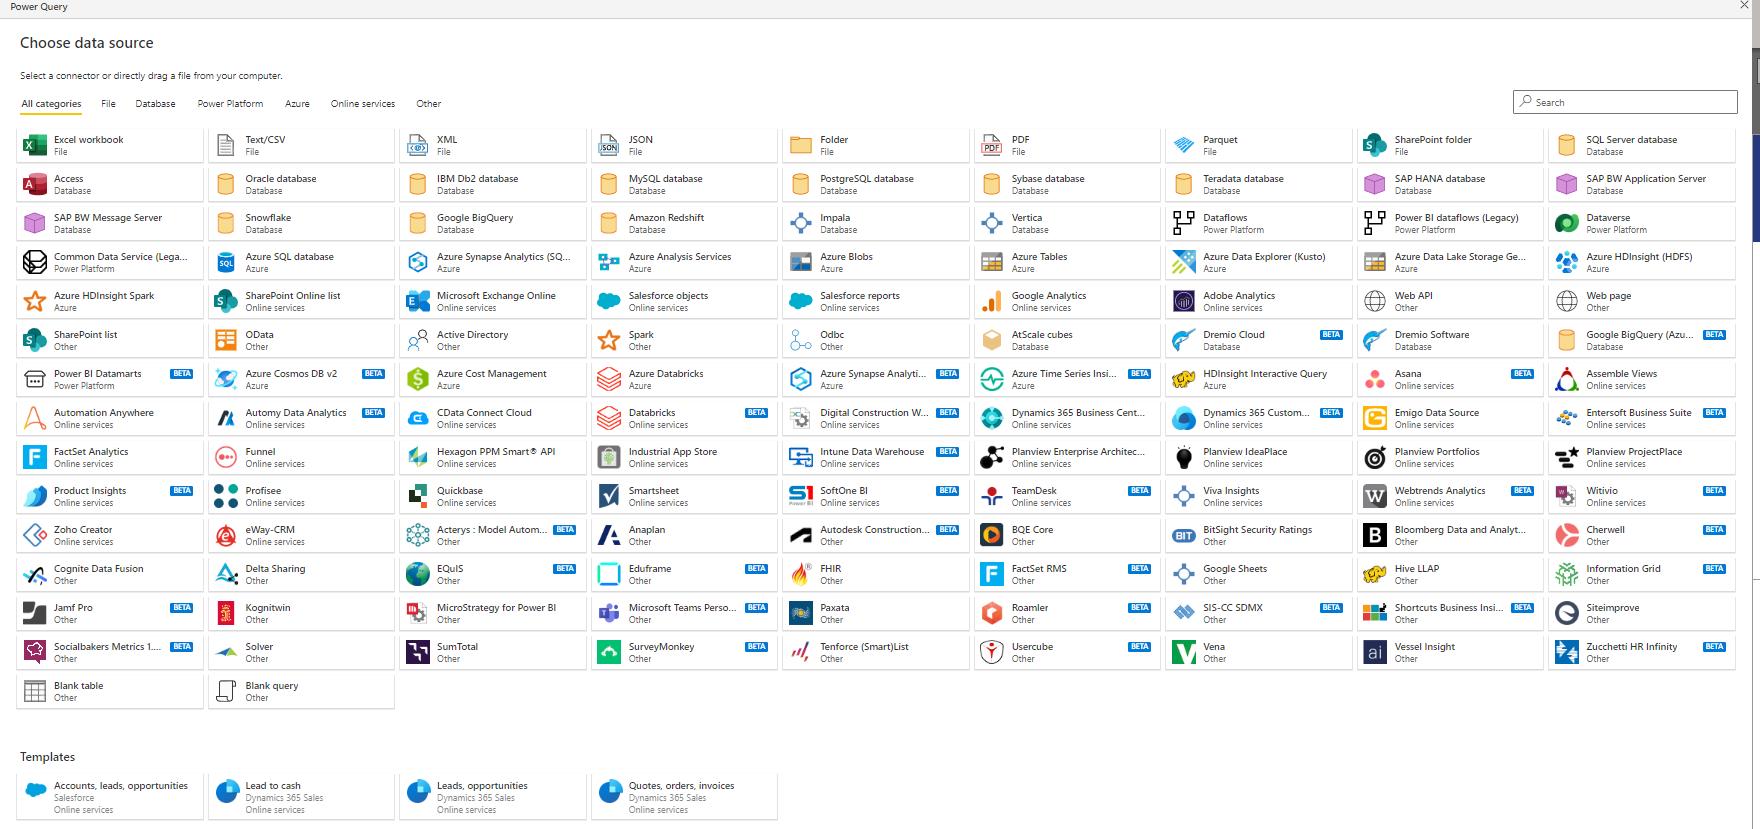
We click on the ‘Add new tables’ from the ‘Define new Tables’ frame and choose the data source we wish to connect to, such as Excel, SQL Server or SharePoint. Below are some examples of the data sources available on Power BI Service:
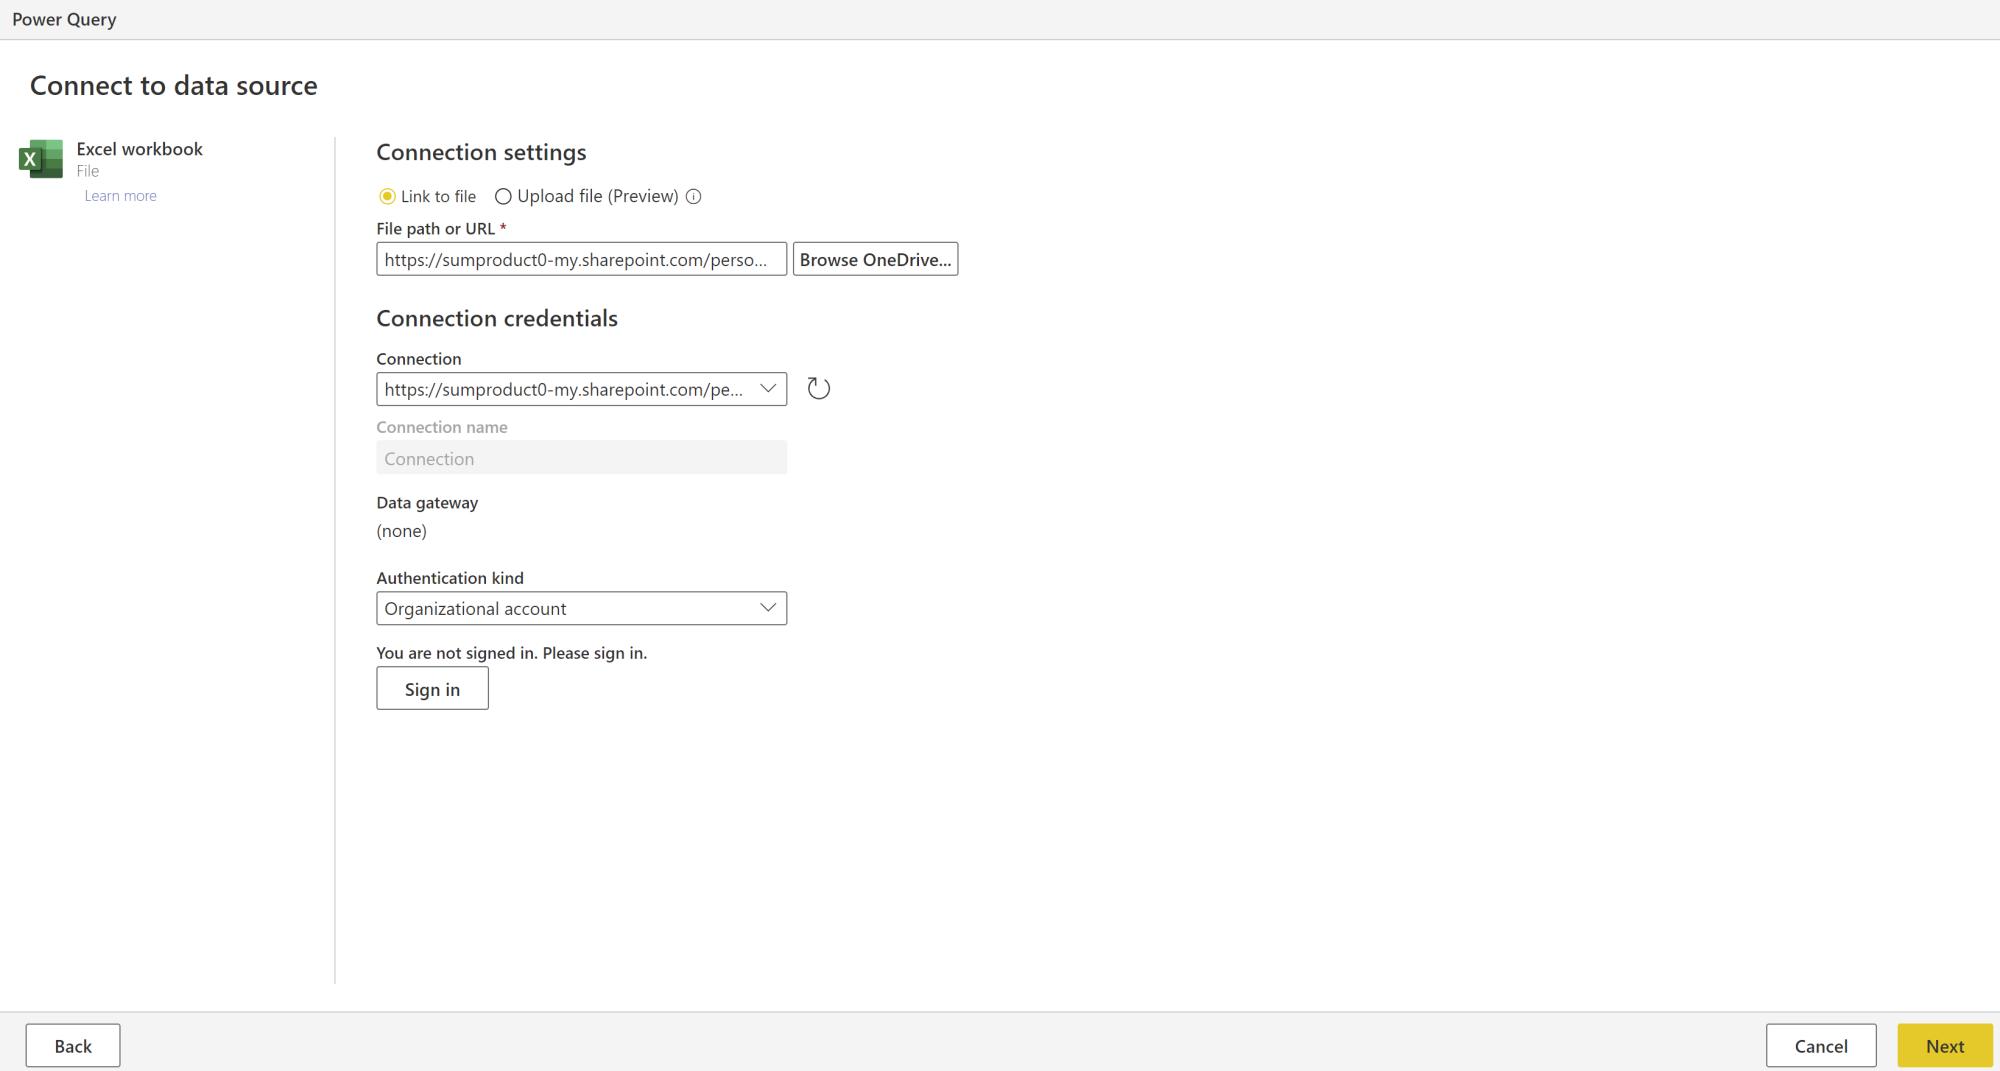
Once we have chosen a source, we follow the connection wizard to import the data into Power BI, and then click the ‘Next’ button to continue:
We are then taken to the Power Query Online editor where we can edit and clean the data using tools familiar to users of Power Query in Excel and Power BI Desktop. Some examples of transformations available include removing columns, merging tables, adding calculated columns, filtering, grouping or pivoting. We can also create calculated tables, which are tables that are generated from expressions or formulae.
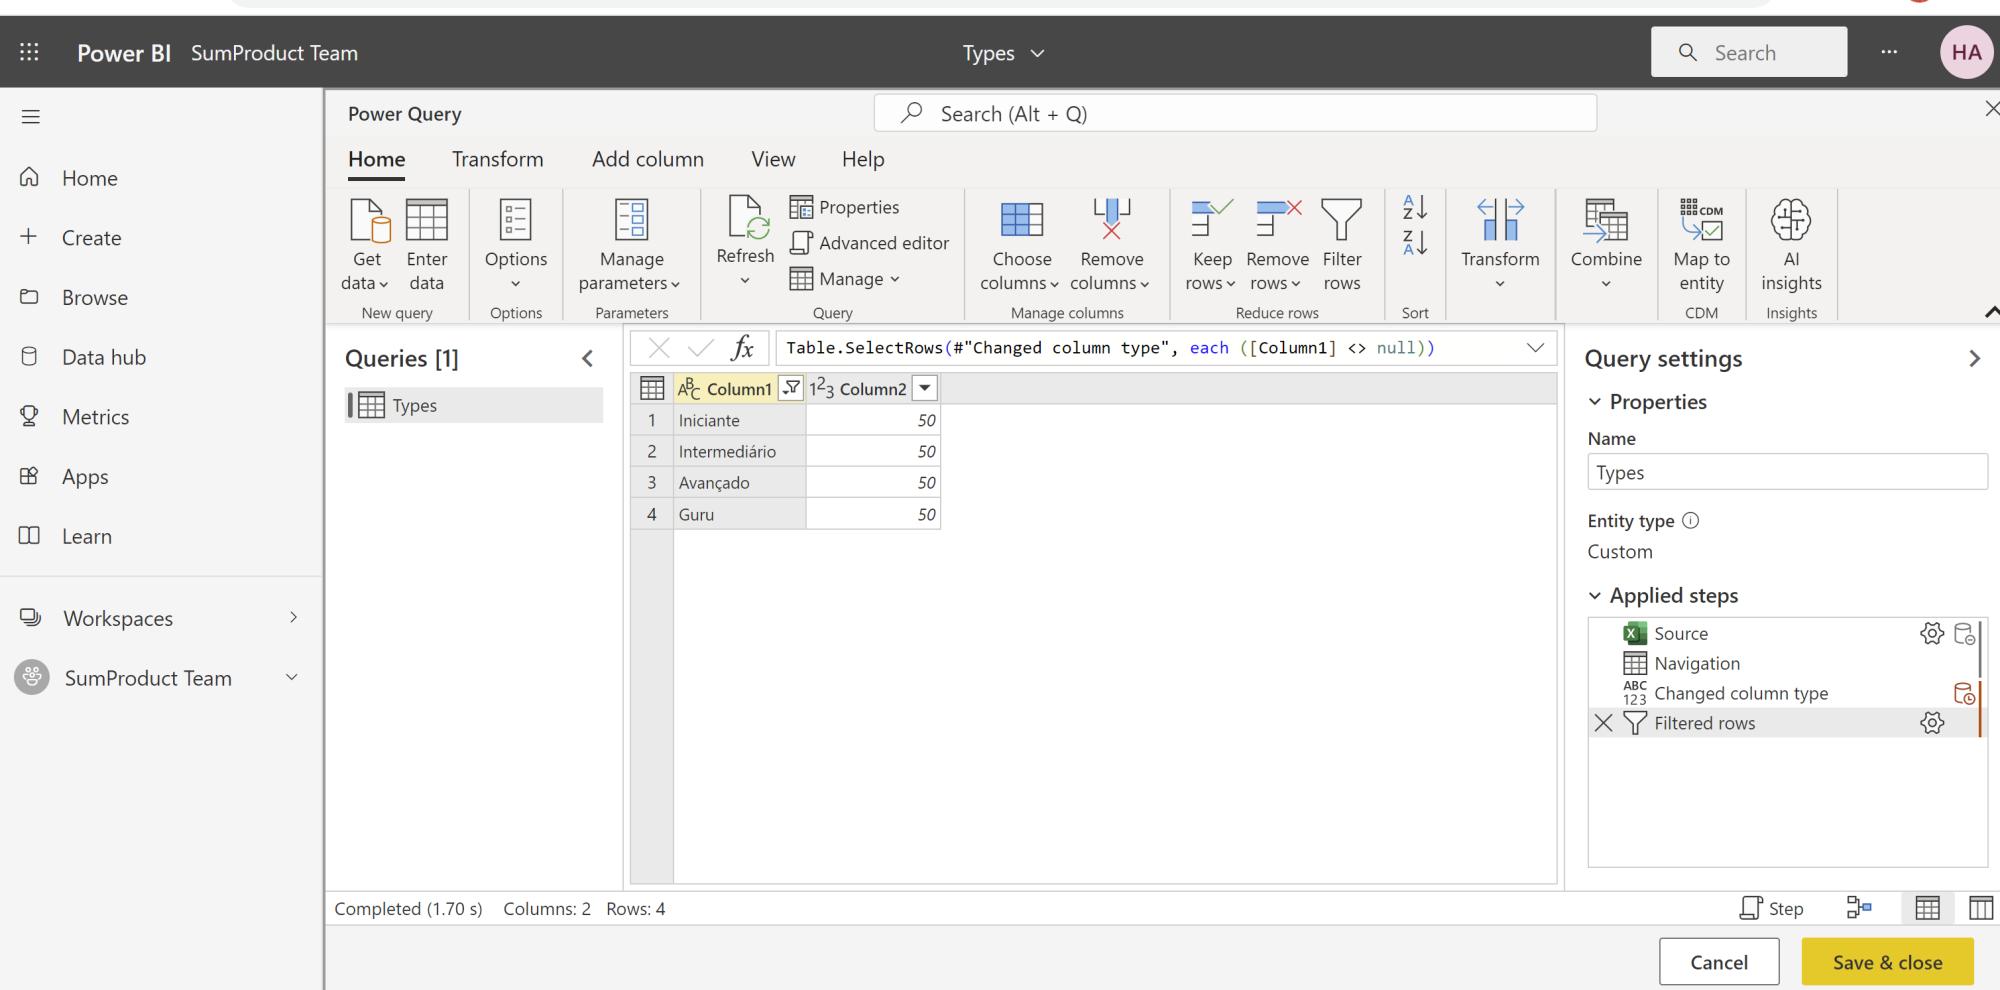
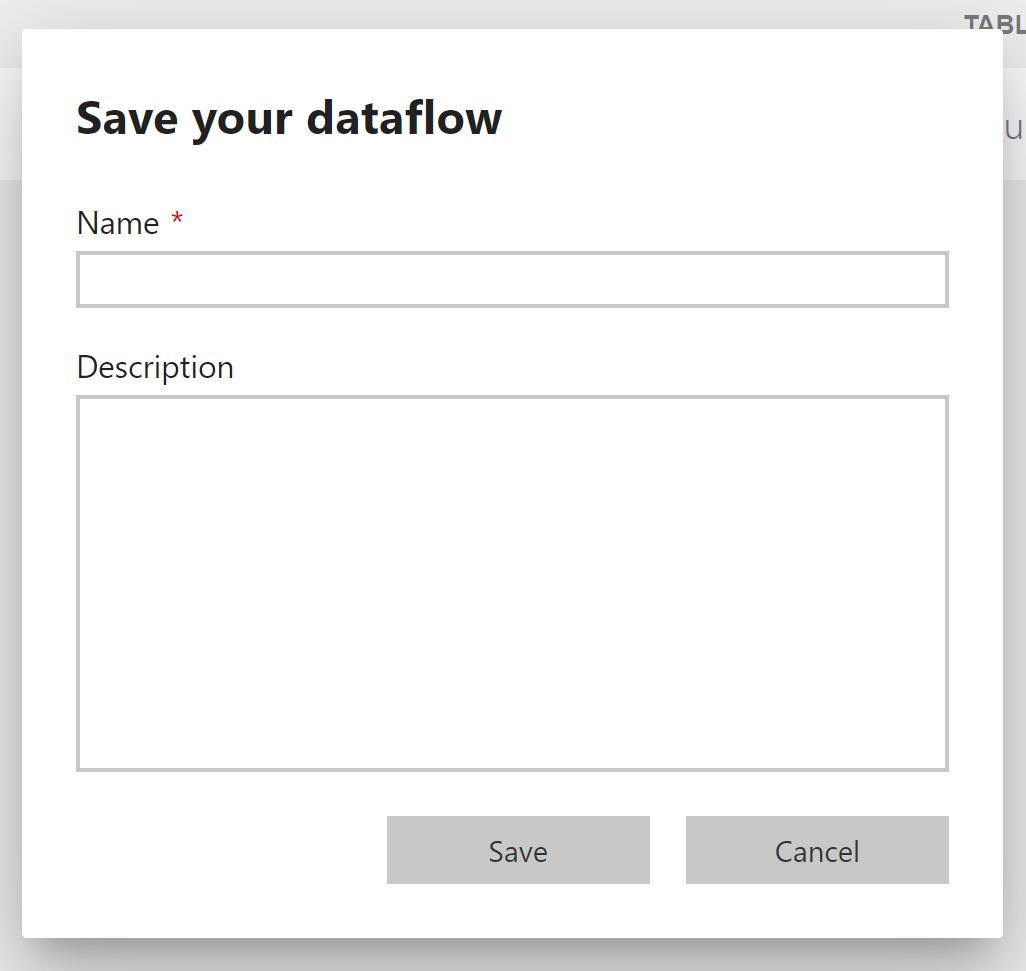
In a similar way to the Power Query editor in Power BI Desktop, we can click on the ‘Save & Close’ button when we have completed our transformations. We are prompted to save the dataflow and assign a Name. The optional Description can be used to give other users an idea of what data the dataflow contains and its intended purpose.
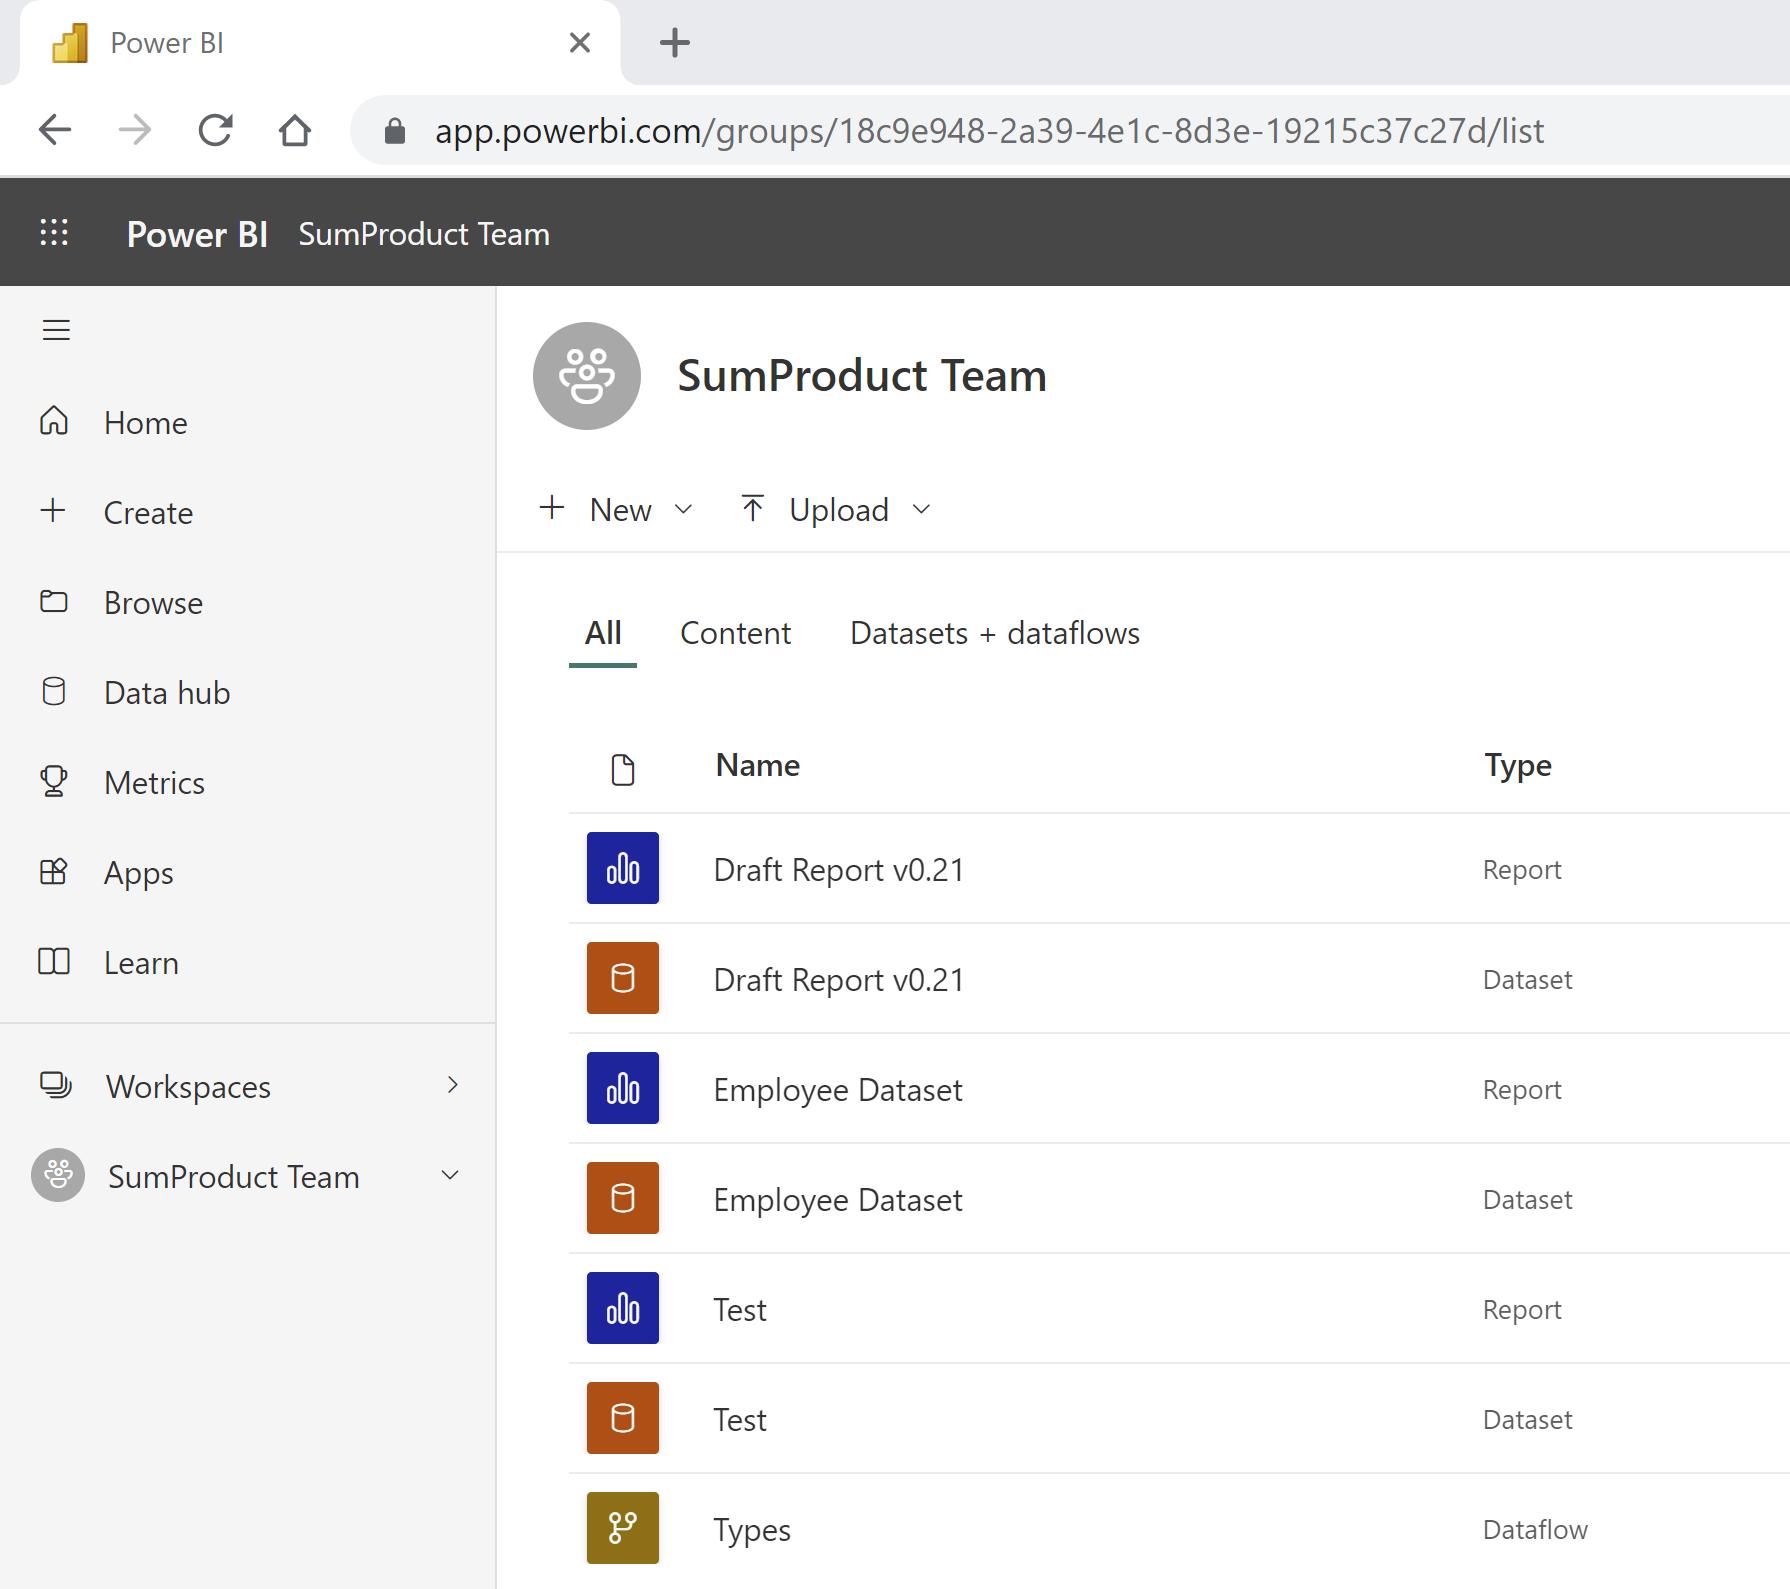
Having saved the dataflow under the name ‘Types’, it appears in the workspace:
Next time, we will look at how to use the dataflow we have created and how we would use it to create a new dataflow.
Check back next week for more Power BI tips and tricks!