
Power BI Blog: Custom Visuals - Histograms
14 March 2019
Welcome back to the Power BI blog series! This month, we’re talking about different custom visuals that you can use in Power BI. In particular, this week we’re going to continue looking at charts that you often want to develop in Excel, but find it difficult to do, so we’ll look at the Histogram today.

Searching for histograms give you a number of different options. We’re going to demonstrate the first option, the standard “Histogram Chart” today. As before, add that to your Power BI file and we can get going.
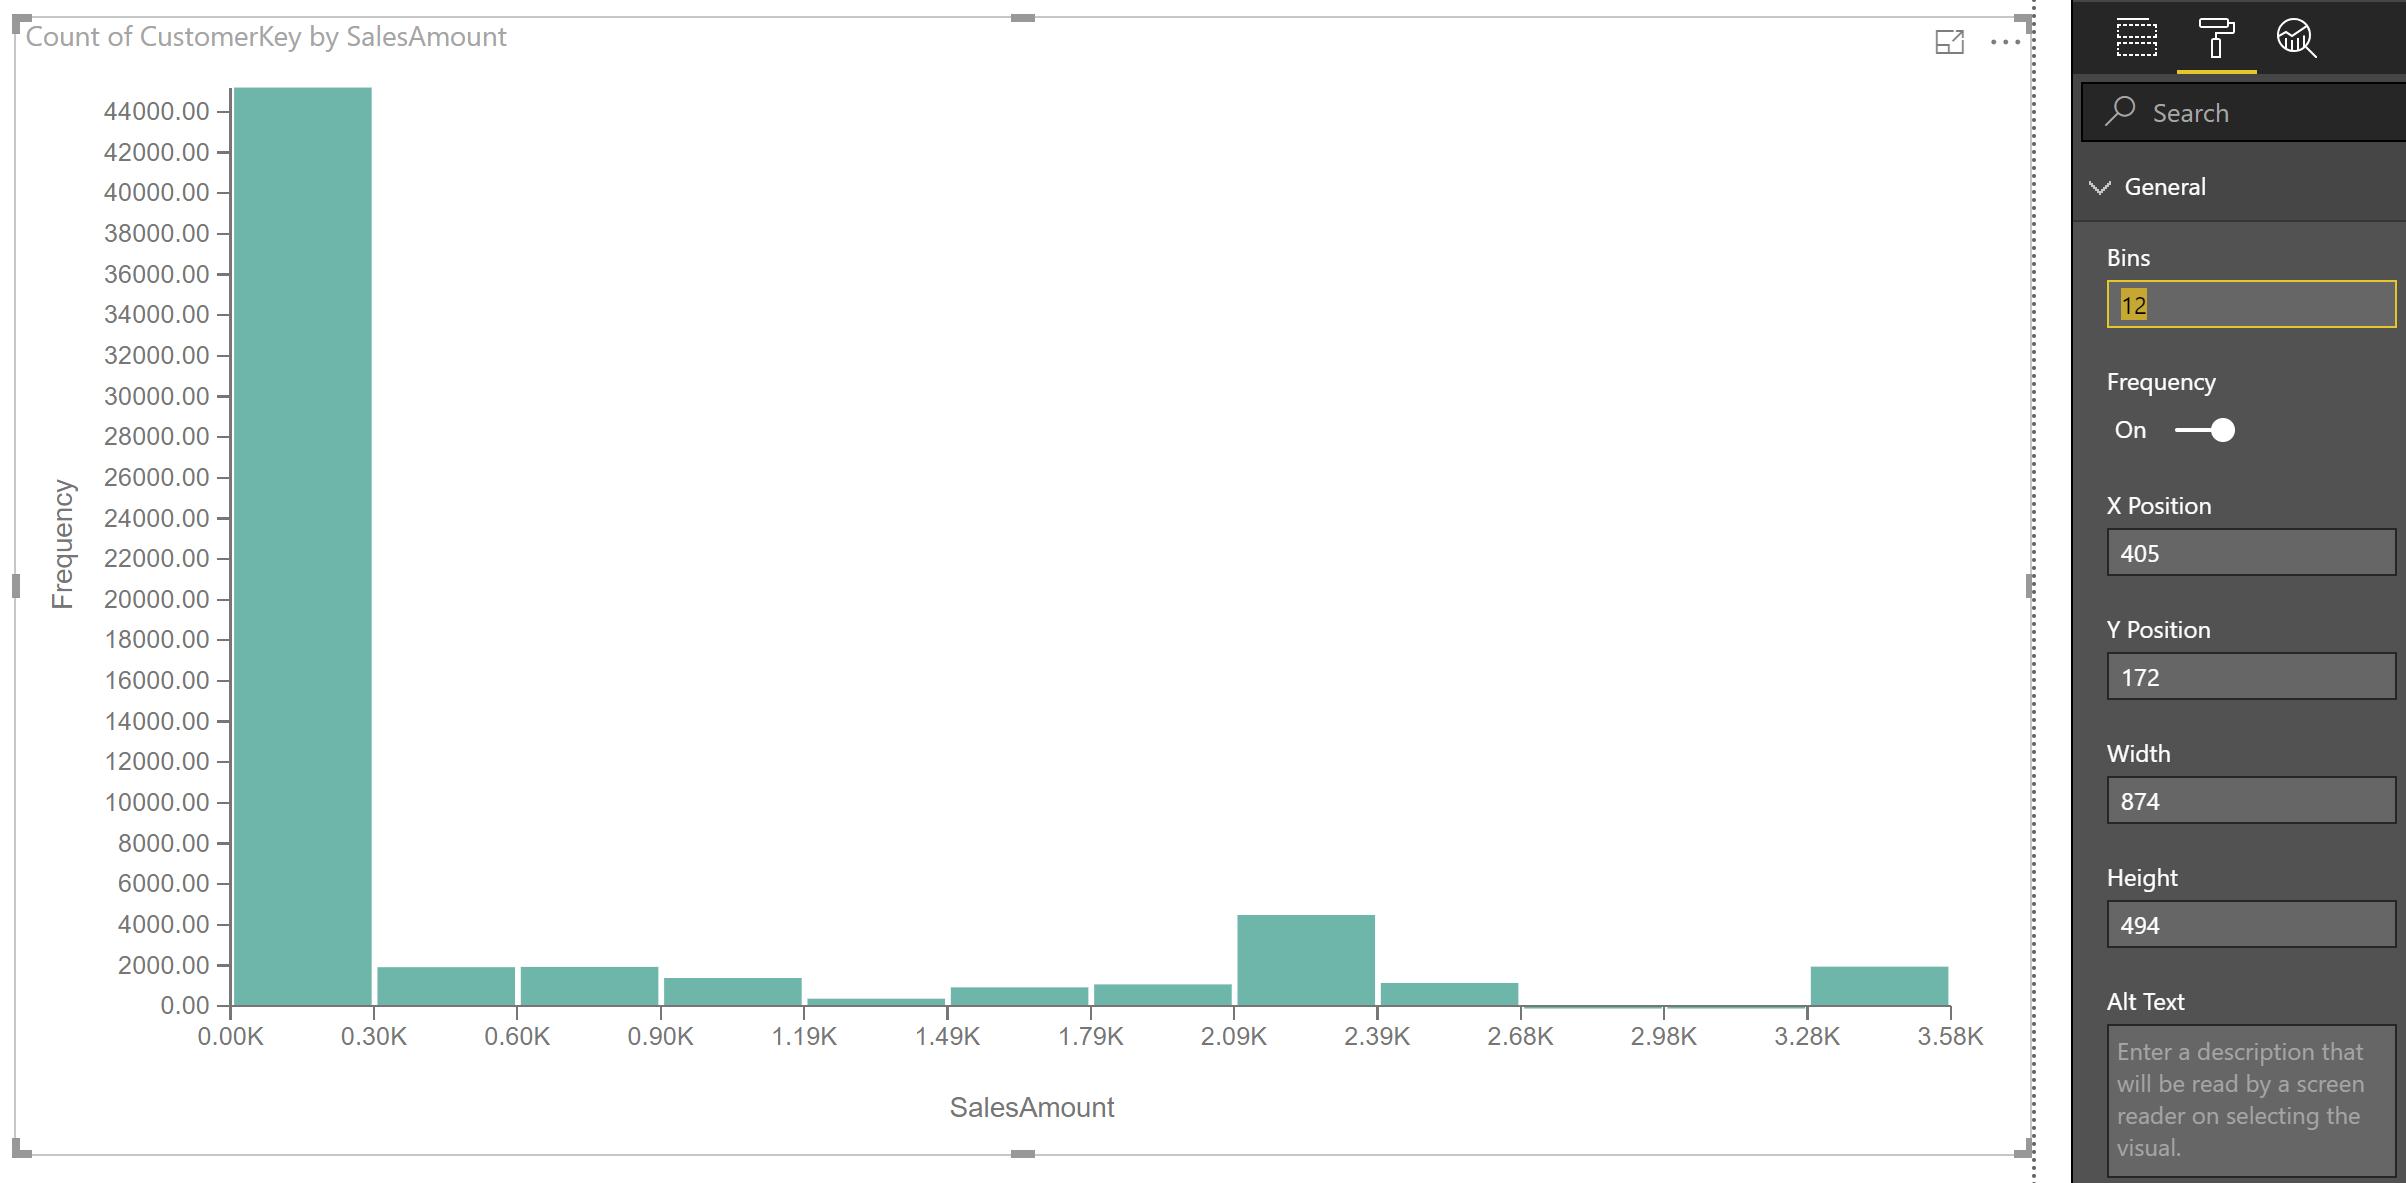
Incorporating the histogram with our dataset, a logical way we could use this is to see how many transactions we have, for any given group of sales amount. That is, is there a particular sale amount range that has more or less transactions than other groups? As it turns out, by using the SalesAmount as the values, and the Count of CustomerKey as the frequency tool, we can very quickly see what the distribution looks like:

Clearly, most sales occur for transactions less than ~$500, with some interesting spikes around $2,000-$2,500, most likely where particular mountain bikes are popular. This automatically assumes that each group will be of even size, from the lowest value to the highest value. You can change the number of bins available using the Format tab, under the General heading:
As an alternative, we can download the “Violin Plot” visualisation to see what that can do. In this instance, the Measure Data that we’re using will be the Sales Amount, and we’re allowed to perform some additional Sampling – we’ll use the Order Date. Effectively, this means that we’ll be able to see what the volume of sales are for any given order date, and the frequency with which different volumes are sold.
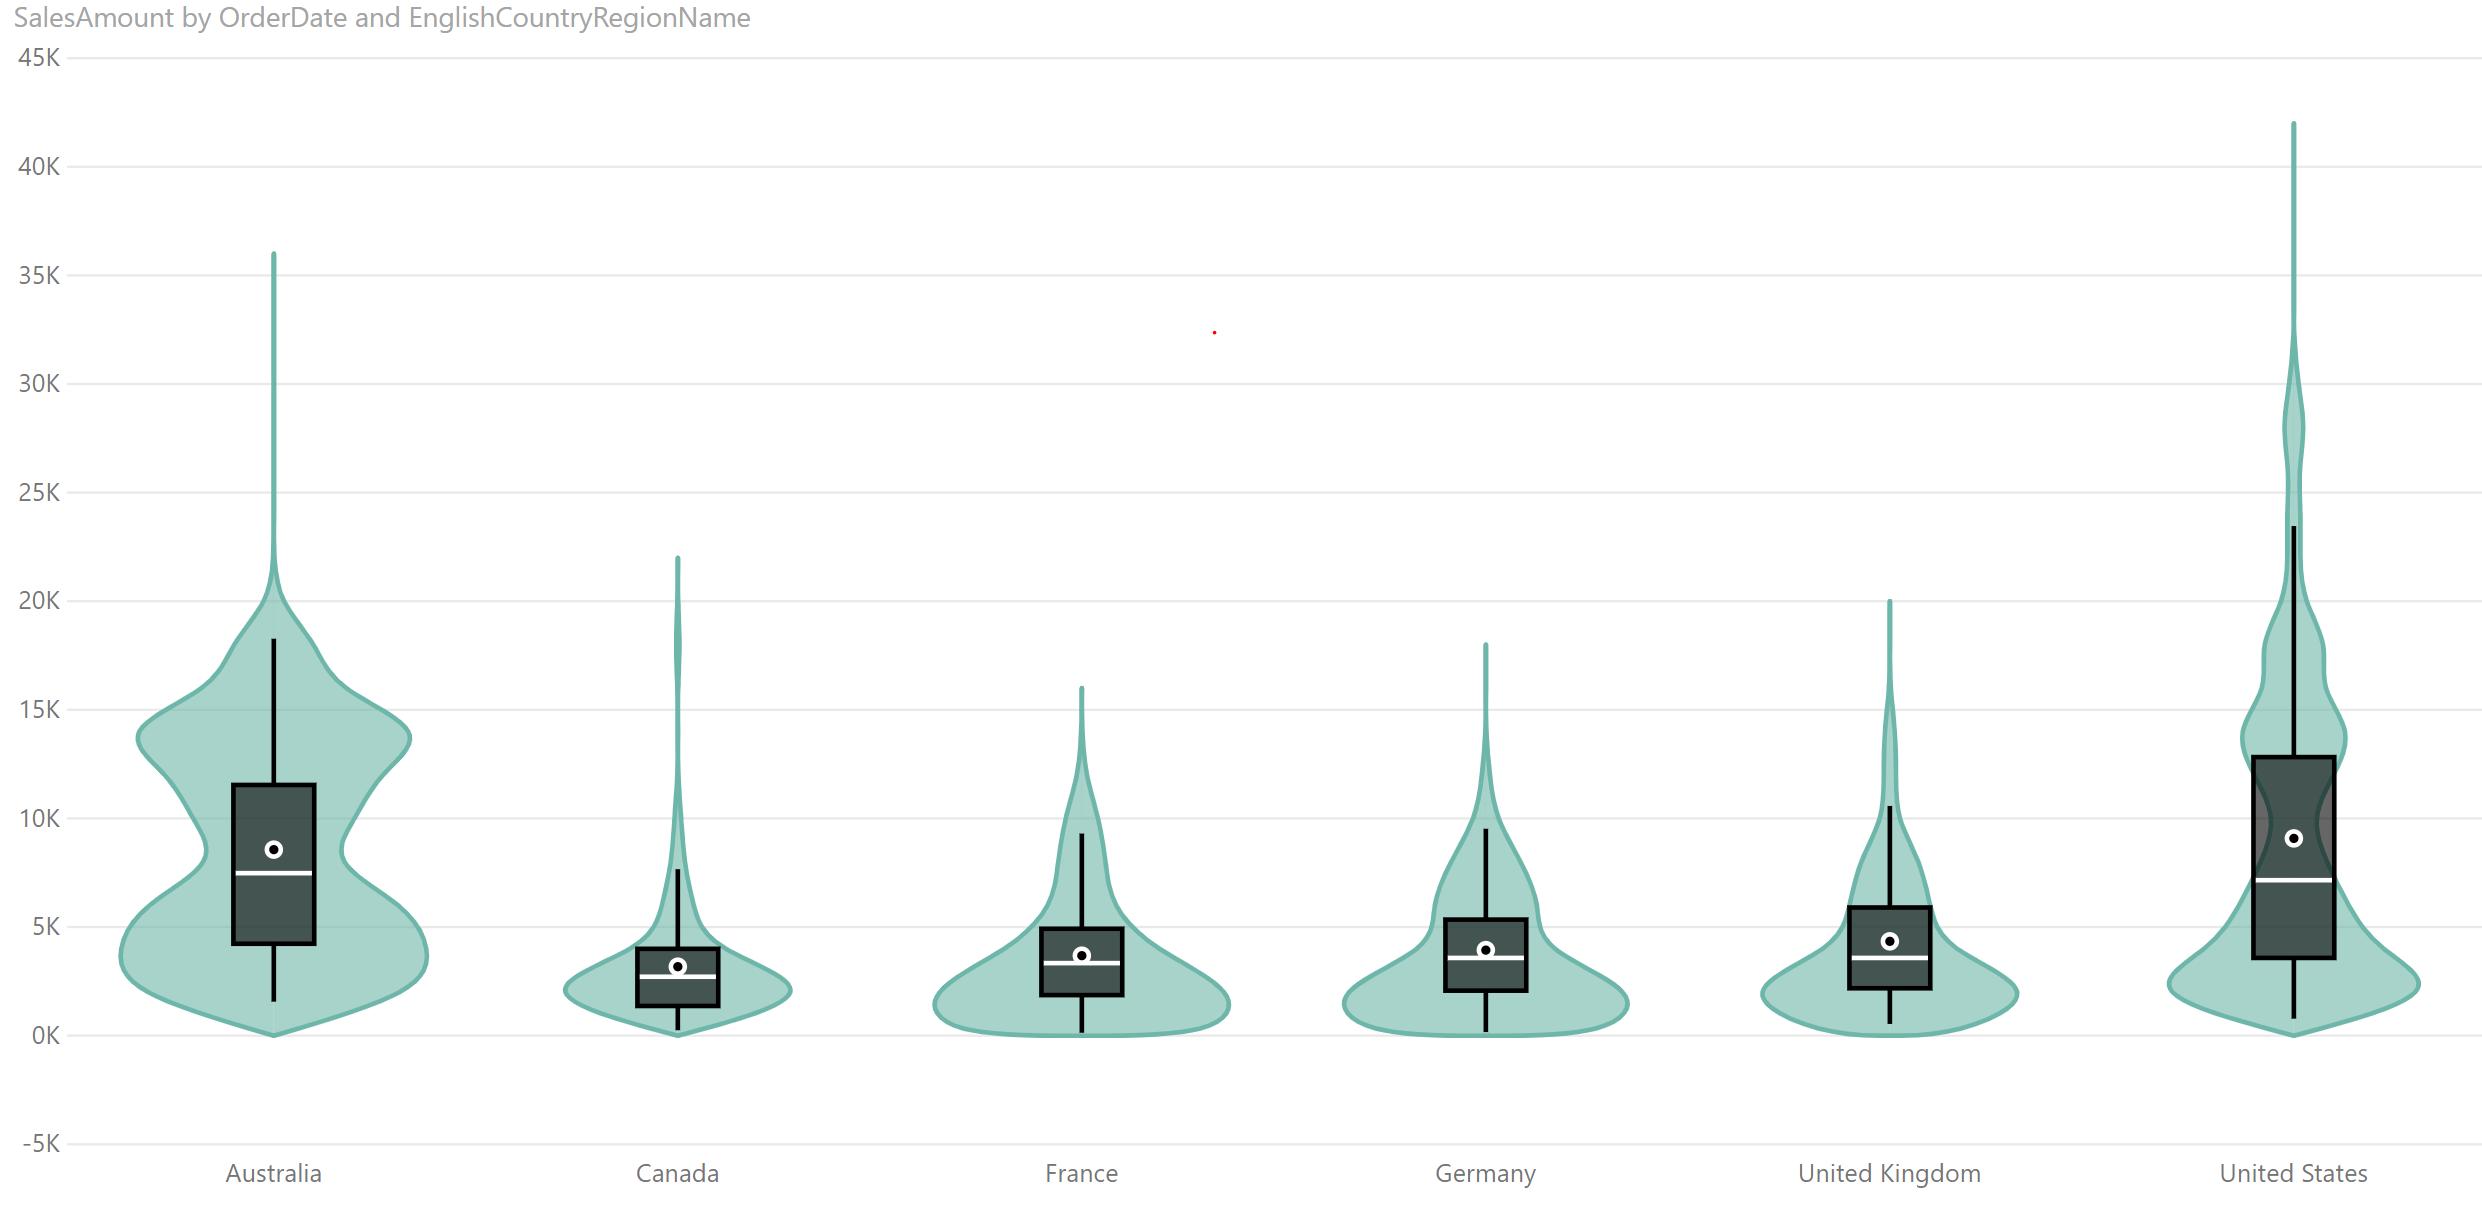
This gives us an interesting set of charts, especially when broken down by country. From this visualisation, it shows us that Australia and the US have a higher frequency of days that result in larger sales. Alternatively, we can read that in Australia, sales are more likely to be particularly low (around 4k) or particularly high (around 14k). This daily distribution of sales is quite different from other countries, which seem to have a peak around 2-2.5k per day and tail off thereafter.
Hopefully this gives you some inspiration to play around with new and interesting visualisations. We’ll come back next week with some new and interesting ideas!