
Power BI Blog: More Updates for the New Format Pane
28 April 2022
As you may recall, the new Format pane has been in Preview since last November and was turned on by default for users in February’s Power BI Desktop updates. Now, Microsoft has announced they plan to make this Generally Available in May, which means you will no longer be able to switch back to the old Format pane.
There is more though: Microsoft has received “significant feedback” to expand all sub-categories by default and has cited they will add a user preference setting in next month’s release to allow all sub-categories to remain expanded when you open a card (yay!). This should feel familiar to the old Format pane behaviour.
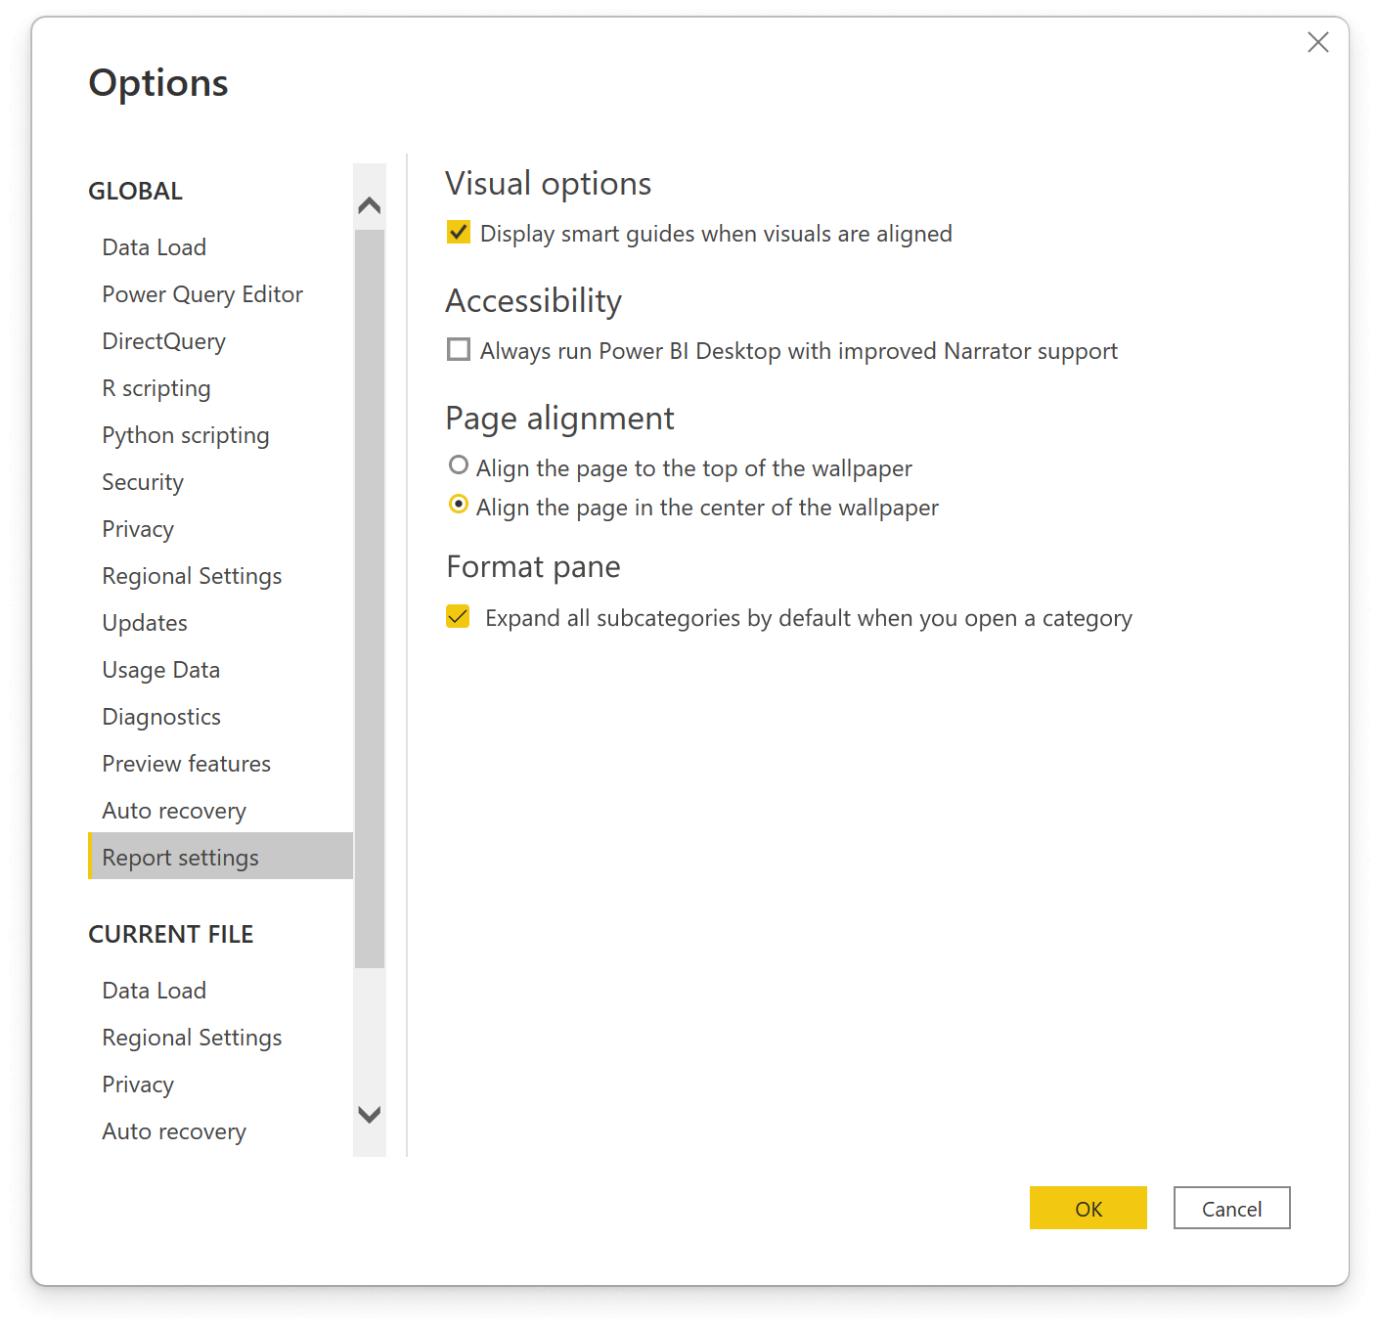
Presently, with the current default (setting is off), only the first sub-category is expanded by default to allow for a quick scanning of contents:
However, if you prefer, you may switch the setting on and all sub-categories will be expanded to reduce the extra clicks (surely only a glutton for punishment would not select this option?):
That’s not all, either. Microsoft has been busy with the following further improvements:
- Shape map custom colour has been re-added
- Scatter chart ‘show blank values’ toggle has been re-added
- Slicers with slider type (between, before, after) responsive toggle has been re-added
- button icon size setting has been re-added
- the bug causing a delay in cursor position for text input boxes has been fixed.
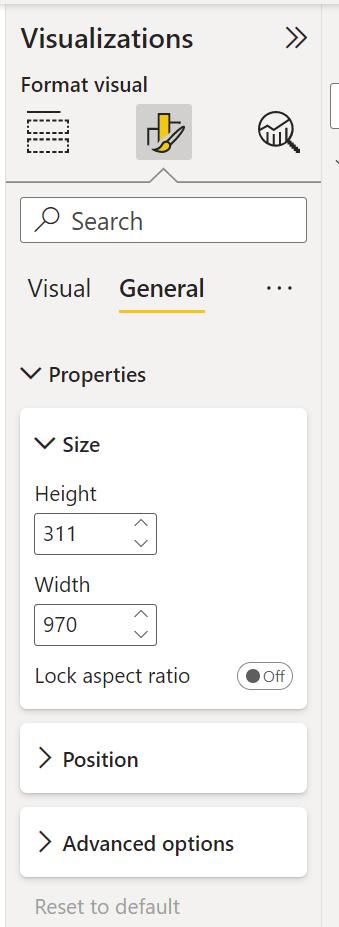
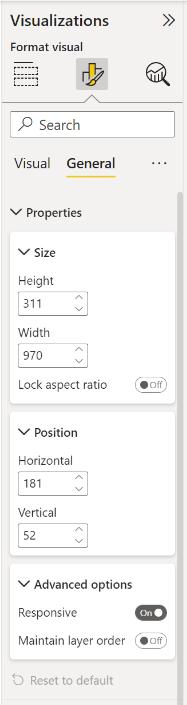
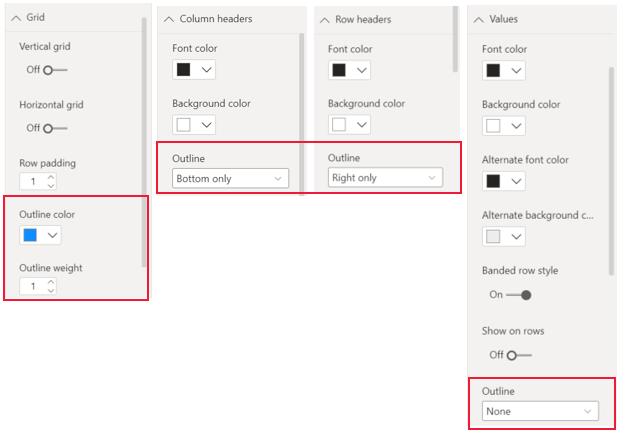
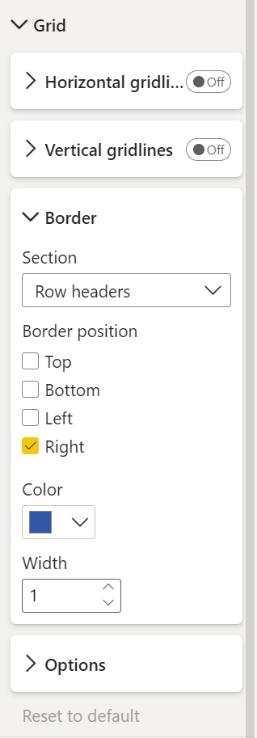
In addition, the outline settings for matrices and tables have been consolidated, so that they may be set from the Grid card. Previously, users would need to go to the Grid card to set the colour and width, and then to each section of the matrix and adjust the border location.
Now, users may adjust the borders for the whole matrix and tweak each section from the same place within the Grid card.
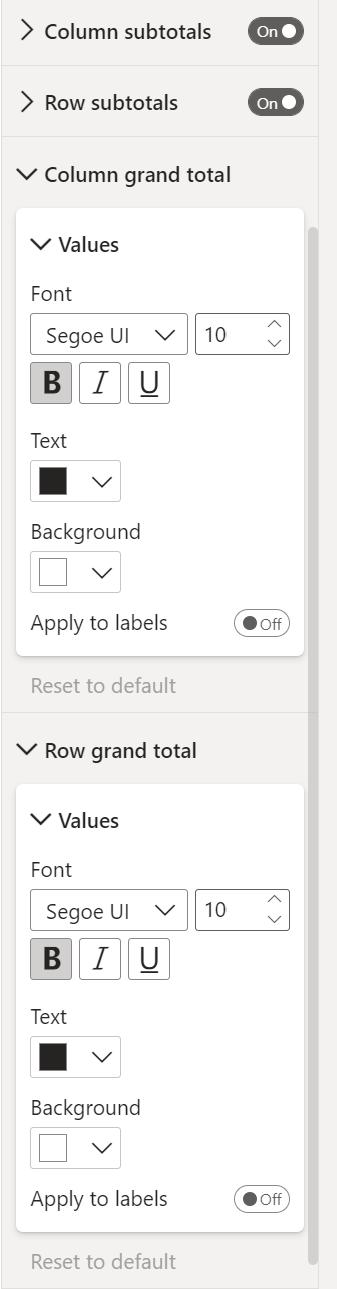
Another improvement is that Power BI now allows you to split the treatment for column grand totals and row grand totals for matrix visuals. Previously, changing grand totals would affect both row and columns.
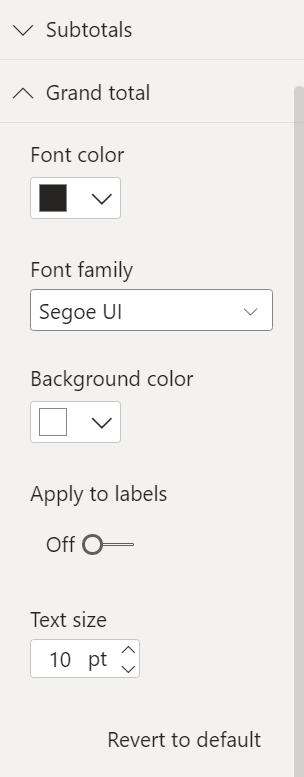
Now, you may format each separately:
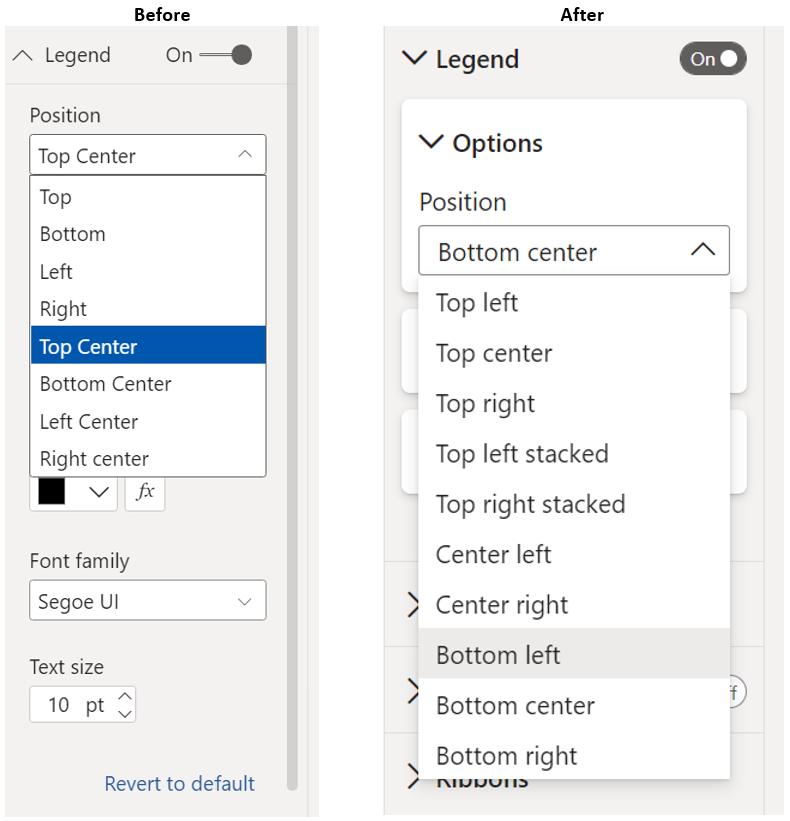
Finally, legend options have been improved with top right and bottom right positioning now permissible:
Check back next week for more Power BI tips and tricks!