
Power BI Blog: Data Point Rectangle Select
16 June 2022
Welcome back to this week’s edition of the Power BI blog series. This week, we look at the ability to multi-select data points.
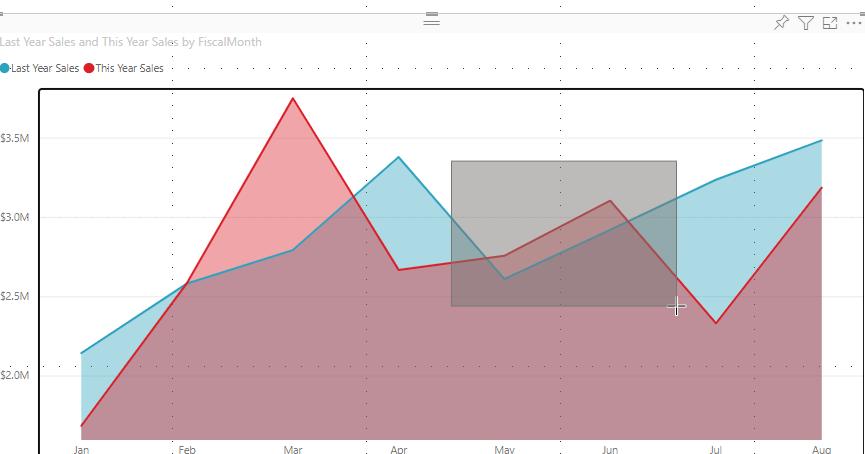
The data point rectangle select (catchy name, don’t you think?) is a Power BI feature that allows you to multi-select data points by clicking and dragging over a supported visual.
When editing a report, you can create a selection rectangle by holding down CTRL and clicking and dragging within a visual. Letting go of the mouse will select all points overlapping the selection rectangle. Your previous selections will be preserved, and already-selected data points will be unselected: it will be as though you held down the CTRL key and individually clicked every single point that overlaps the selection rectangle. You can also click and drag while holding down the SHIFT key instead. This will only add data points to your selection without deselecting any points. As always, you can clear your current selection by clicking an empty space on the plot area (without holding down any key). Additionally, when viewing a report, you may create a selection rectangle by clicking and dragging across a visual, even when you have no other keys held down.
This update also introduces keyboard controls to help you access data point rectangle select even without a mouse. Pressing the ‘S’ key while focused on the plot area or a data point will enter rectangle select mode, displaying a crosshair on the visual. You can move the crosshair using the arrow keys, and speed up that movement by holding down the SHIFT key.
Then, when you’re ready to start drawing the rectangle from your cursor’s position, hold down the SPACE key and use the same crosshair movement controls to create the selection rectangle. The selection is completed once you let go of the SPACE key (you may also now clear selections by pressing CTRL + SHIFT + C).
Do keep in mind that data point rectangle select is available for line, area, scatter, Treemap and map visuals, and that there is a 3,500 data point limit for the number which you may select at once.
Check back next week for more Power BI tips and tricks!