
Power BI Blog: Conference Planning Part 1
28 October 2021
Welcome back to this week’s edition of the Power BI blog series. This week, we look at how to reorganise some data from a table with a single column.
We have a Table visualisation that we have created in Power BI Desktop. It shows the salespeople that we have optimistically allocated to our upcoming conferences in a variety of UK cities.
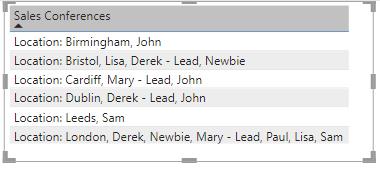
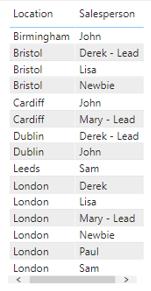
What we have is a table with only one column, and all the data is jumbled together. It would be much easier to work with this data if we could split up the data so that we have the locations in one column and pair this with each salesperson in the second column. Our goal is this:
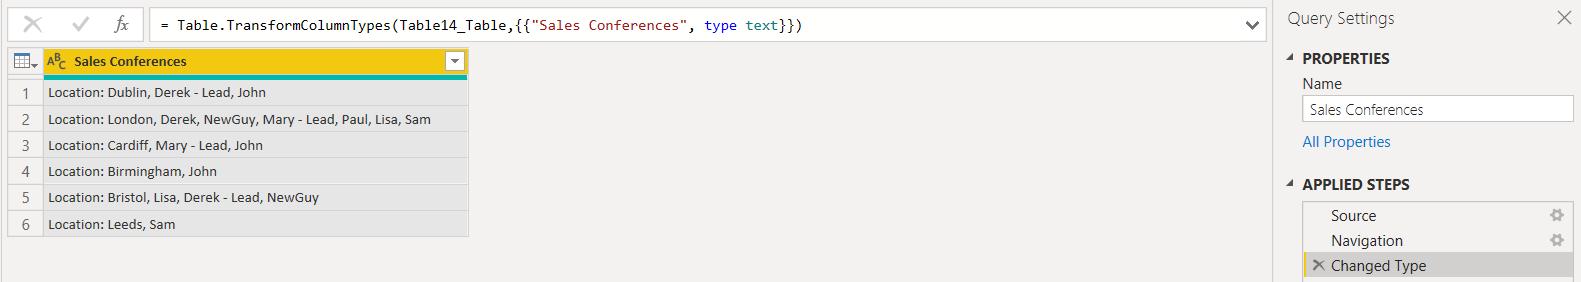
When it comes to transforming data, the Power Query engine is our best tool. The data for this example has been loaded from an Excel Workbook, and we can view the table in its current form via the ‘Transform data’ option on the Home tab.
We want to convert this data into a list of pairings, and the best way to do this is to split by a delimiter. However, we don’t want to actually split the column up at this point, so we won’t be using the ‘Split Column’ on the UI (user interface). Instead, we will be using some M code to enter a step into the formula bar by using the fx button:

The function we will use is:
Table.TransformColumns(table as table, transformOperations as list, optional defaultTransformation as nullable function, optional missingField as nullable number) as table
If we look at the previous step ‘Changed Type’, this generated step uses the same function, therefore we can start with the code from the generated step and use it as a basis for our step:
= Table.TransformColumnTypes(Table14_Table,{{"Sales Conferences", type text}})
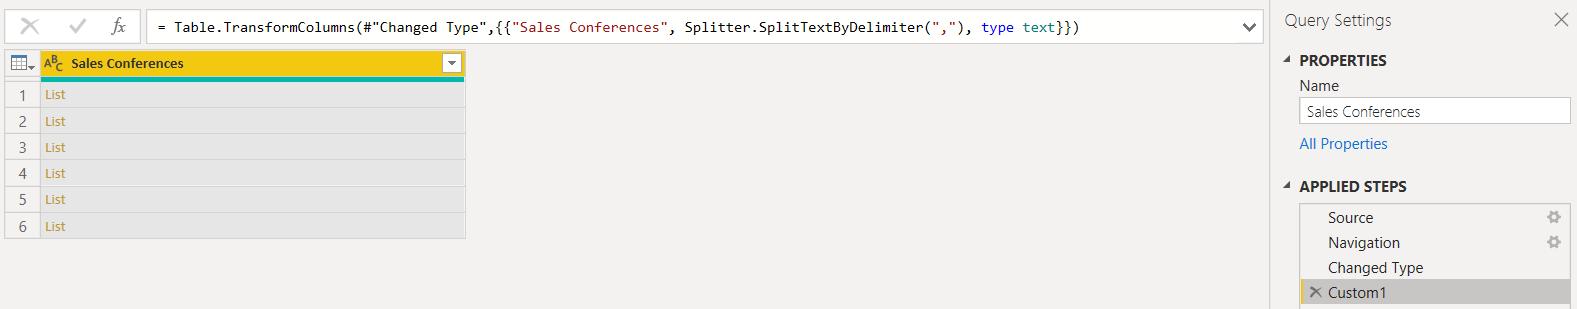
Table14_Table is a reference to the Navigation step as we can’t use this as a step name in formulae. We will use the previous step name “Changed Type”, which has to be preceded by a hash (#) because there is a space in the name. Our new step will add the optional defaultTransformation, which will use the M function Splitter.SplitTextByDelimiter(). We will pass the delimiter which is a comma (,) to this function. Therefore, the step we will enter into the formula bar is:
= Table.TransformColumns(#”Changed Type”, {{"Sales Conferences", Splitter.SplitTextBy Delimiter(“,“), type text}})
Since this will give us more than one value in the column, it converts each column entry into a list as shown below.
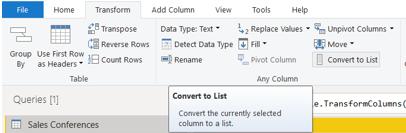
There is no icon to expand the lists, so we are going to employ a trick. To begin, we are going to combine these lists into one long list. The easiest way to do this, is to ‘Convert to List’ from the Transform tab.
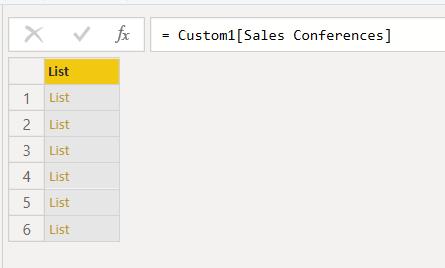
We now have a list of lists:
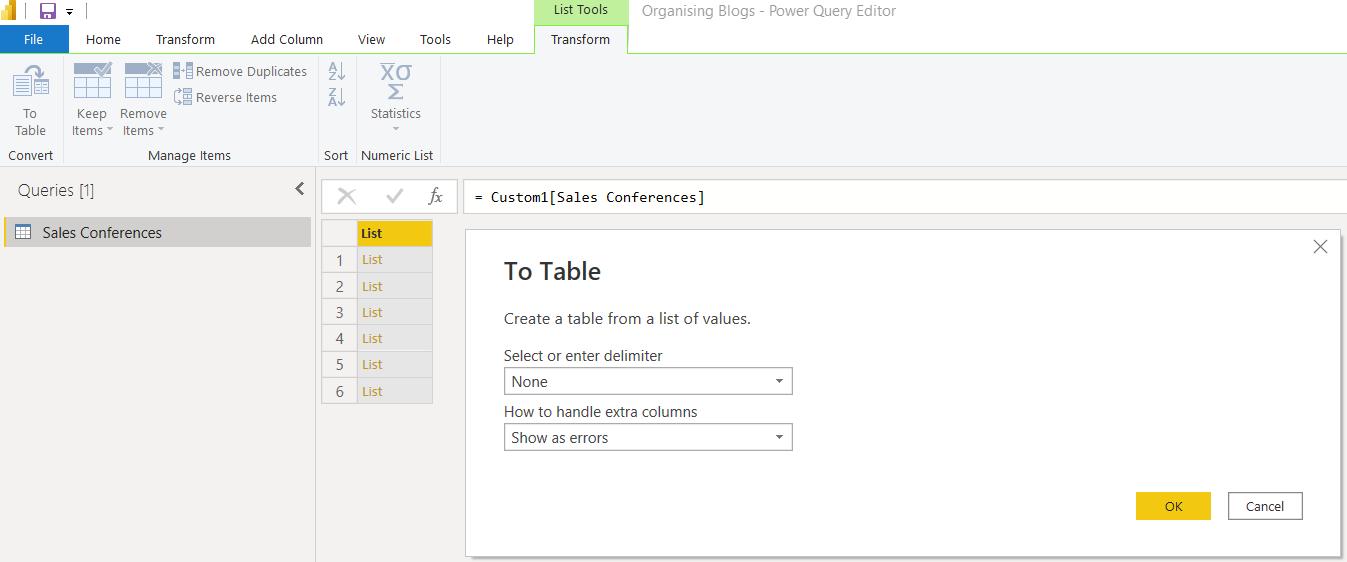
The next step is to convert this back into a table from the ‘List Transform’ tab, which might seem like an odd thing to do, given that we had that a moment ago! However, when we convert to a table, we will have an option we didn’t have before:
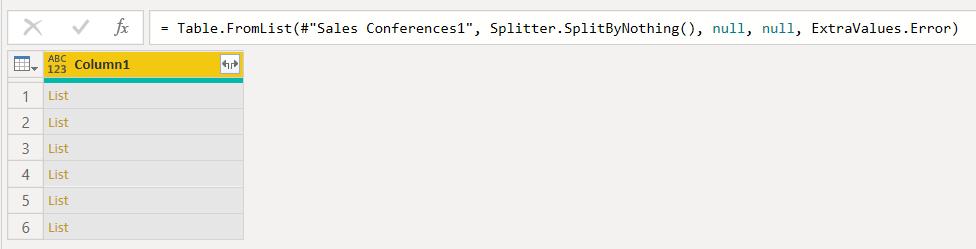
We can take the defaults, and this time, there is an expand icon next to the column heading:
When we click on the expand icon, we have the option to ‘Expand to New Rows’:
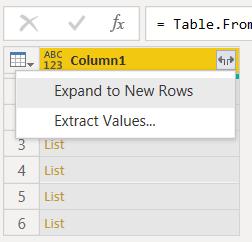
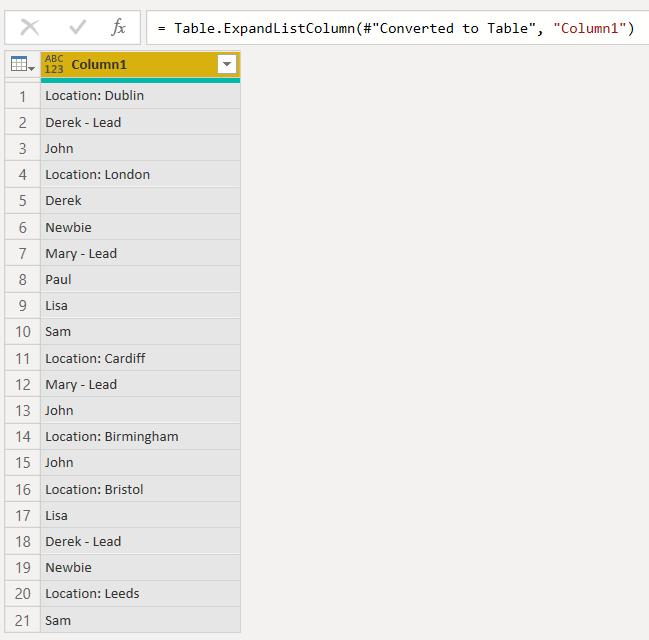
We can now view our data:
In order to extract the sales conference locations, we create a ‘Conditional Column’ from the ‘Add Column’ tab.
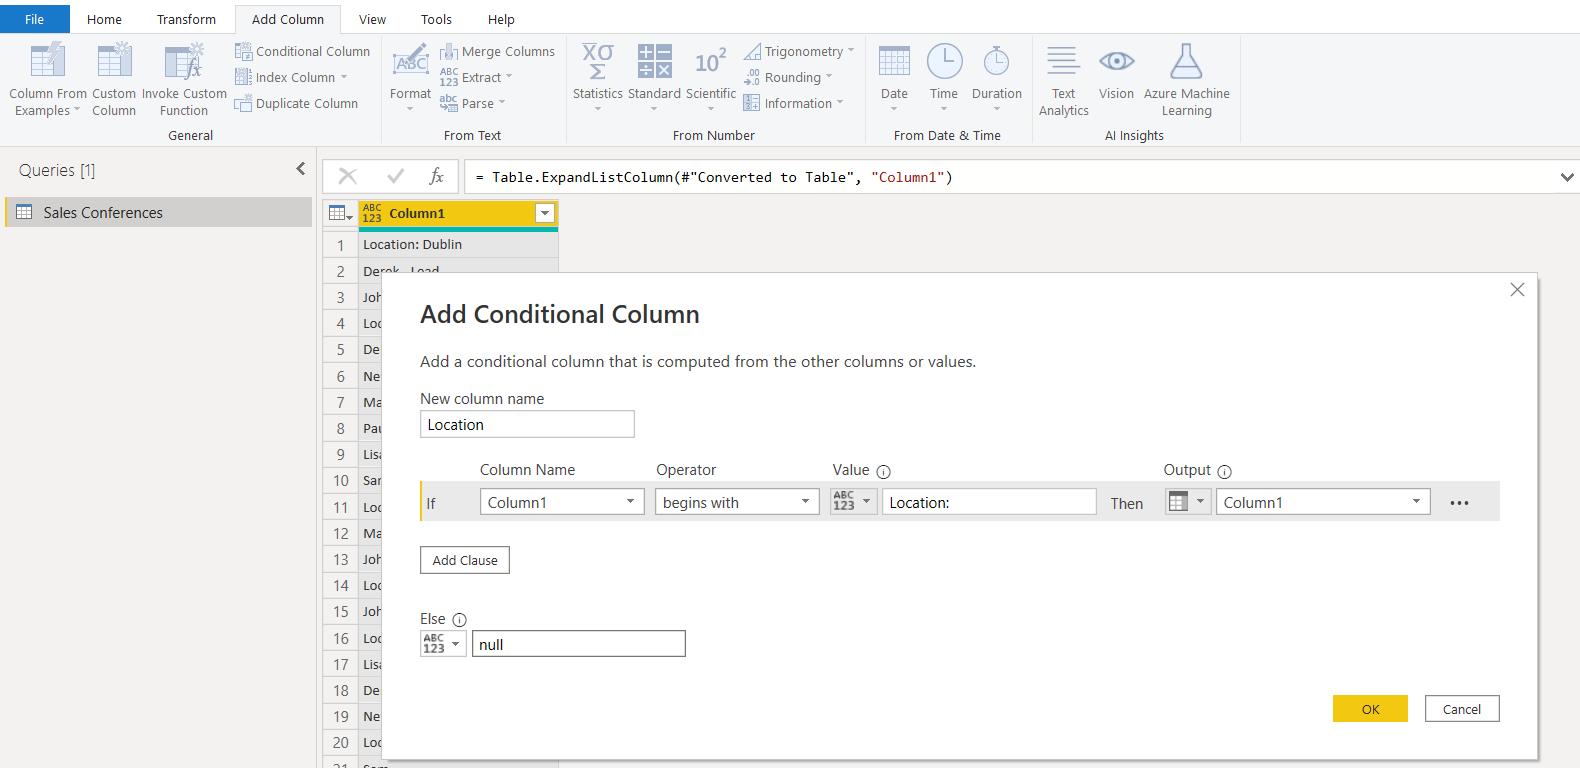
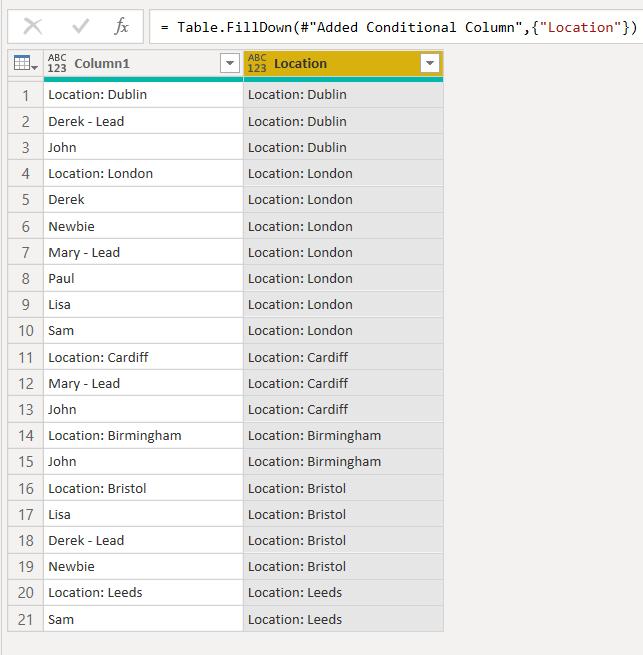
This new column will be populated with the location if the text contains ‘Location:’.
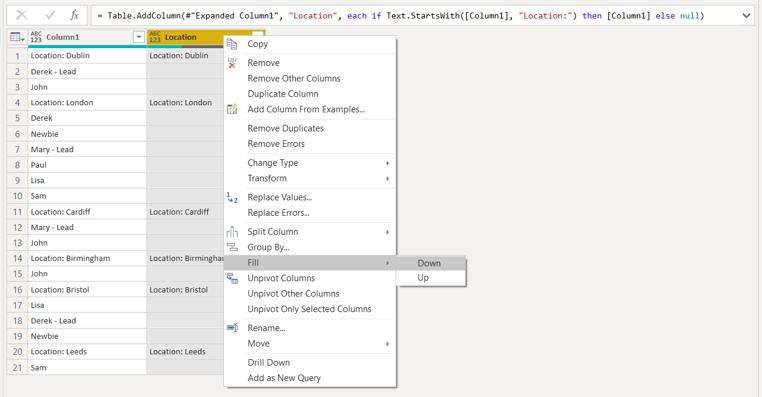
As shown, we can right-click on Location and ‘Fill Down’.
The data is looking much better, next time we will finish transforming the data and load it to Power BI Desktop.
Check back next week for more Power BI tips and tricks!