
Power BI Blog: Just Speculate Over Numbers – Part 8
21 June 2018
Last week we created a data set that hat the lottery combinations by date. What if we wanted to know when they were last drawn?
This basic data analysis is pretty simple – but we have to consider how and what we are going to display.
The Power Query Editor has some great transformation tools which we have already touched upon. We can use Group By tool to get this information really quickly and easily. Using the operation Min on the Draw Date we can get the information really quickly.
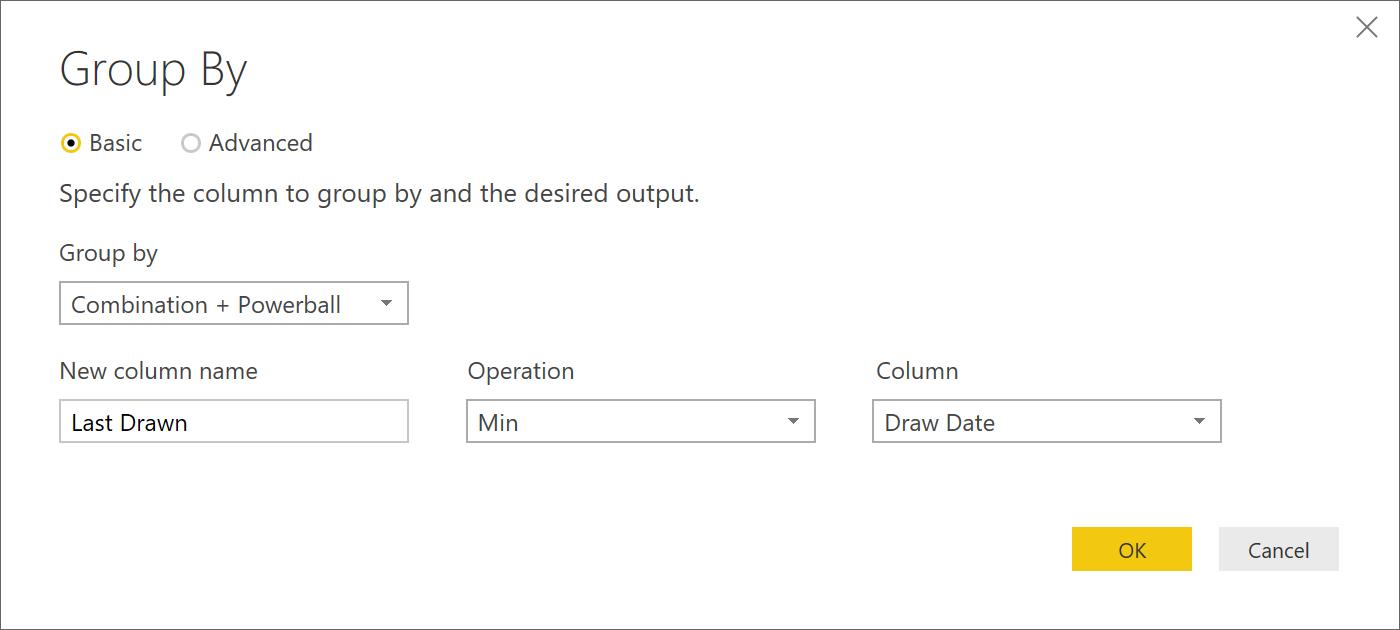
The draw back of this is that in order to calculate the last draw date of any other Combination, then we’d have duplicate and create new queries in order to do so. Plus, this will be done over the whole data set?
But what if we wanted to know when it was last drawn over a specific period in time? This is where we can get tricky with DAX and slicers!
For this example, I’m going to focus on the Powerball.
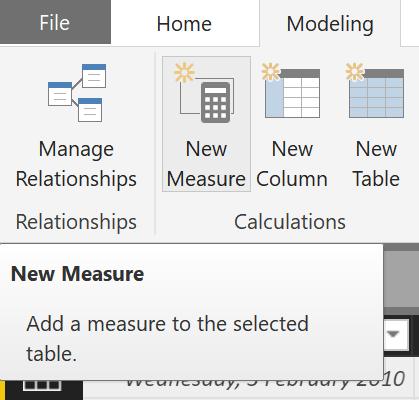
Let’s create a measure called “Powerball Last Drawn”. To create a measure, go to the “Data” tab in the Power BI environment. Then, in the Ribbon in the “Modeling” tab under “Calculations” subcategory.
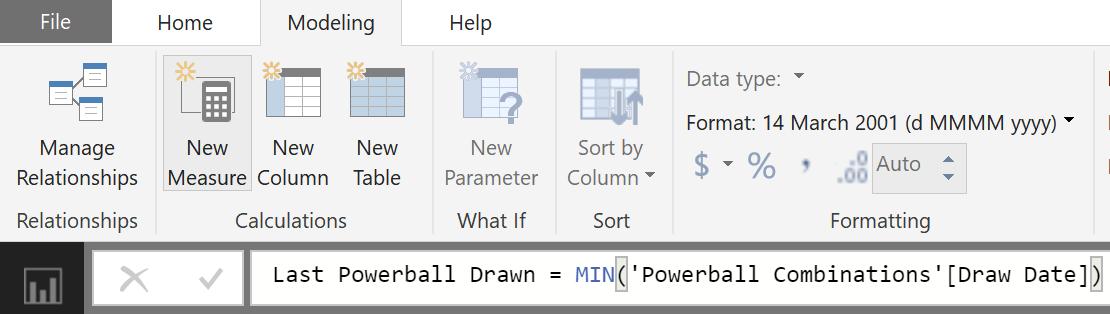
Let’s use the following formula for our measure:
Last Powerball Drawn = MIN('Powerball Combinations'[Draw Date])
After entering this we’re going to change the formatting on the date so it is in my preferred reading format. I’m going to choose “14 March (d MMMM yyyy)”
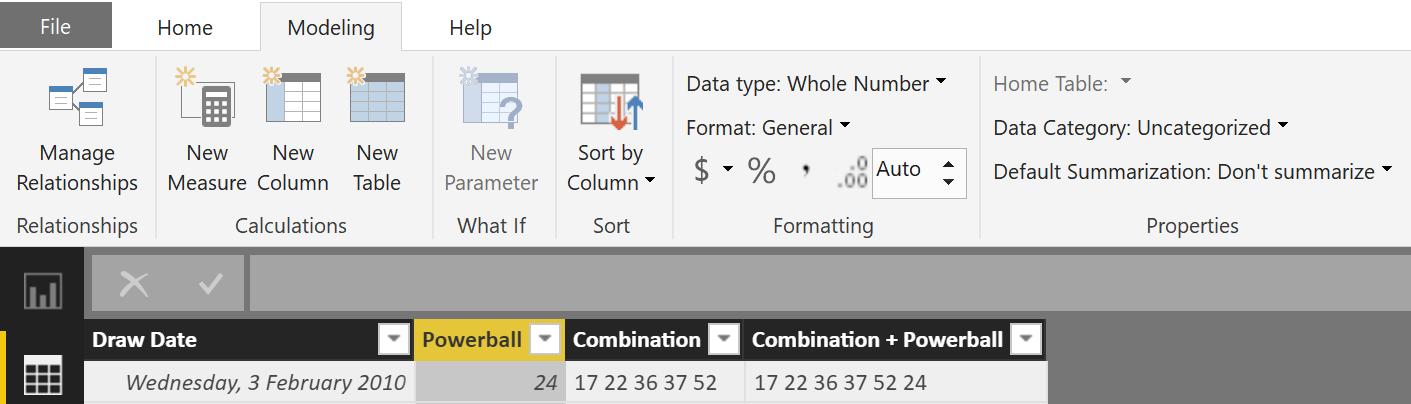
I’ll also ensure that the Powerball columns Default Summarization is set to “Don’t Summarize”, and will display as a “Whole Number”:
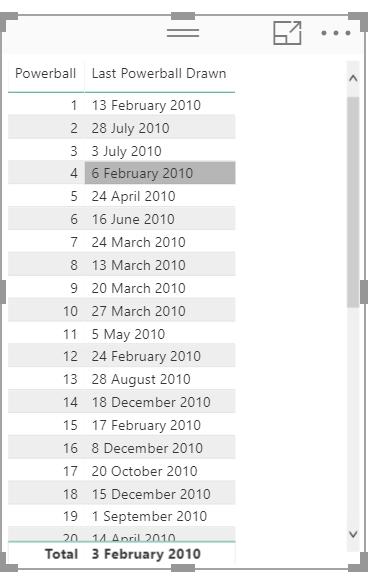
Return to the Report section and quickly put up a table with Powerball and our newly created measure Powerball Last Drawn:
To filter this by date, we can use the “Slicer” visual with Draw Date as the filter.
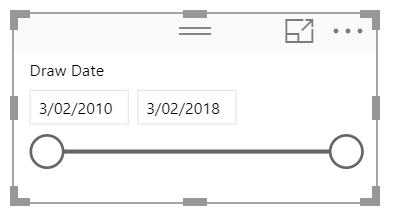
This is a timeline slicer. The user can enter the dates directly or alternatively use the circles to indicate a time period.
However, if we click on the arrow next to Draw Date in the “Field” section of the Slicer, choose “Date Hierarchy”.
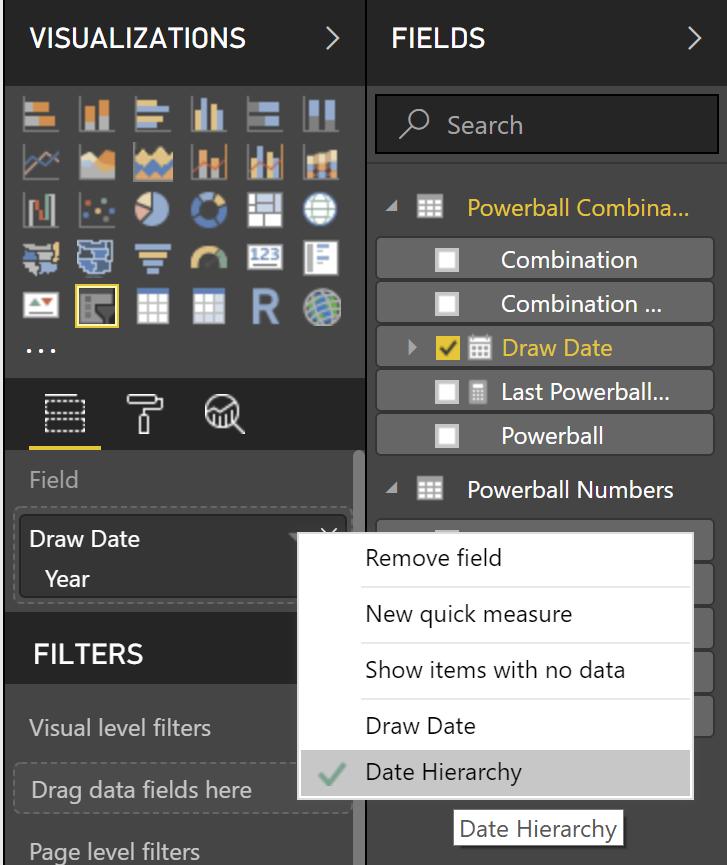
This has now included a year hierarchy and now we can enter years instead of specific days:
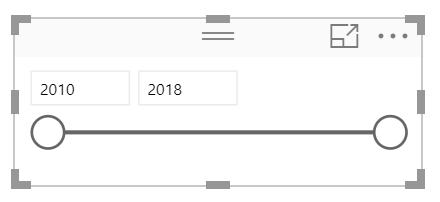
Let’s put in 2015-2018 and see how our table changes:
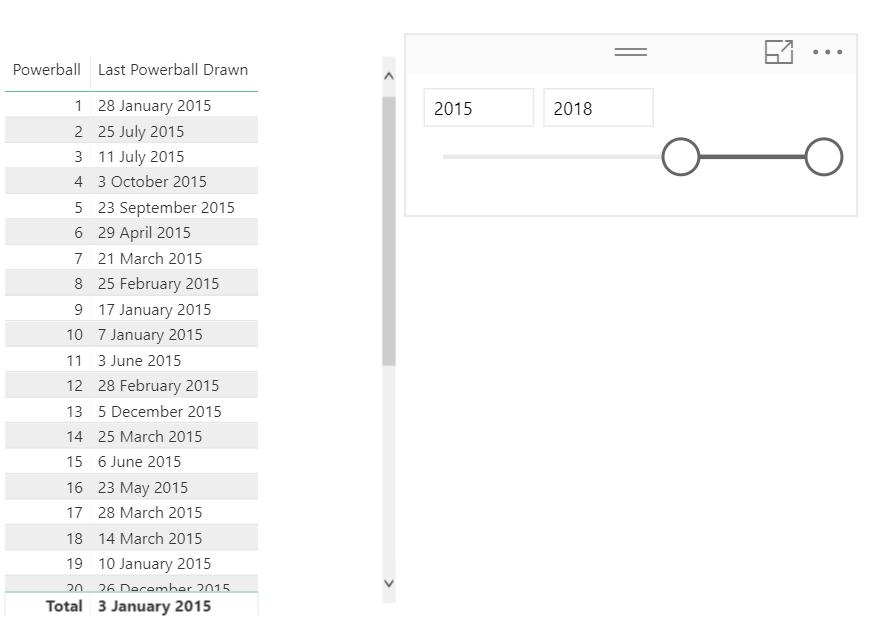
And now the Last Powerball Drawn updates to show the when it was last drawn in the time period selected!
That’s it for this dataset, I hope you enjoyed Just Speculating Over Numbers.
Please find the Power BI file attached here.
Tune back next week for more Power BI Tips!