
Power BI Blog: Just Speculate Over Numbers - Part 7
14 June 2018
Last week we went ascertained which numbers were drawn most frequently.
In Powerball we know that the first five numbers are the regular balls and the sixth ball is the Powerball.
But how would we find out which combinations of regular numbers were drawn most frequently? That’s less straight forward if our numbers weren’t already sorted. How does that stack up against the combination with the Powerball?
If we had data that only had numbers drawn out in each position - what we would need to do, is sort all the numbers drawn regardless of position and use that combination to do our frequency test on.
The procedure would be:
· Retrieve the first five numbers by date
· Sort the numbers
· Create a combination for the sorted numbers with and without the Powerball.
So how would we do this in Power BI?
This is where we would return to the Query Editor. Because we already have a visualisation that is dependent on our Powerball Numbers set – I’m going to Reference the query and rename it to Powerball Combinations.
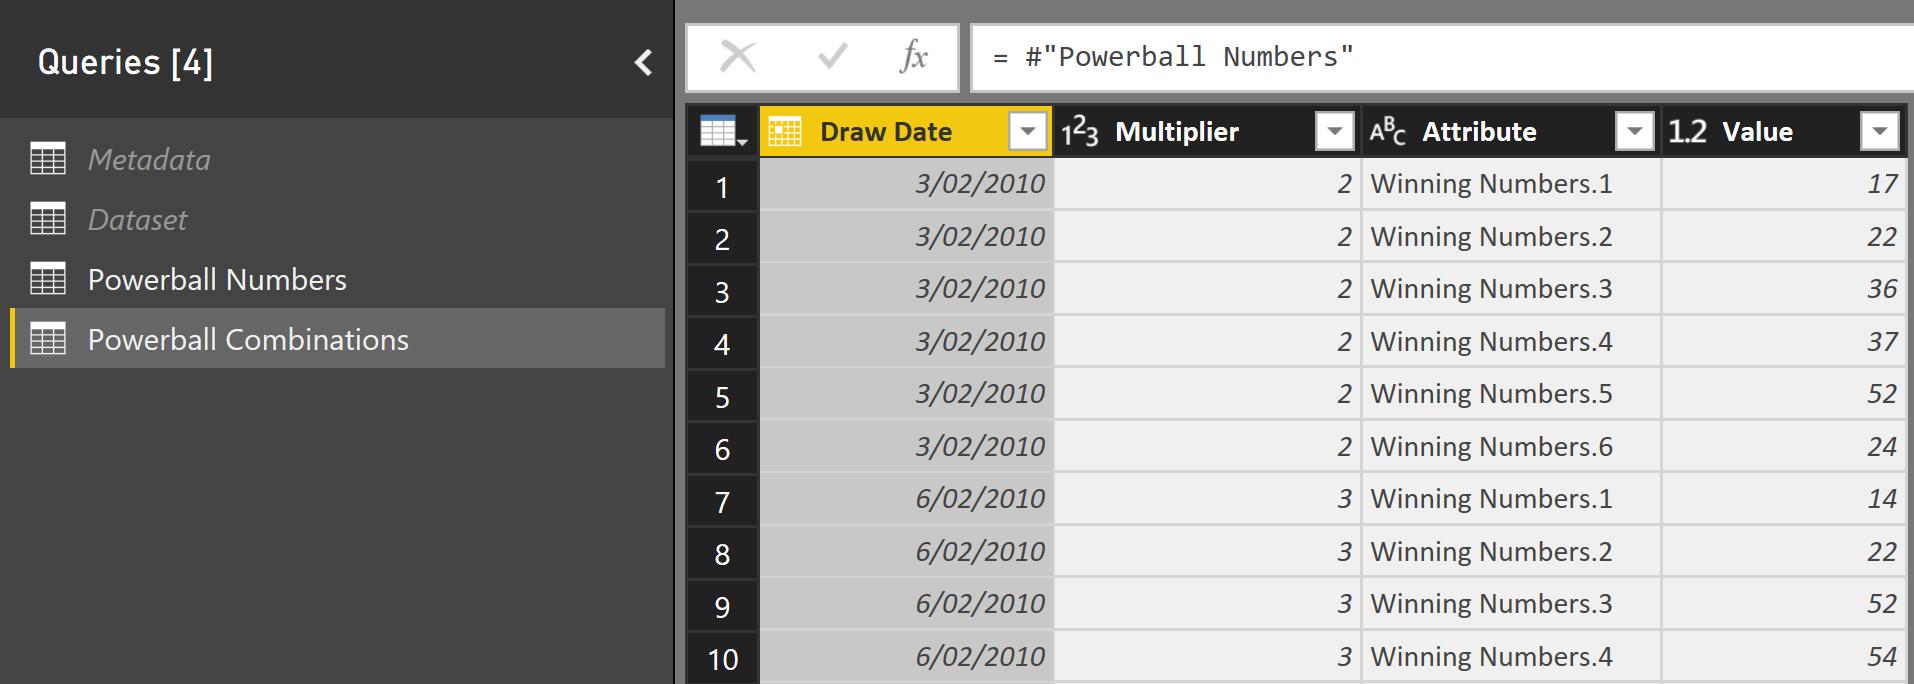
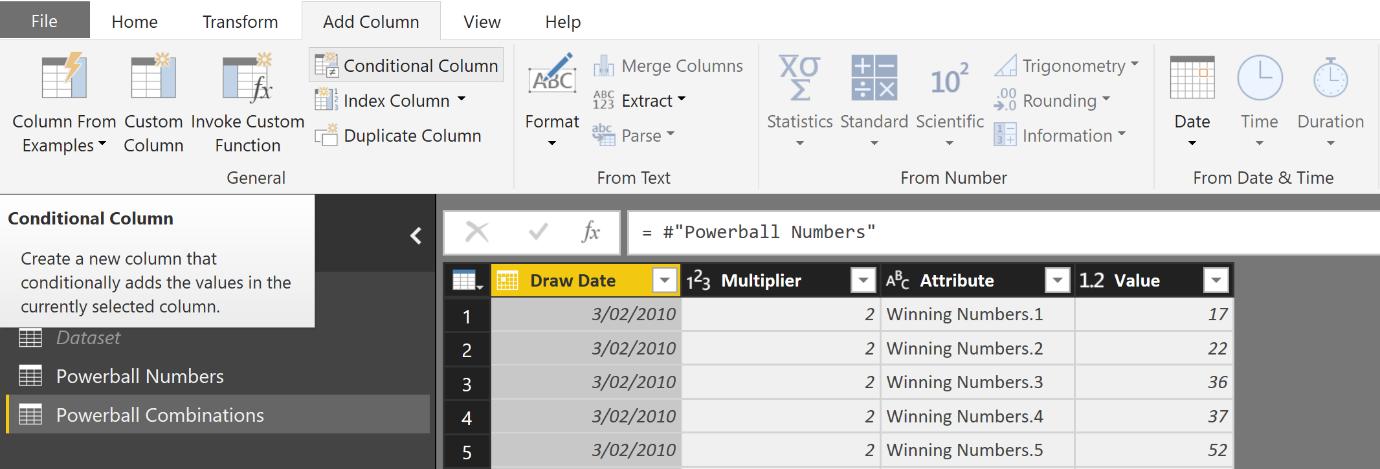
We know that if the Attribute is “Winning Numbers.6”, it is the Powerball, otherwise a regular number. Let’s add a conditional column to do that. This can be found in the Ribbon under the Add Column tab in the General subcategory.
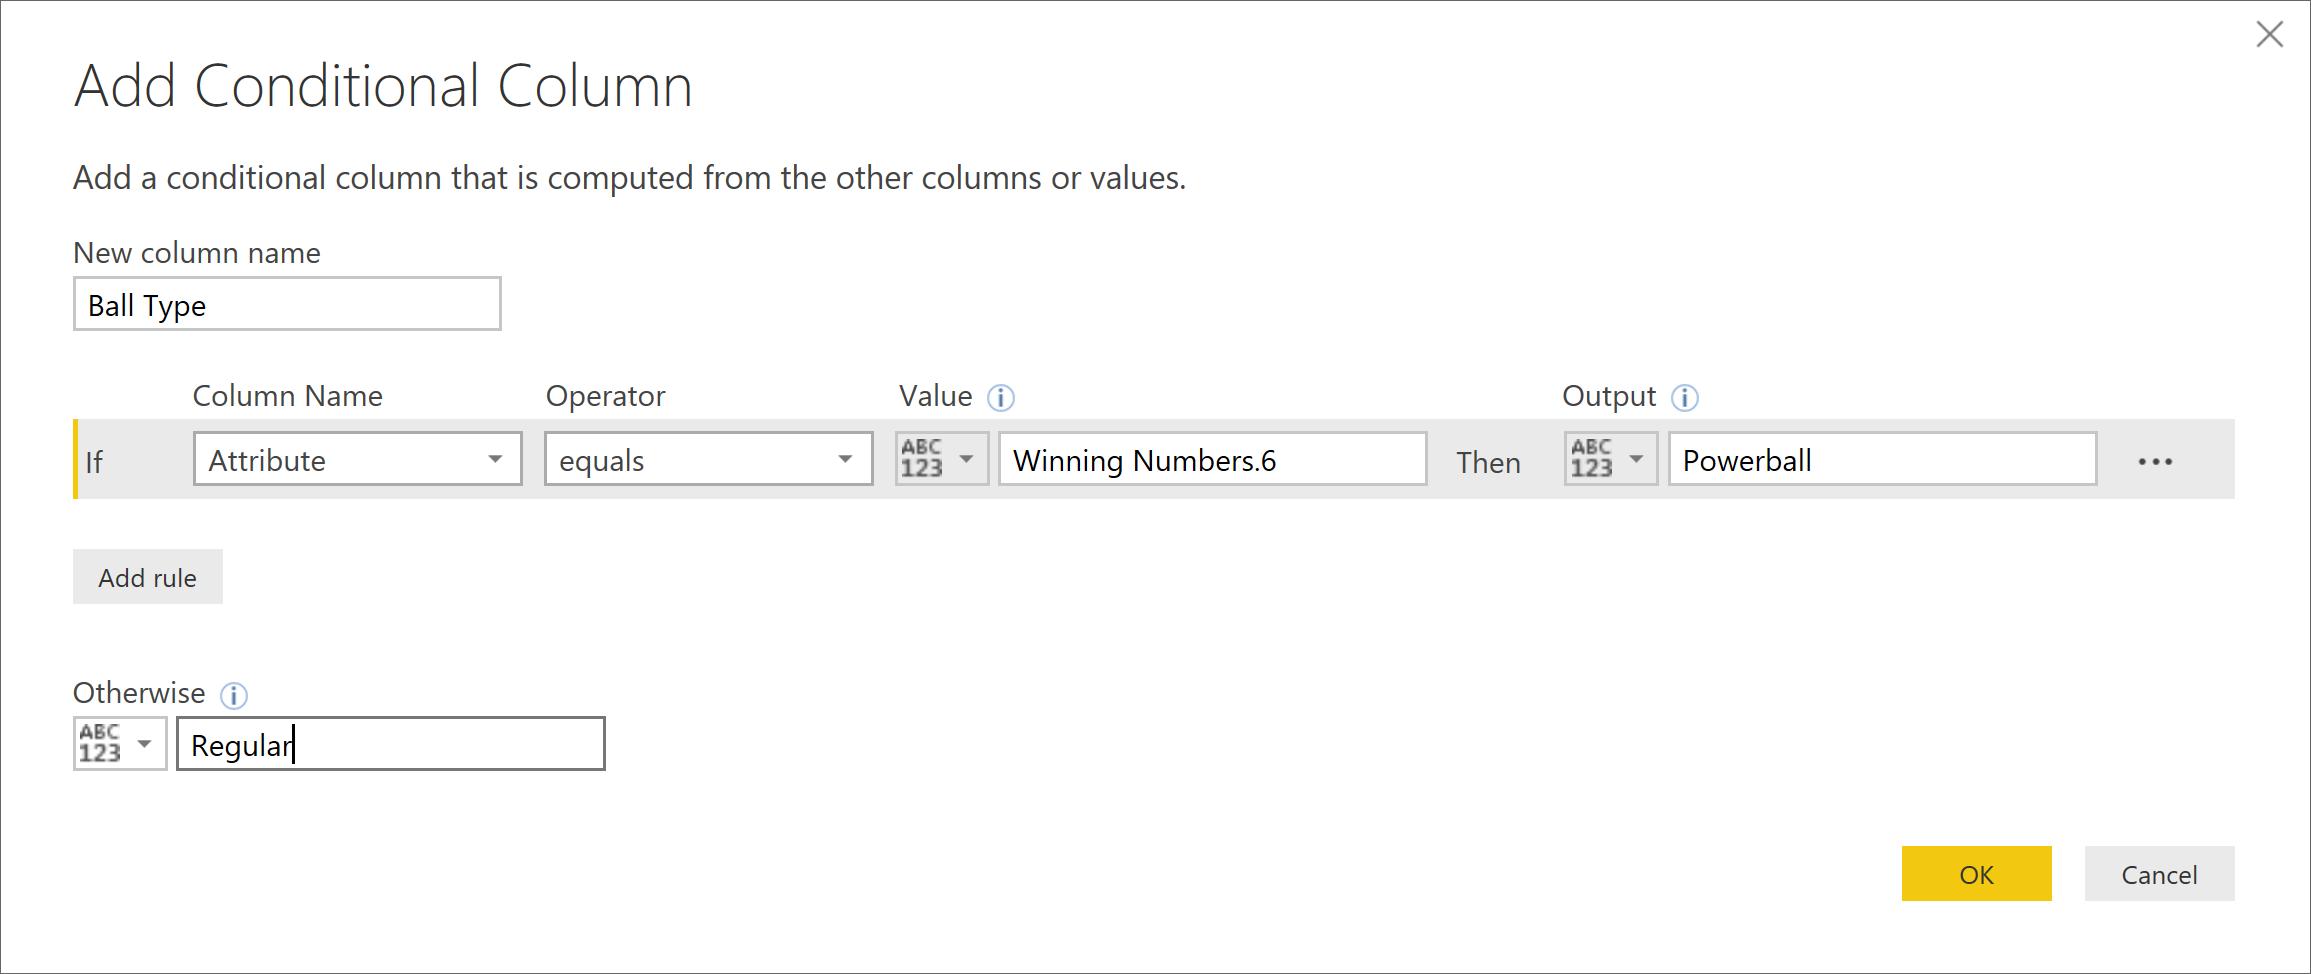
From the dialogue that pops up, we can put our conditions. Create a column called “Ball Type” as follows:
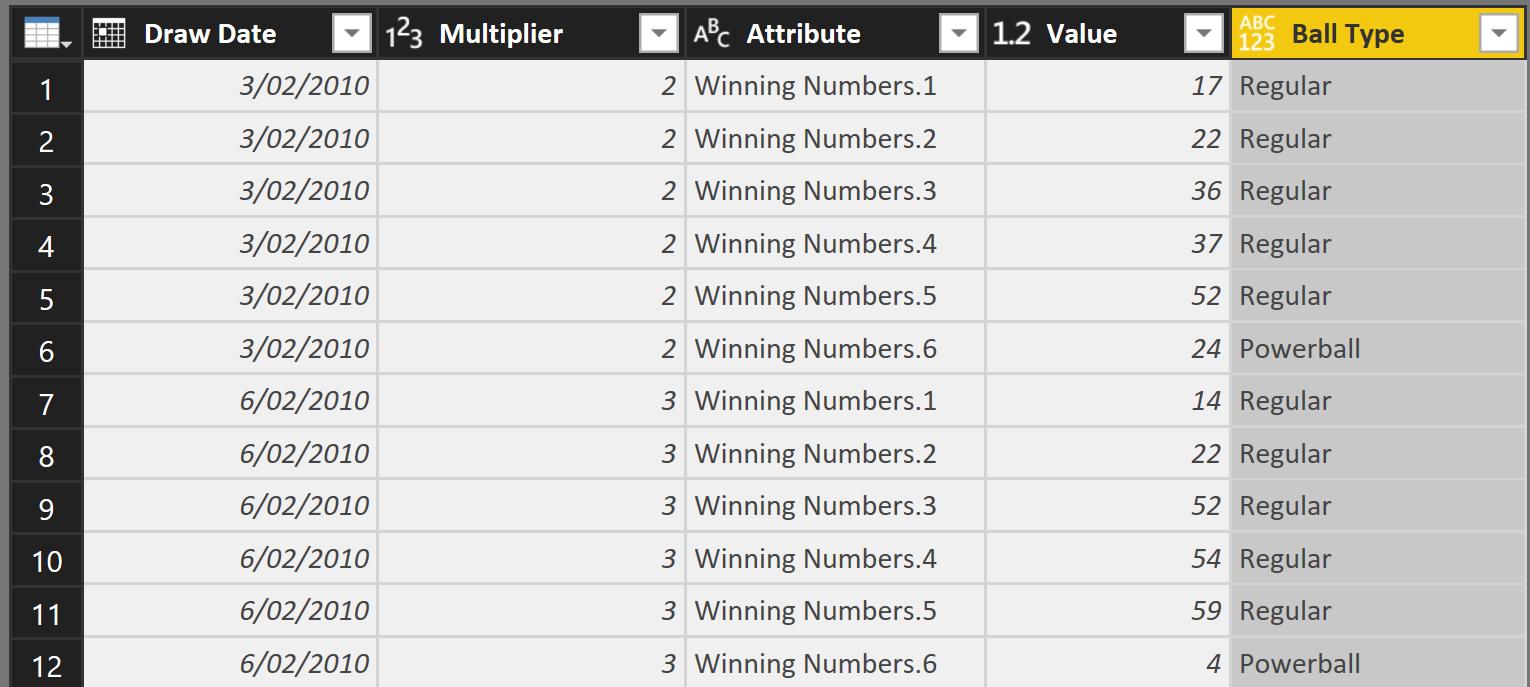
The table should look like this:
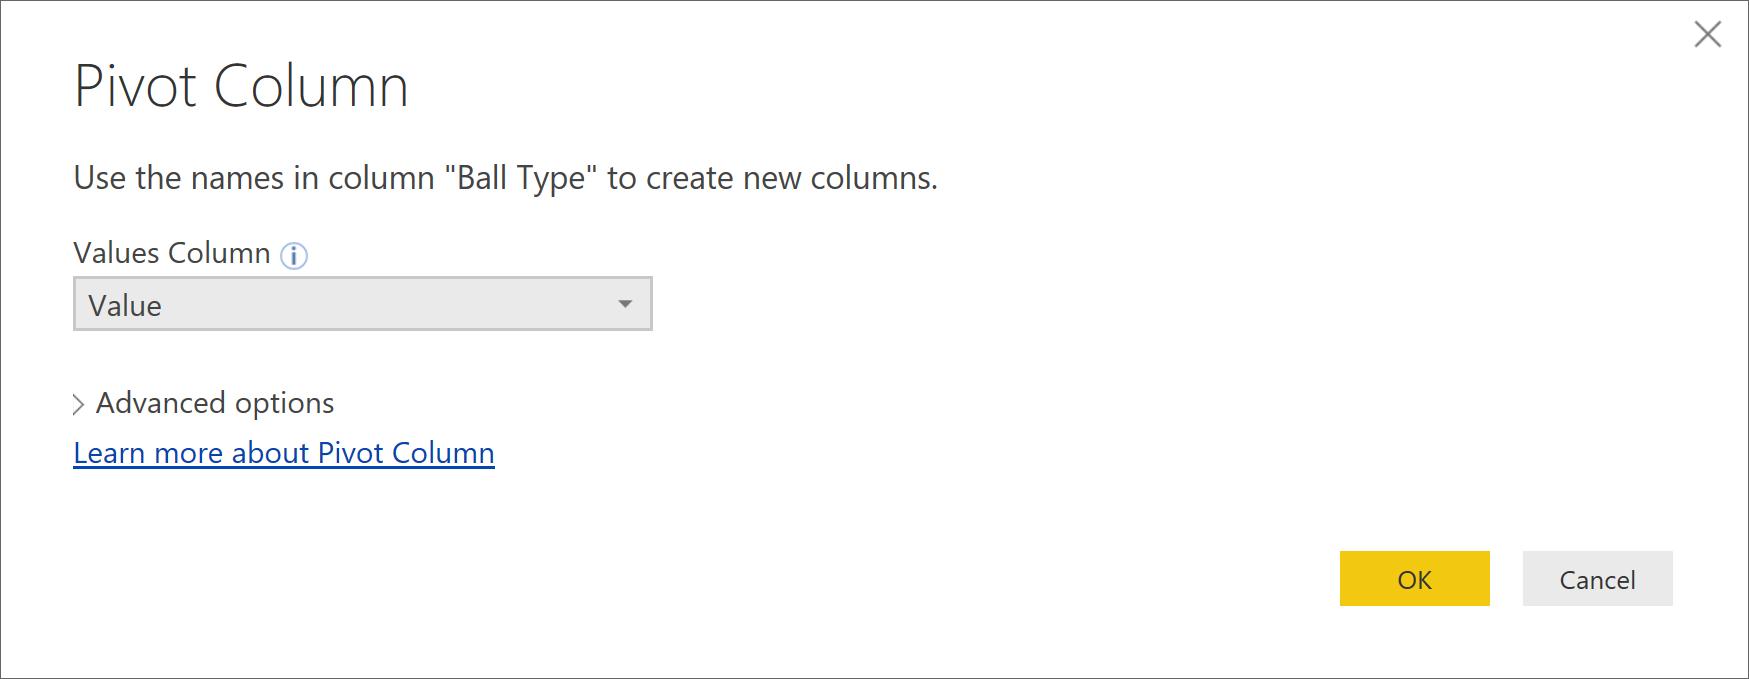
Now I’m going to Pivot the Ball type column so all the Regular numbers are in one column and the Powerball number is in another.

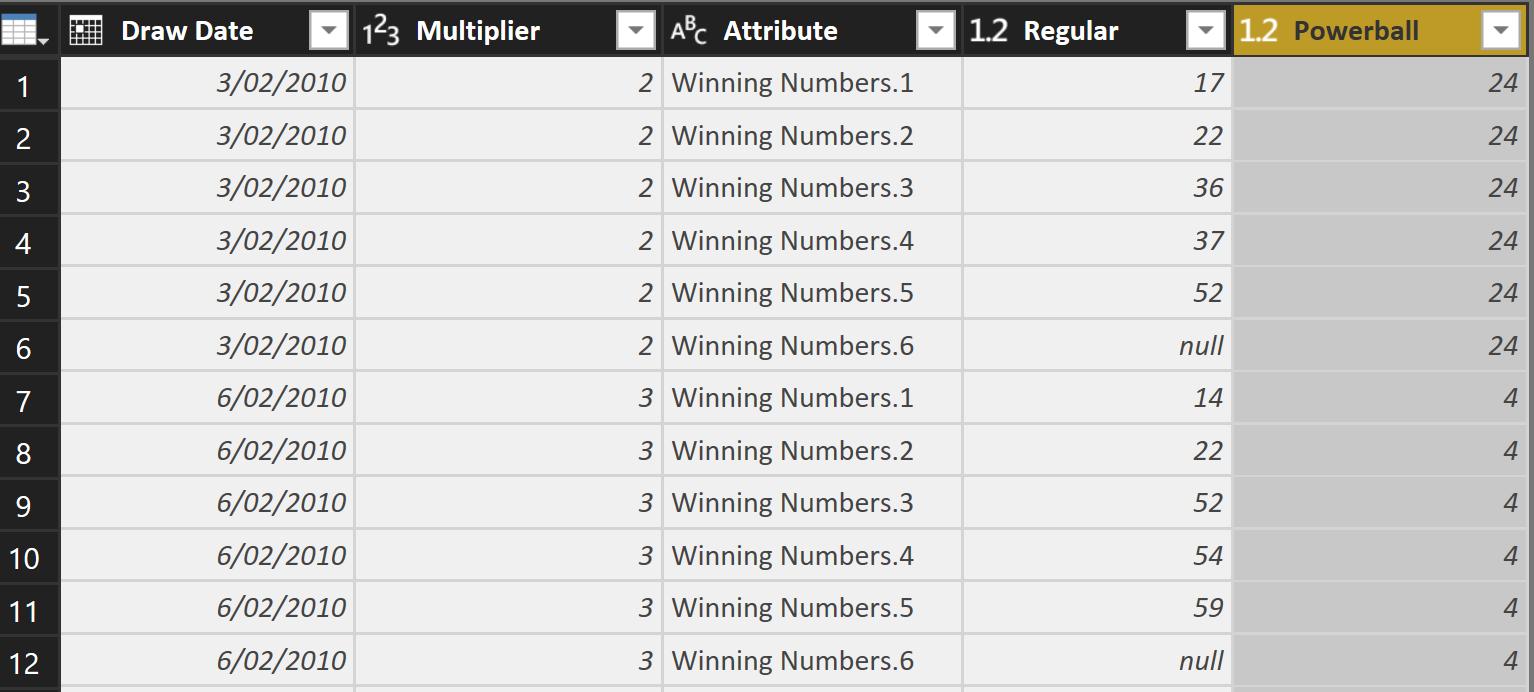
Now, this is where it gets interesting. In order to get all the Regular numbers sorted into a list, I’m going to do a little trick. What I want to do, is group all the rows by date and Powerball and retrieve the regular numbers. But before I can do that, I’ll need to fill the Powerball column with all the numbers by date so it doesn’t group by the null value.
Luckily, the Power Query Editor has a nifty tool called Fill. This is found in the Ribbon under the Transform tab in the Any Column subcategory.
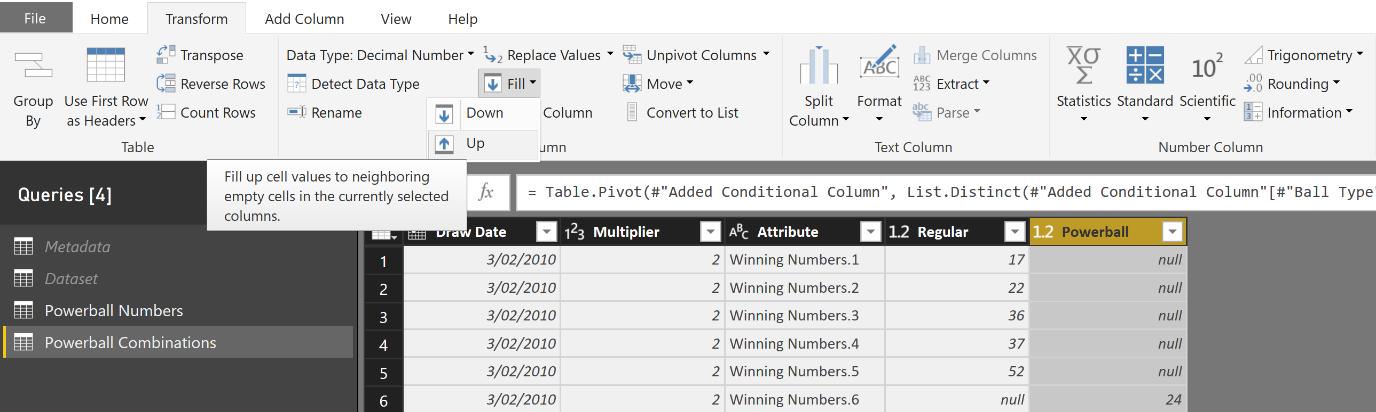
What this will do is fill any null values in a column with a number nearby in the direction required:
Great! It’s time to group our data:
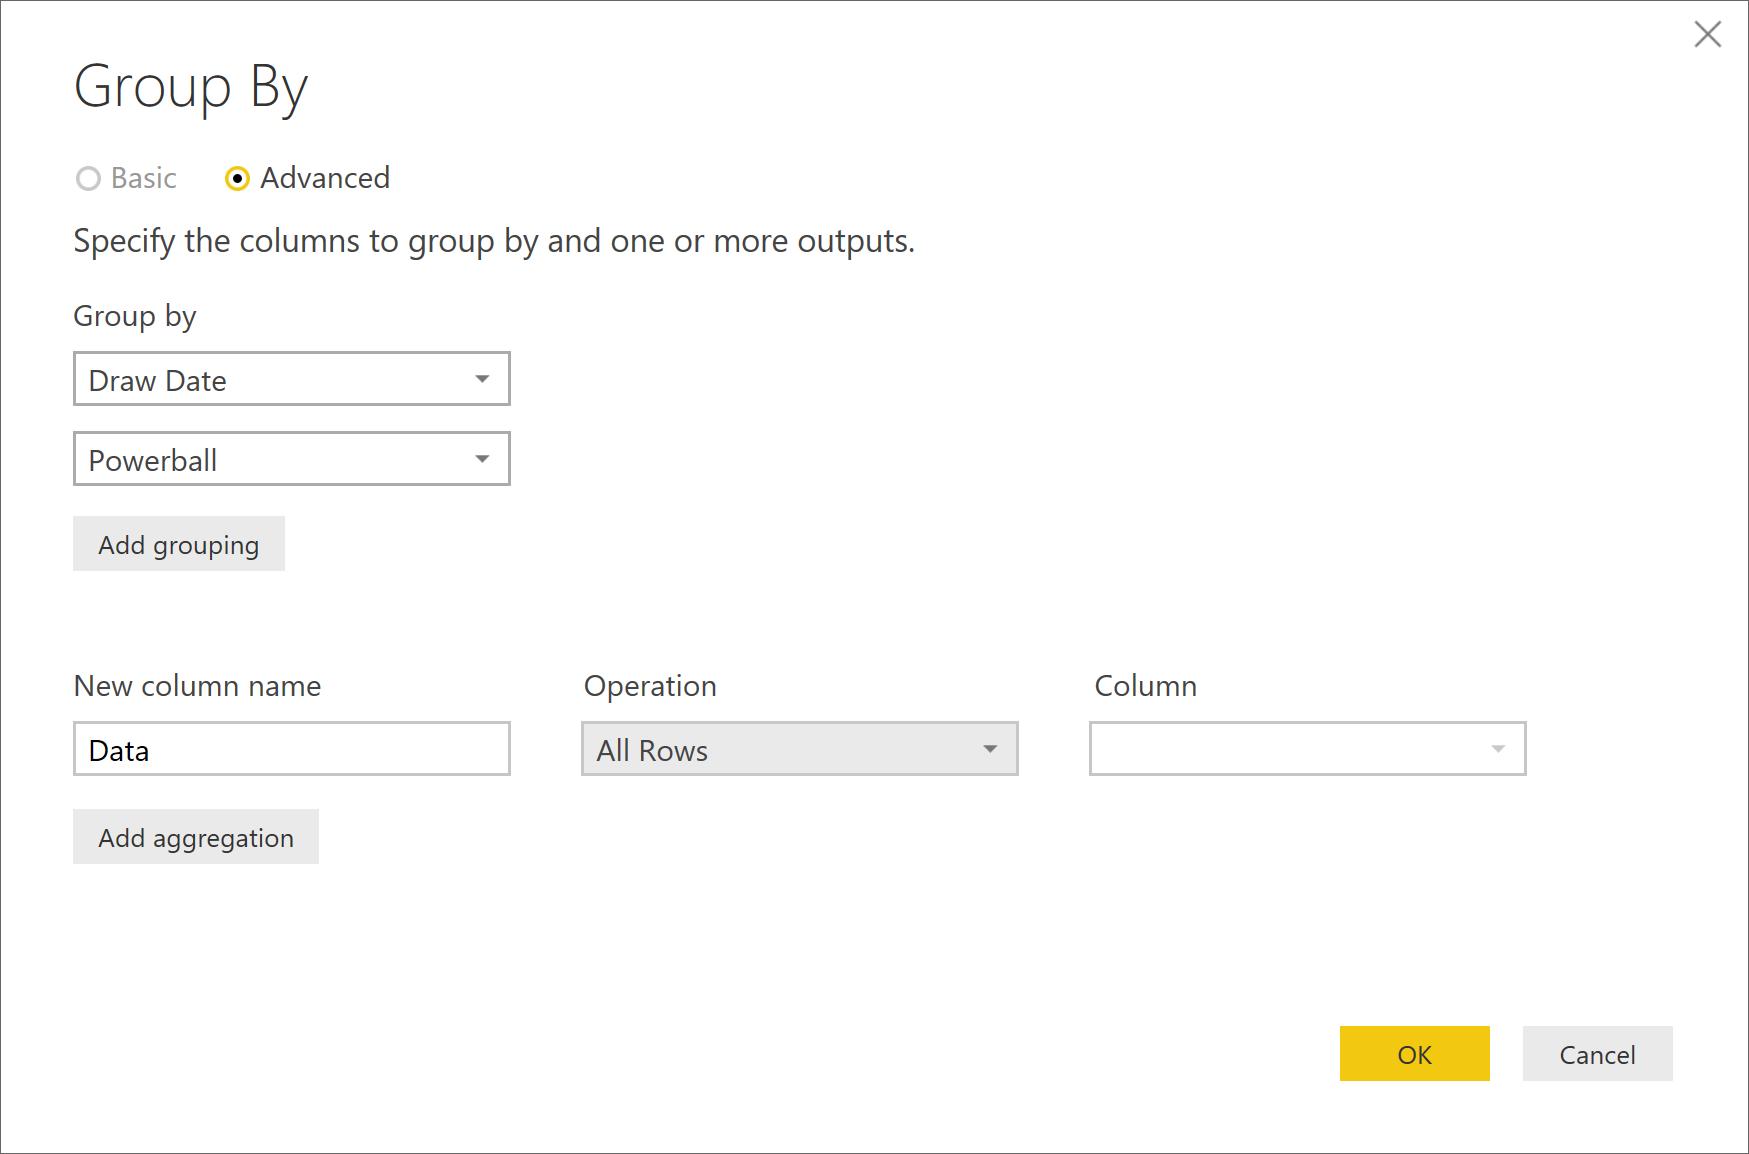
The operation All Rows is a special one. What this does is return a copy of the table where the criteria of the table is filtered by the matching grouped by columns i.e. It will return all the rows where the Draw Date and Powerball are the same.
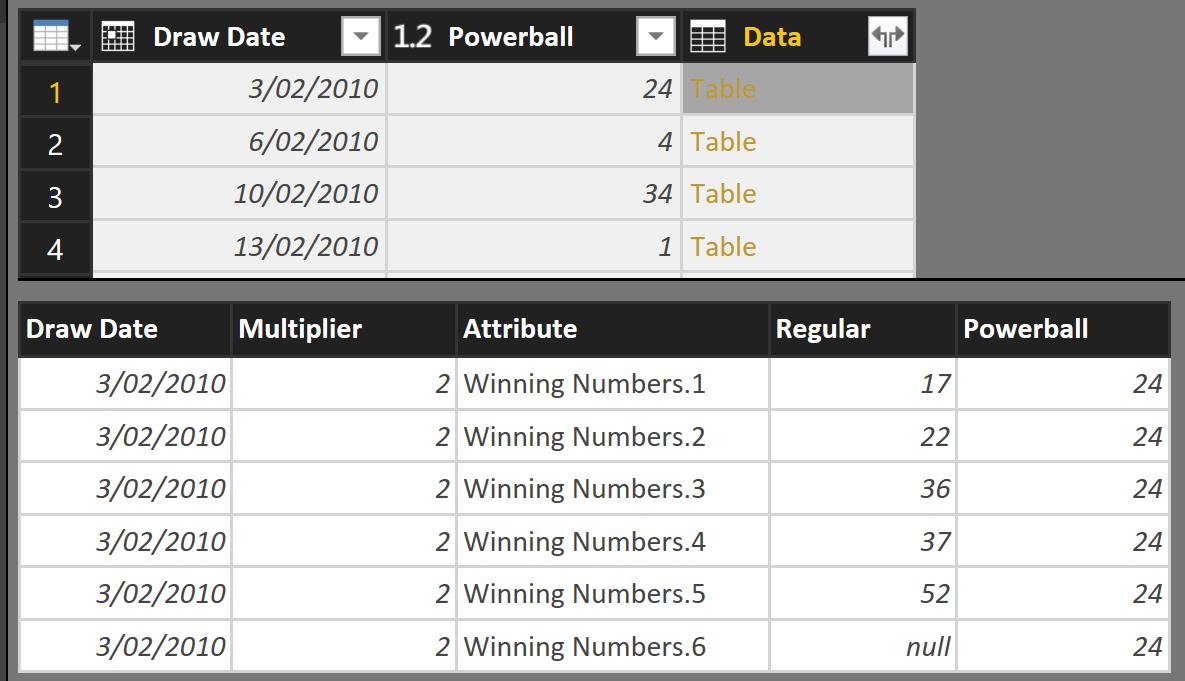
Great! Now all we want to do is get the Regular column.
This where we get a little tricky. We know that type of information in Data is a Table. We can use Power Query’s structured referencing to get just the column.
Add a column called Combination as such:
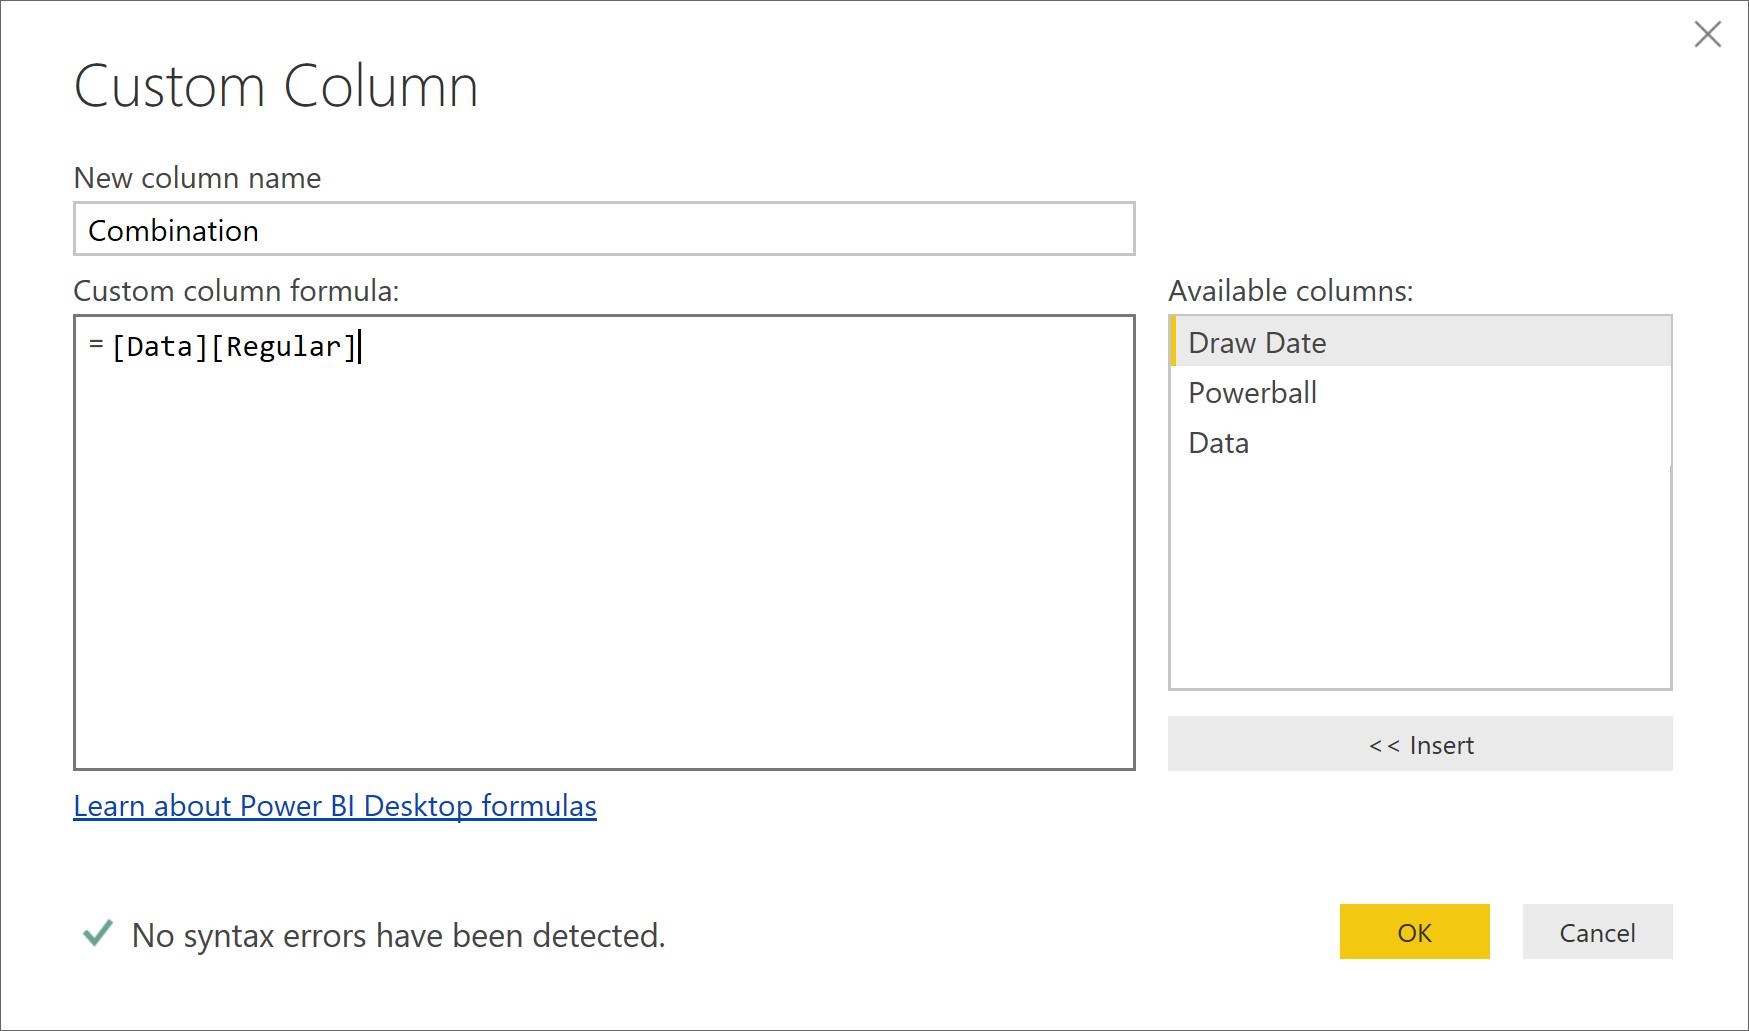
It has given us a List data. Which is the column we’ve requested, the values in the Regular column.
What we can do now is sort this list by using the function List.Sort (read up more about it at the Microsoft Reference library here). Let’s go back an edit our column entry by clicking on the gear icon next to our created step.
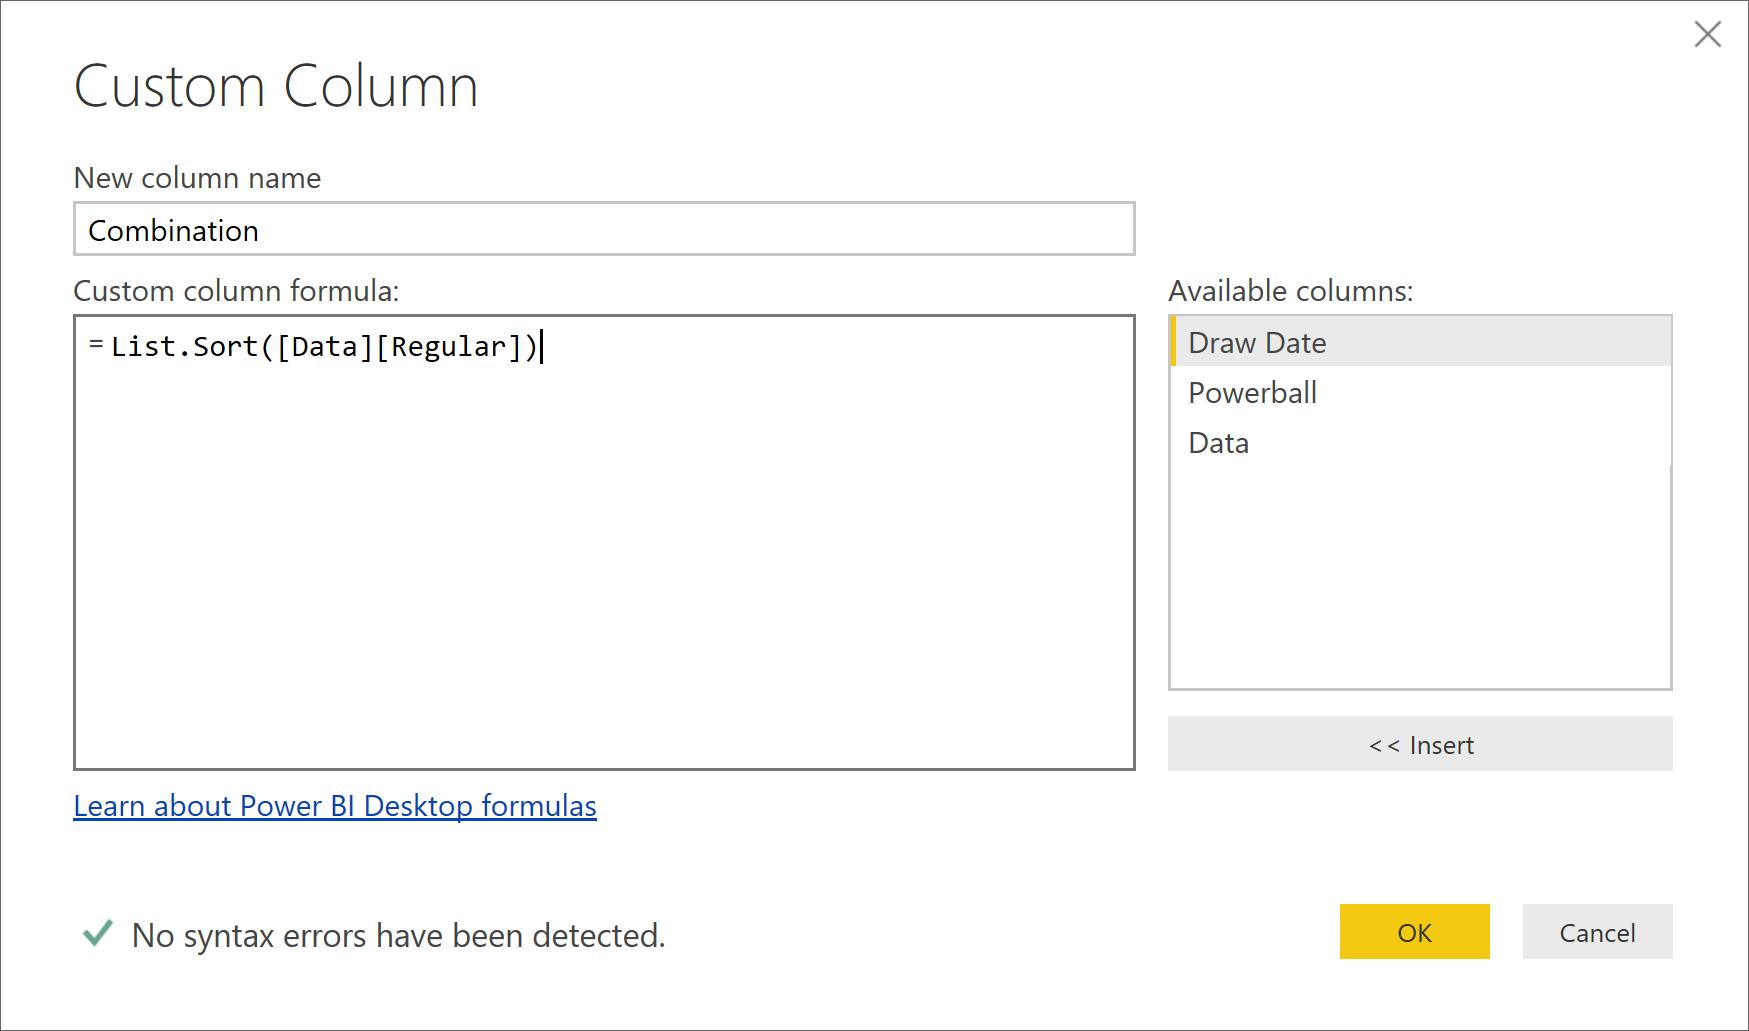
It will now preview like this:
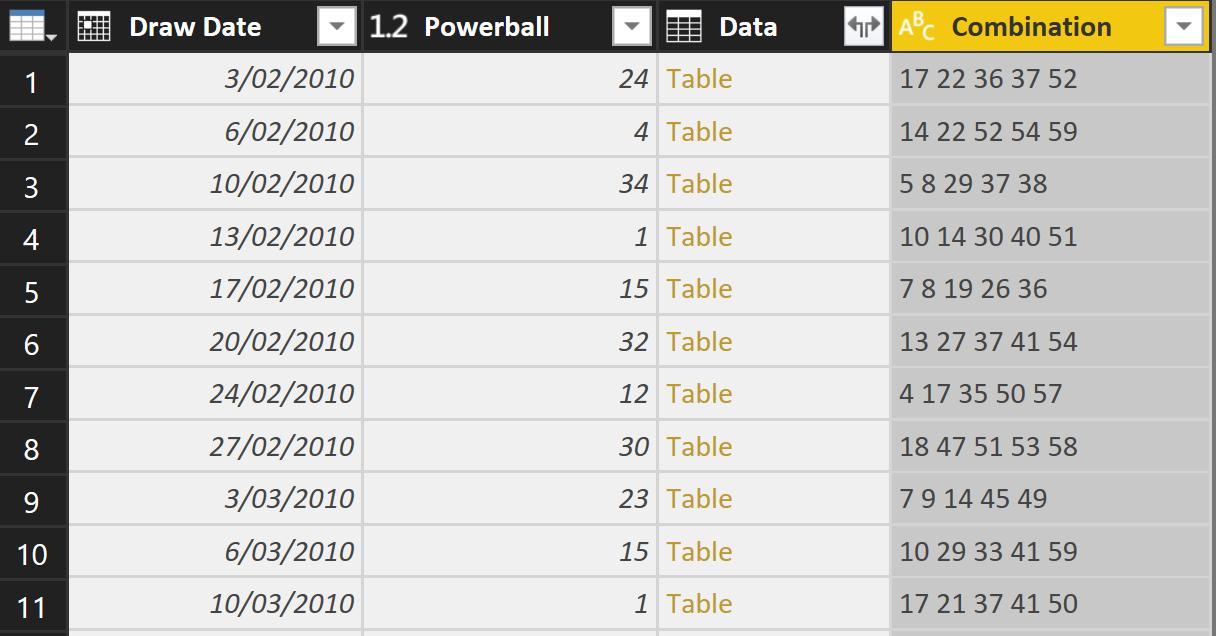
Press the expansion arrow but put a delimiter like a space in between the numbers and let’s see what we get!
I’m going to a couple of things – try and see if you can do it yourself:
- Drop the Data column
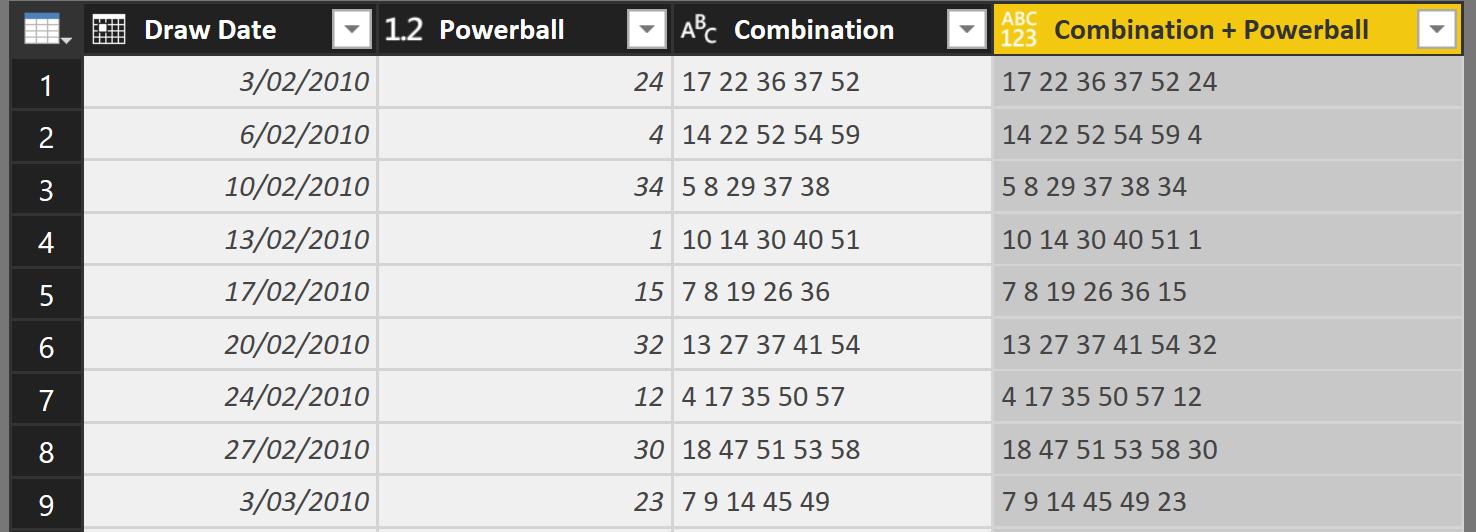
- Add a column called Combination + Powerball where it will be defined as
= [Combination] & " " & Text.From([Powerball]))
The Text.From function is used here because Powerball is a column of numbers, and Power Query will not perform on concatenation on non-text datatypes.
Time to “Close & Apply!”
Next time we’ll go back to the report and put it on our dashboard.
Tune back next week for more Power BI tips.