
Power BI Blog: Field Parameters – Part 3
22 September 2022
Welcome back to this week’s edition of the Power BI blog series. This week, we continue looking at Field Parameters by creating a chart that uses the Field Parameter we have created.
Until recently, allowing users to dynamically change the dimensions and scales on charts in Power BI reports required some serious DAX knowledge. However, since the arrival of Field Parameters, there is a function specifically designed for this purpose. Users may dynamically adjust the measures or columns being analysed in a report by using Field Parameters. Even better, Field Parameters are easy to set up. We just choose the measures or columns the readers would want to change, and this feature can assist report readers to explore and personalise the report output.
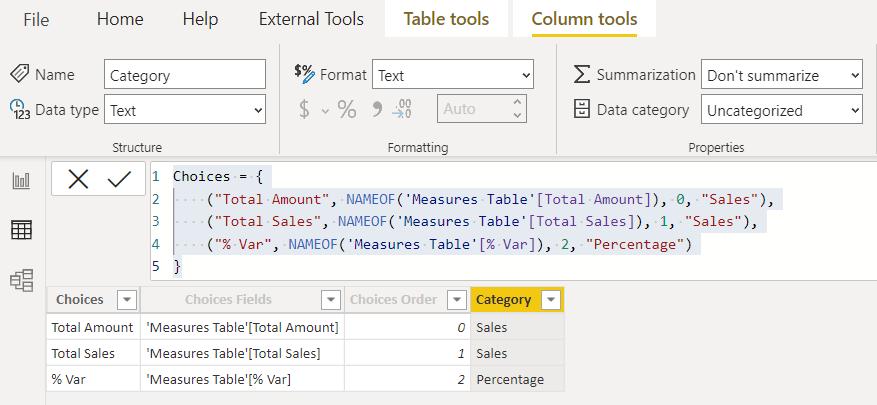
In Part 1, we created our first Field Parameter:

Since the ‘Add slicer to this page’ option was selected, we created a slicer on the page as soon as we clicked on the Create button.

Last time, we looked at the DAX syntax of the Field Parameter and how to edit it.
Now it’s time to use the Field Parameter. We are going to use it for an Area chart:
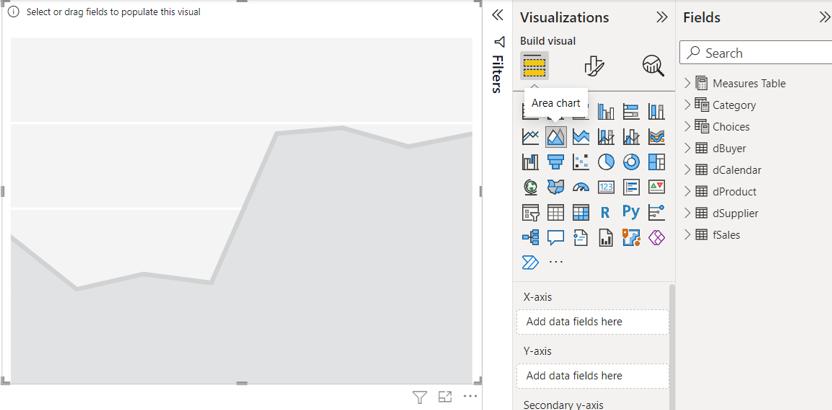
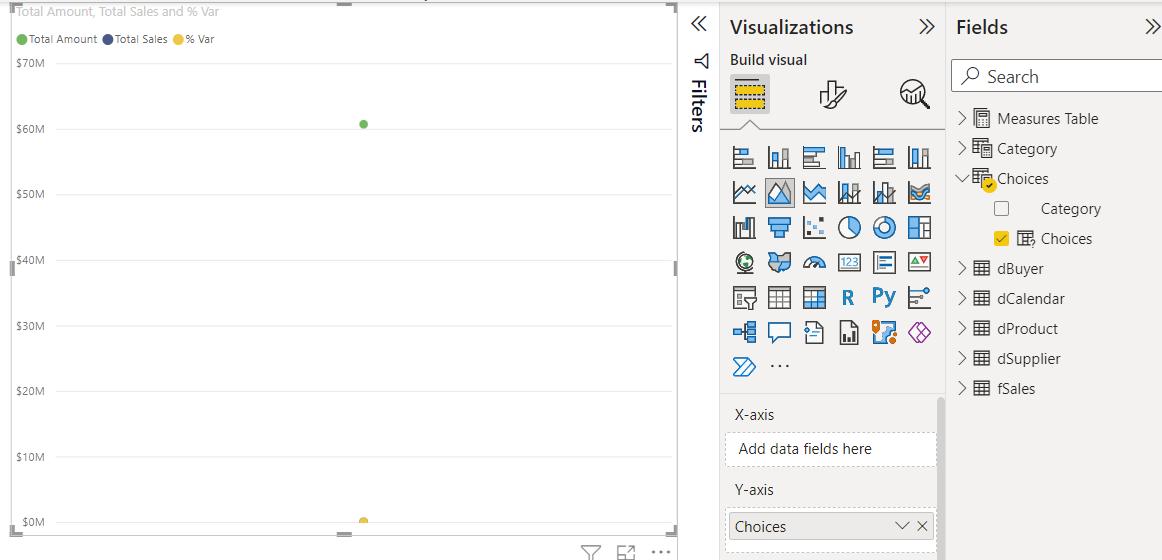
For the Y-axis, we choose our Field Parameter, Choices:
For the X-axis, we choose Start of Month from dCalendar :
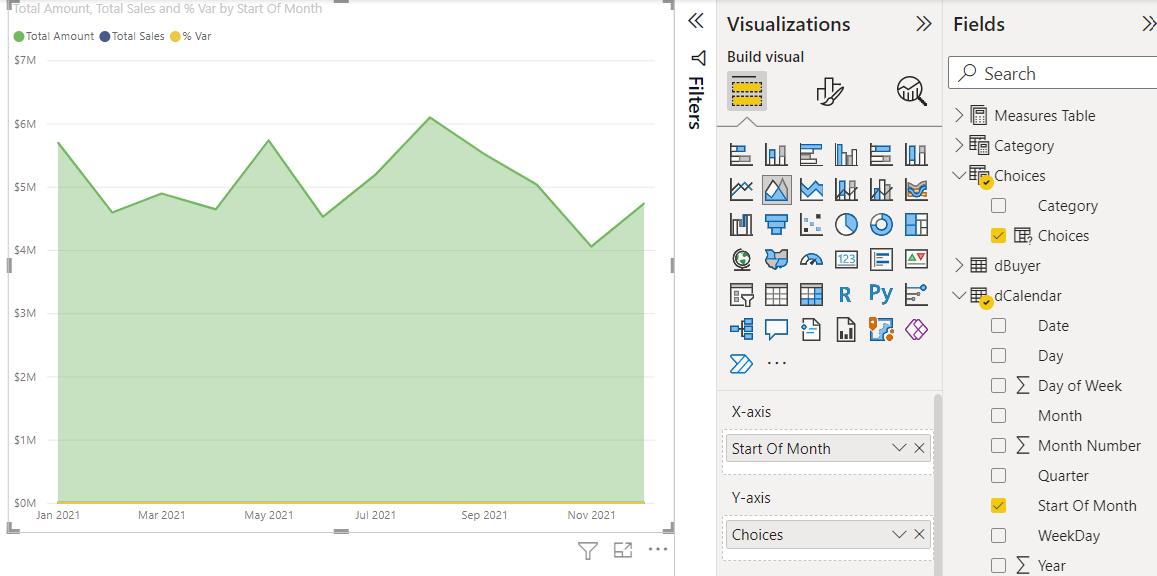
We can then use a slicer populated by Choices, to manipulate the data on the Area chart. Here, we select Total Amount:

Then we can select Total Sales:

Then we may select % Var:

Next time, we’ll look at using two Field Parameters on the same chart.
Check back next week for more Power BI tips and tricks!