
Power BI Blog: Data Hub
7 July 2022
Welcome back to this week’s edition of the Power BI
blog series. This week, we look at the Data Hub.
The Data Hub is the evolution of the Datasets Hub that was announced back in December 2020. In the Data Hub, in addition to Power BI datasets, you can now find the newly released Datamarts, which we will cover next week.
The Data Hub is a central location for data owners, report creators and report consumers to manage, discover and reuse data items across all workspaces:
- data item owners can see usage metrics, refresh status, related reports, lineage and impact analysis to help monitor and manage their data items
- report creators can use the Hub to find suitable items to build their reports on and use links to easily create the reports
- report consumers can use the Hub to find reports based on trustworthy data items.
This was in response to feedback Microsoft received from many customers that users often build similar data repeatedly, resulting in resource overload, governance complexity, and difficulty in identifying sources of truth.
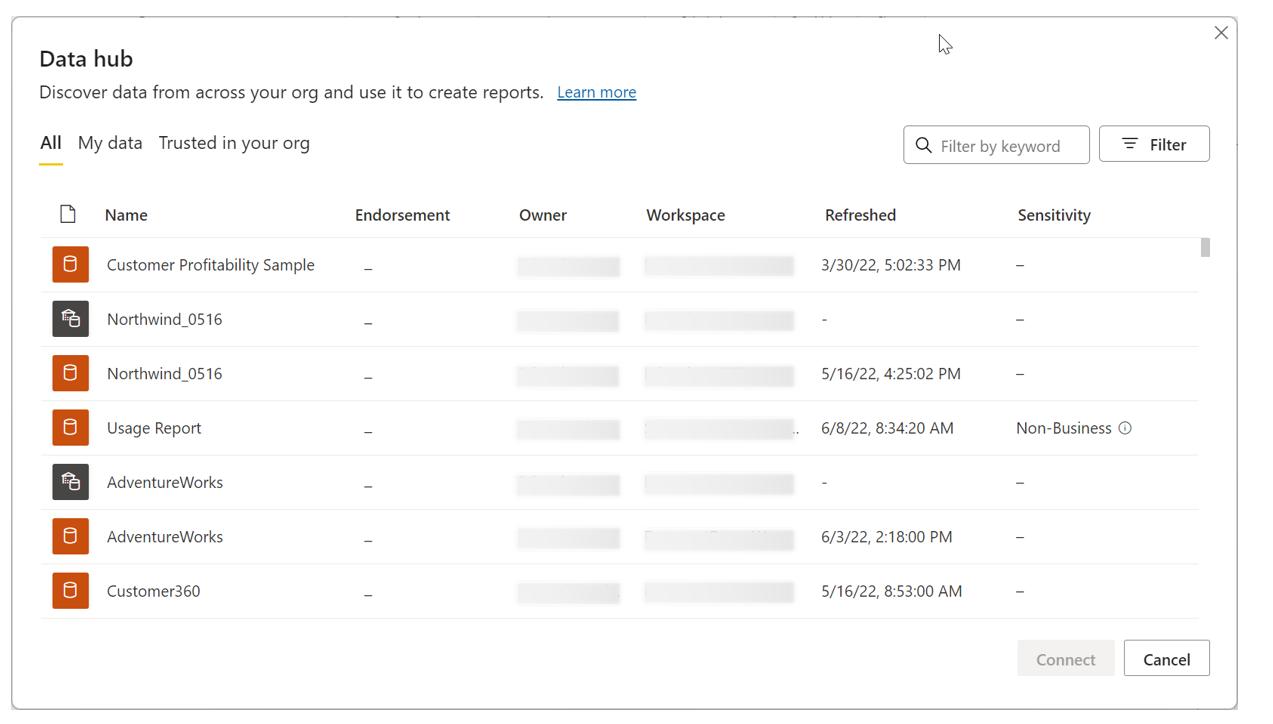
The Data Hub addresses these challenges by making it easier for users to discover existing, quality data and reuse it to answer business questions and gain insights. Once you discover a data item that seems to have the right data, a click on the item opens the data details page. On the details page you can see the following:
- metadata about the data item, including description, endorsement and sensitivity label
- actions such as share, refresh, create new, etc.
- related reports, which are reports that were built on top of the dataset.
Considering data discovery best practices, before creating new reports, you should look at the existing related reports. If there are no such reports that are suitable, there are multiple ways to create a new report:
- create a report from a template, if a template has been defined (a template is defined by adding the suffix ‘(template)’ to a report built on top of the dataset / datamart)
- create a report from scratch, to open a blank canvas and start creating your report
- auto-create a report. It should be noted that this is currently supported only for single-table datasets; moving forward, support for datasets with multiple tables will be added in due course
- create a formatted table.
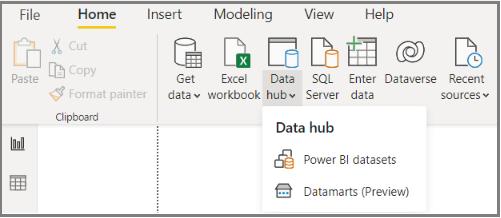
Power BI report creators primarily use Power BI Desktop to build new content and then publish it to the Power BI Service. When building new reports, instead of connecting to external data sources, the best practice is to connect to curated data available to them in Power BI.
In Power BI Desktop, just as in the Power BI Service, Microsoft would like to bring all Power BI data items into a single experience. For this reason, they have brought the Data Hub into Power BI Desktop.
With the Data Hub, users may find datasets and datamarts side by side, filter and search to find the data they need, and then connect to create a report.
Check back next week for more Power BI tips and tricks!