
Final Friday Fix: November 2019 Challenge
29 November 2019
On the final Friday of each month, we’re going to set an Excel challenge for you to puzzle over so that you can get your “Excel fix”. Challenge your office colleagues to see who can solve the puzzle quickest. There are no prizes at this stage: you’re playing for your bragging rights only!
This month’s Final Friday Fix is about creating a universal option list for the whole workbook. For this challenge, we want to create a dashboard to track the accommodation and catering services for one of our clients:
- A Dashboard worksheet shows which customer group is staying in which room and on what date
- A Catering sheet which displays the number of guests in each room and, by date, who will be using catering services. (This is simply generated by an INDEX MATCH formula from their data.
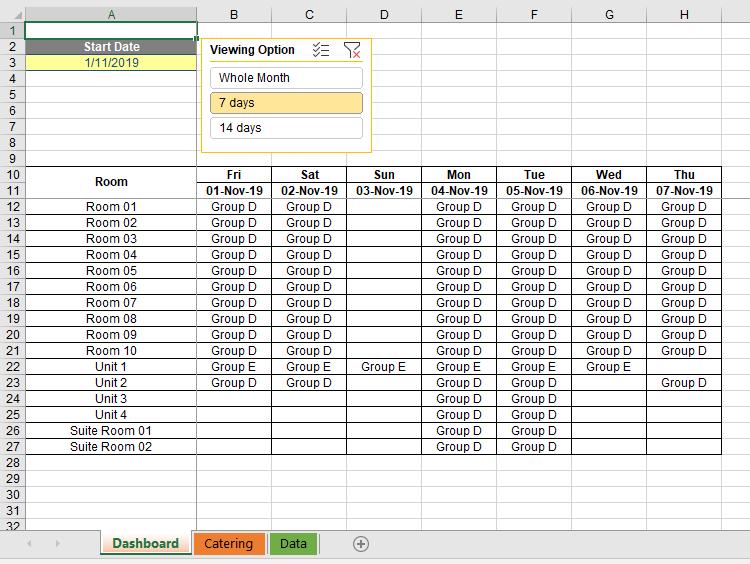
The client wants to be able to view by whole month, 14-day or 7-day in both reports at any time. Similar to the screenshot below, we just need to input the ‘Start Date’, and click on the option to view as ‘7 days’, so that the list will be generated for the whole week to see which group of customers will be coming:
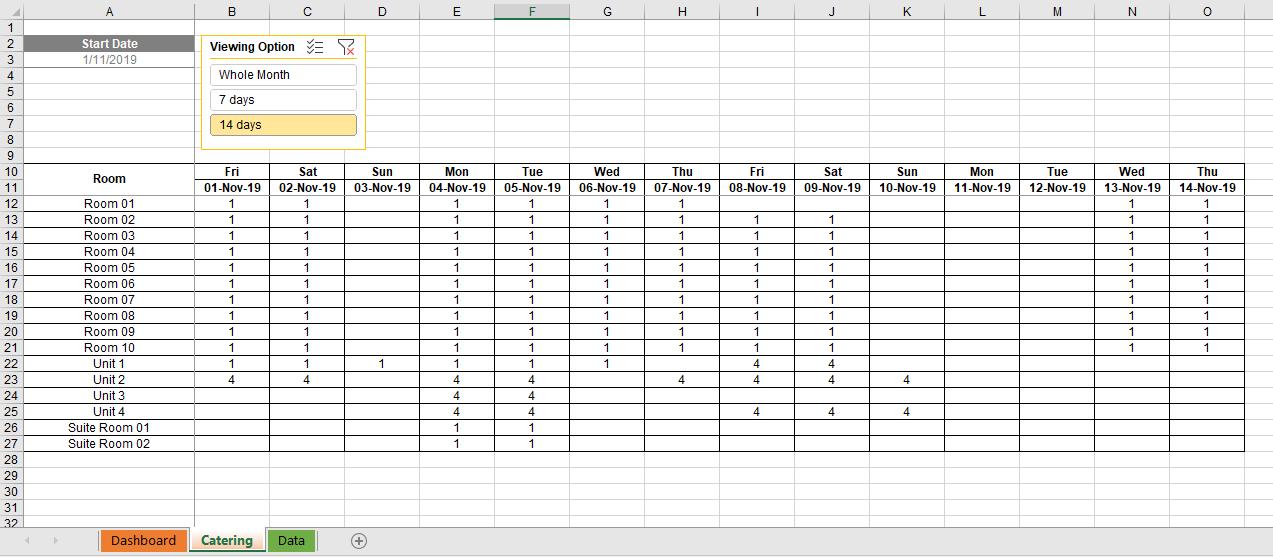
whilst in the Catering sheet, the list is also updated accordingly, so that we may see how many we need to prepare catering for:

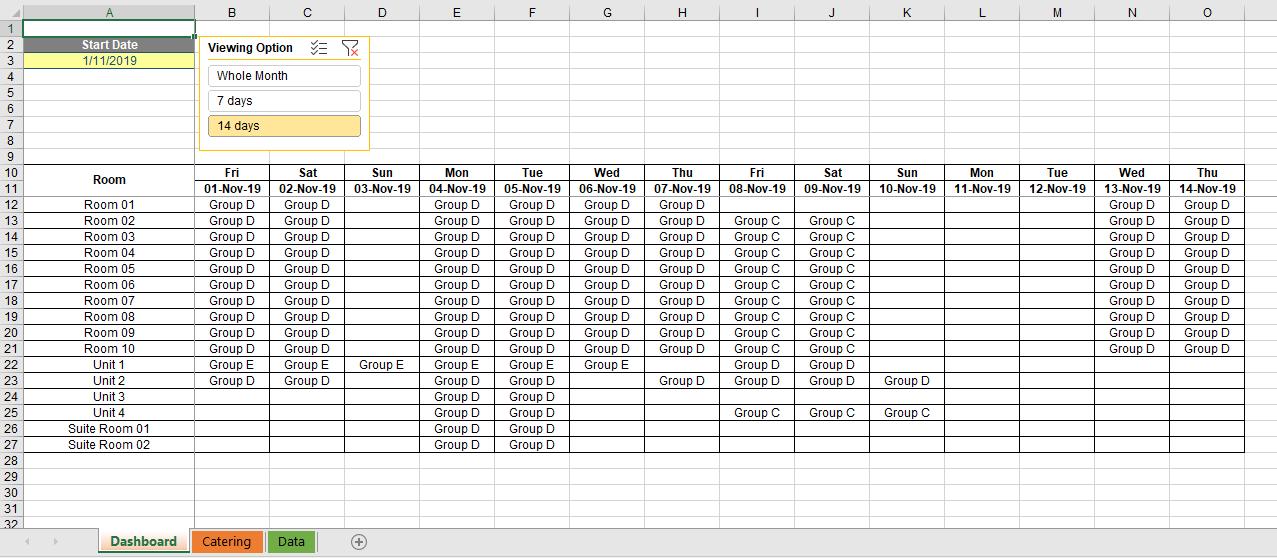
If we choose ’14 days’, the list becomes longer:
with a corresponding effect in the Catering sheet:
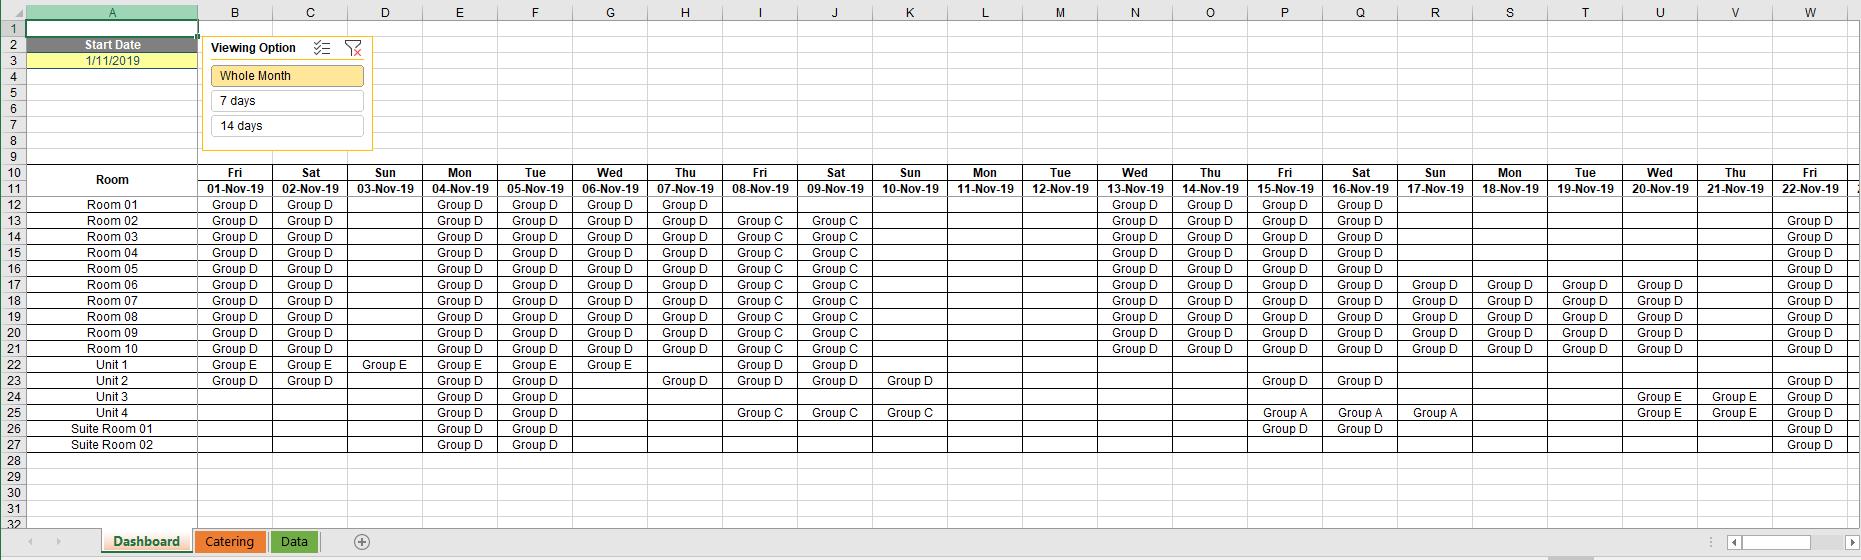
Similarly, the list will be updated for the whole month if we choose to view ‘Whole Month’:
This kind of viewing option list is like a filter, which can be applied to various problems when you work with Excel. You can use this Excel file as a starter.
Sound easy? Then why not have a go? We’ll publish one solution in Monday’s blog. Have a great weekend in the meantime!