
Monday Morning Mulling: July 2025 Challenge
28 July 2025
On the final Friday of each month, we set an Excel / Power Pivot / Power Query / Power BI problem for you to puzzle over for the weekend. On the Monday, we publish a solution. If you think there is an alternative answer, feel free to email us. We’ll feel free to ignore you.
The Challenge
Friday’s challenge revolved around The Artist Formerly Known as Power Map, which is now called 3D Maps. It started life in Excel 2013 viz.
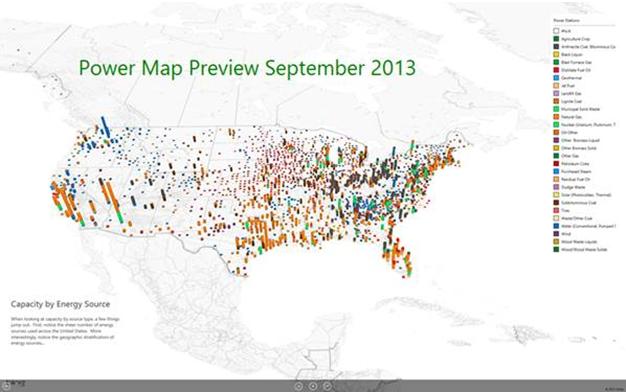
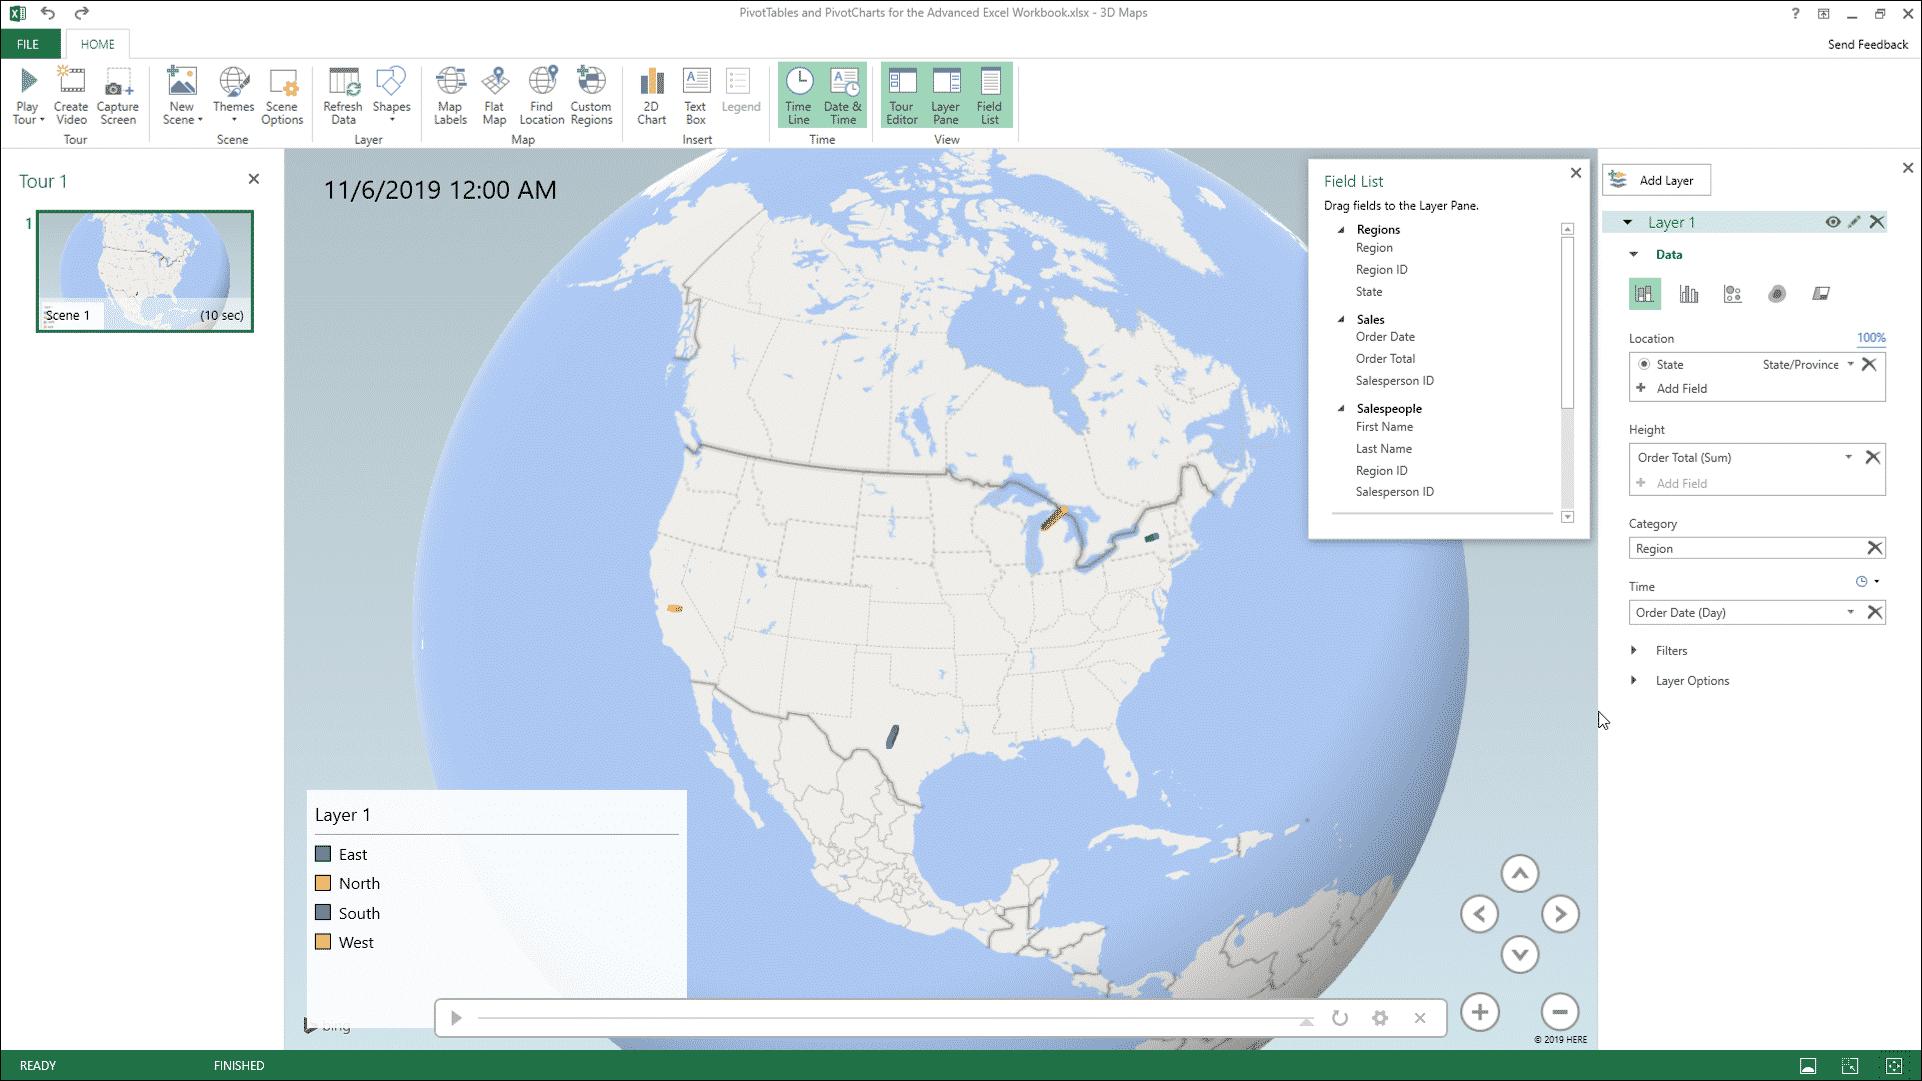
12+ years on, 3D Maps in Excel remains a great tool for visualising geographic and time series (temporal) data in a three-dimensional format, allowing you to explore data relationships and trends in a way that may be encapsulated in a video and shown in PowerPoint, for example. It plots data on a 3D globe or custom map, allowing you to see how data changes over time and to create these visual, video tours for sharing insights.
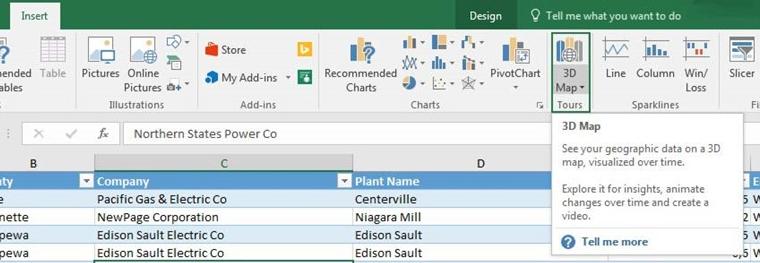
It has to be enabled as a COM add-in, whereby it usedto appear on the Insert tab of the Ribbon:
This month’s question was very simple. 3D Maps has moved! Without using your favourite search engine or AI tool, where the heck is it now..?
Solution
Not sure it’s a suggestion this month!! But did you find it without cheating?
OK, this month’s challenge doesn’t require a 30-page algorithm to solve, but given how useful 3D Maps can be, you should know where it has moved to.
First of all, ensure the COM add-in has been loaded. You can check this by going to File -> Options (ALT + F + T) and then click on ‘Add-ins’ in the left-hand column. At the bottom of the dialog, change ‘Manage:’ from ‘Excel Add-ins’ to ‘COM Add-ins’ (pictured)and then press the ‘Go’ button:
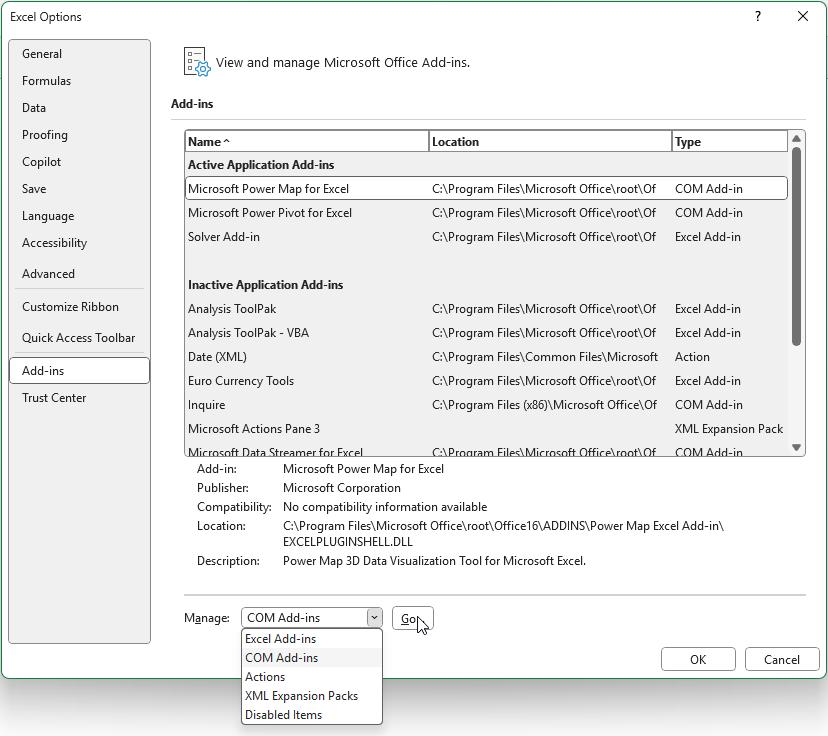
Ensure ‘Microsoft Power Map for Excel’ is checked:
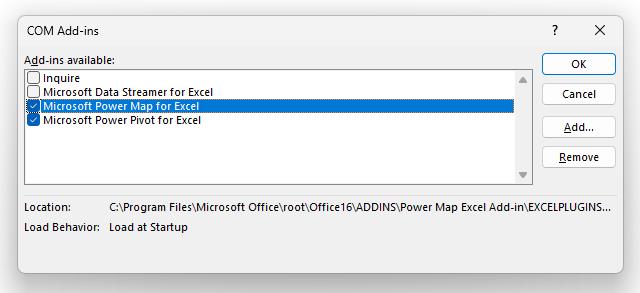
If not, check it at this stage. You may need to close and reopen Excel for the effects to take place. Thereafter, ‘3D Maps’ will be on the Ribbon – just well hidden. You will find it on the Data tab, in the ‘Data Tools’ section by clicking on the ‘Data Model’ dropdown and then selecting 3D Map -> Open 3D Maps (it’s not even sure what its name is!):
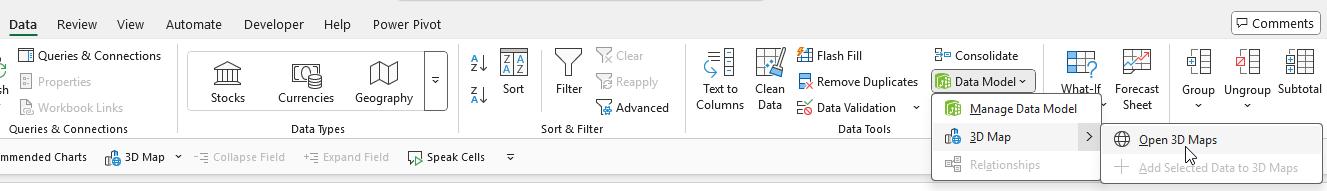
It is frustrating that such a useful feature has become buried – especially given this visualisation isn’t actually part of the Data Model. In fact, it is designed to work with and visualise data from the Excel Data Model. Microsoft argues that whilst it can also utilise data directly from Excel Tables, the Data Model provides greater flexibility and features for complex visualisations and data analysis.
The Final Friday Fix will return on Friday 29 August 2025 with a new Excel Challenge. In the meantime, please look out for the Daily Excel Tip on our home page and watch out for a new blog every business working day.