
Excel at Monopoly #3: Valuing property
31 August 2016
What do we mean by Expected Value?
Consider the basic insurance or lottery problem. Depending where you are in the world, you may want to scale these numbers appropriately!
- Should I pay $1,000 to insure my car? You shouldn’t be able to answer this yet, since I haven’t told you anything about what the car is worth, or how likely I am to get into an accident, or have it stolen.
- Should I pay $1,000 to insure my $50,000 car? More information, but it still doesn’t tell us much – if there’s only a 1% chance that it will be stolen, is it worth it?
- Should I pay $1,000 to insure my $50,000 car, when there is a 1% chance it will be stolen, and a 5% chance that I’ll make a claim that would otherwise cost me $8,000 to fix?
The more information we have on the value and the probability of the claim, the better our eventual decision. In this instance, there is a 1% chance of losing $50,000, and a 5% chance of losing $8,000. We can multiply the probabilities by the values to work out how much we might expect to lose, on average: $500 + $400 = $900. Therefore, our expected loss is $900.
How do we use this in Monopoly?
Flipping this back to our Monopoly example, we can calculate the expected value of owning any given property on the board. Let’s take, for example, Mayfair / Boardwalk. According to last week’s matrix, this property, just before Go, has a 2.61% chance of being landed on at any point in the game.
We know that it pays $50 to land on the square. 2.61% x $50 = $1.305, being the expected value that you may earn every turn. Suppose that we can own both Mayfair and Park Lane, so that we get double the rental – then the expected value would be $2.61 every turn.

We can compare this to Trafalgar Square (Illinois Avenue). Here, the probability of landing on any given turn is 3.17%, compared to a payoff of $20 if you land on it, and $40 if you own the entire red group of properties. The expected value of landing on it is 3.17% x $20 is $0.634.
We have compiled a list of probabilities and property rentals for each square on the board in this Excel file. Here, you’ll see how much each property returns, based on how developed the square is, compared with its probability of being landed on, to get your expected value. From the data, we can see that properties such as Trafalgar Square have a higher expected value than all of the Yellow properties, on account of the higher likelihood of being landed on.
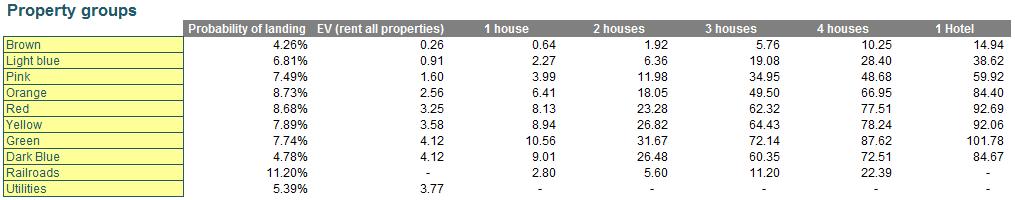
Another interesting thing it can tell us – the value of having all 4 railroads (22.39) is the rough equivalent of having 2 houses on all Red properties (23.28). If you could choose between developing hotels on Orange or hotels on Dark Blue, they would both get you roughly the same amount of cash each turn, on average (84.40 vs 84.67). Likewise, hotels on Red and Yellow are both similar as well (92.69 vs 92.06). This allows us to have a guide to the relative income generating levels of each property group.
Where to next?
So, does this give us all of our information? Certainly not – there’s one crucial bit of information that we’re missing right now: how much are we paying? Does it represent value for money? Hold on for next week, as we’ll cover that in the next episode.