
Challenges: Monday Morning Mulling: October 2019 Challenge
28 October 2019
On the final Friday of each month, we set a Power BI or Excel problem for you to puzzle over for the weekend. On the Monday, we publish a solution. If you think there is an alternative answer, feel free to email us. We’ll feel free to ignore you.
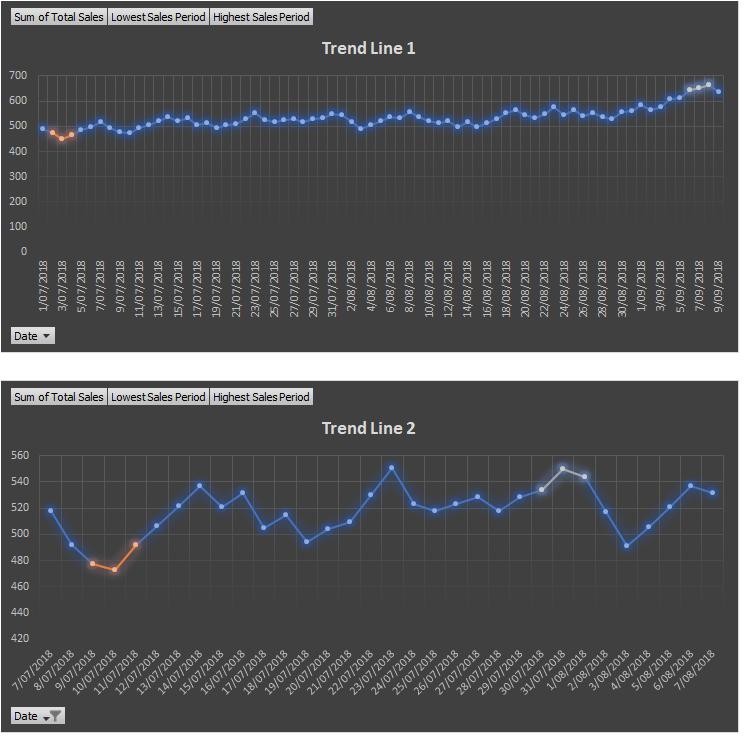
To recap, the problem we presented last week was to challenge you to paste chart objects automatically to Power Point slides without manual intervention. Essentially, we want to incorporate the charts as shown below to the Power Point slides.
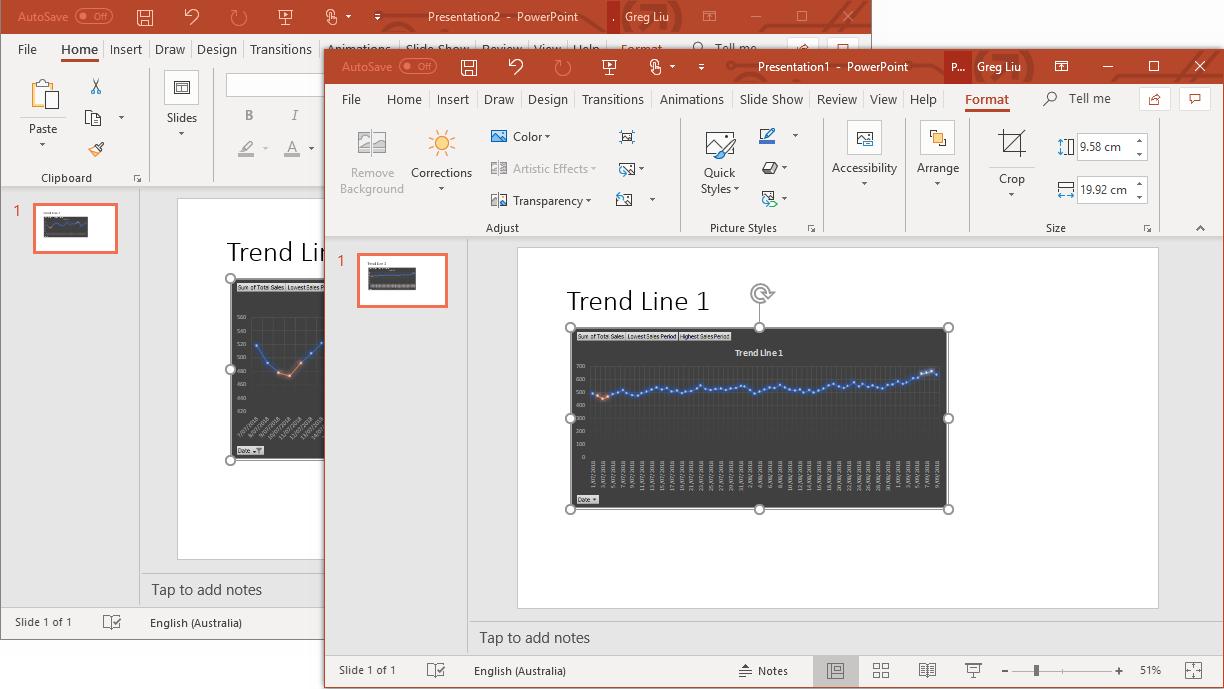
and the result would be:
Suggested Solution
One simple way here is to use VBA to introduce the Power Point module in VBA IDE and manipulate the Power Point operations automatically by coding.
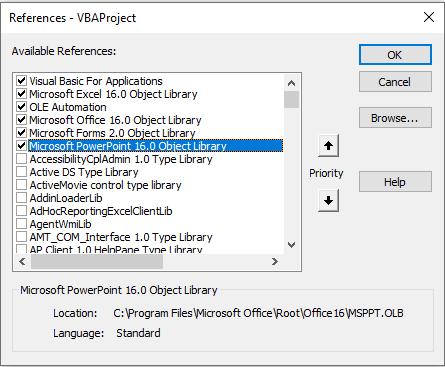
The first step is to add a reference to the Microsoft PowerPoint Library. Go to Tools in the VBA menu and click on Reference, scroll down to Microsoft PowerPoint Object Library, check the box, and press OK, as shown below:
The second step is to declare the relevant variables. For variables declared:
- PowerPoint.Application represents the entire Microsoft PowerPoint application. This object contains properties that return top-level objects such as ActivePresentation, AddIns and Presentations etc.
- PowerPoint.Slide is a collection of all the Slide objects in the specified presentation in PowerPoint
- Excel.ChartObject is a collection of charts in Excel workbook.
Dim newPP As PowerPoint.Application
Dim activeSlide As PowerPoint.Slide
Dim chartObj As Excel.ChartObject
Dim countSlides, newCountSlides As Integer
Thirdly, we assign the PowerPoint application object to variable newPP and enable the error-handling routine.
On Error Resume Next
Set newPP = GetObject(, "PowerPoint.Application")
In the fourth step, we create a new PowerPoint workbook.
If newPP Is Nothing Then
Set newPP = New PowerPoint.Application
End If
For the fourth step, we use a ‘For Loop’ to look up each chartObj in the active worksheet and create new presentation. The number of total slides is assigned to variable countSlides, and variable newCountSlides is used to determine if there are any additional slides to be added to the presentation. We then add new slides to the presentation and use the slide layout property ppLayoutText to determine the layout. Next, we select the added slide and set it as active slide, delete the second text frame and copy the chart object and paste it into the slide as a Metafile Picture. We then select the first text frame and assign the title of the chart to the text title, and adjust the position of the chart by changing the left and top attribute of ShapeRange.
For Each chartObj In ActiveSheet.ChartObjects
newPP.Presentations.Add
newPP.Visible = True
countSlides = newPP.ActivePresentation.Slides.Count
newCountSlides = countSlides + 1
newPP.ActivePresentation.Slides.Add newCountSlides, ppLayoutText
newPP.ActiveWindow.View.GotoSlide newCountSlides
Set activeSlide = newPP.ActivePresentation.Slides(newCountSlides)
activeSlide.Shapes(2).Delete
chartObj.Copy
activeSlide.Shapes(1).TextFrame.TextRange.Text = chartObj.Chart.ChartTitle.Text
activeSlide.Shapes.PasteSpecial(DataType:=ppPasteMetafilePicture).Select
newPP.ActiveWindow.Selection.ShapeRange.Left = 80
newPP.ActiveWindow.Selection.ShapeRange.Top = 120
Next
The final step is to release the object stored in variables.
Set activeSlide = Nothing
Set newPP = Nothing
Combing all the lines of code together, we get this:
Sub CreatePowerPoint()
Dim newPP As PowerPoint.Application
Dim activeSlide As PowerPoint.Slide
Dim chartObj As Excel.ChartObject
Dim countSlides, newCountSlides As Integer
On Error Resume Next
Set newPP = GetObject(, "PowerPoint.Application")
If newPP Is Nothing Then
Set newPP = New PowerPoint.Application
End If
For Each chartObj In ActiveSheet.ChartObjects
newPP.Presentations.Add
newPP.Visible = True
countSlides = newPP.ActivePresentation.Slides.Count
newCountSlides = countSlides + 1
newPP.ActivePresentation.Slides.Add newCountSlides, ppLayoutText
newPP.ActiveWindow.View.GotoSlide newCountSlides
Set activeSlide = newPP.ActivePresentation.Slides(newCountSlides)
activeSlide.Shapes(2).Delete
chartObj.Copy
activeSlide.Shapes(1).TextFrame.TextRange.Text = chartObj.Chart.ChartTitle.Text
activeSlide.Shapes.PasteSpecial(DataType:=ppPasteMetafilePicture).Select
newPP.ActiveWindow.Selection.ShapeRange.Left = 80
newPP.ActiveWindow.Selection.ShapeRange.Top = 120
Next
Set activeSlide = Nothing
Set newPP = Nothing
End Sub
By using this method, we could create PowerPoint slides, with charts required from Excel, automatically.
The Final Friday Fix will return on Friday 29th November 2019 with a new Challenge. In the meantime, please look out for the Daily Excel Tip on our home page and watch out for a new blog every business workday.