
A to Z of Excel Functions: The SERIES function
19 May 2025
Welcome back to our regular A to Z of Excel Functions blog. Today we look at the SERIES function.
The SERIES function

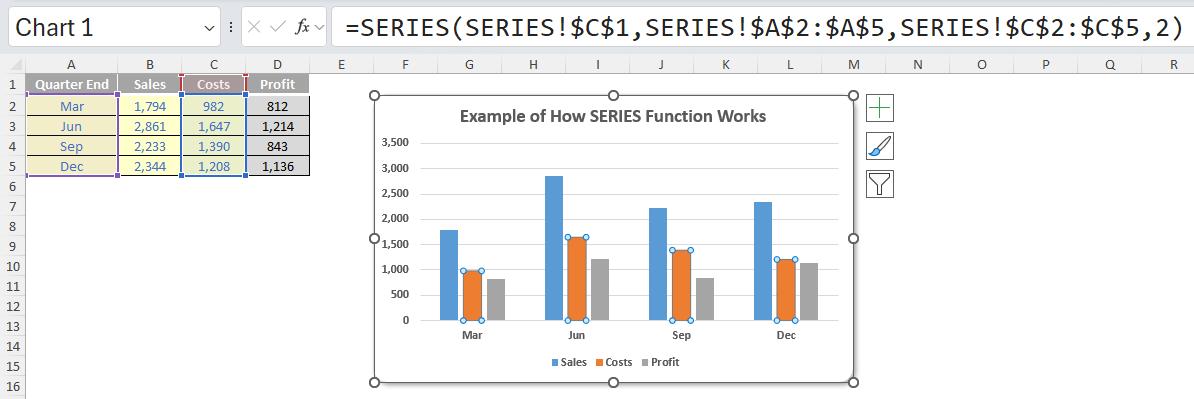
The SERIES function is an unusual beast. It is not a worksheet function, but rather one used for charting in Excel only. The SERIES function employs the following syntax to operate:
SERIES([series_name], [x_values], y_values, series_order)
The SERIES function has the following four [4] arguments:
- series_name: this is an optional argument and specifies the name of a chart series; if this optional argument is omitted, Excel will use a default name such as Series1
- x-values: this is again an optional argument and specifies the values on the category axis; if this optional argument is omitted, Excel uses 1, 2, 3, ...
- y-values: this is a required argument and represents the values on the value axis
- series_order: this argument is also required and denotes the order of the series; 1 is the first series, 2 the second etc.
You can edit the formula for existing series, but note you receive no IntelliSense prompts when doing so. Furthermore, you may add a new series by clicking in an empty part of the chart (i.e. edit it) and entering a SERIES formula with the correct arguments.
Please see my example below:
We’ll continue our A to Z of Excel Functions soon. Keep checking back – there’s a new blog post every business day.
A full page of the function articles can be found here.