
A to Z of Excel Functions: The PEARSON Function
10 July 2023
Welcome back to our regular A to Z of Excel Functions blog. Today we look at the PEARSON function.
The PEARSON function
Imagine you are attempting to understand the relationship between two variables, which are assumed to exhibit a linear relationship:

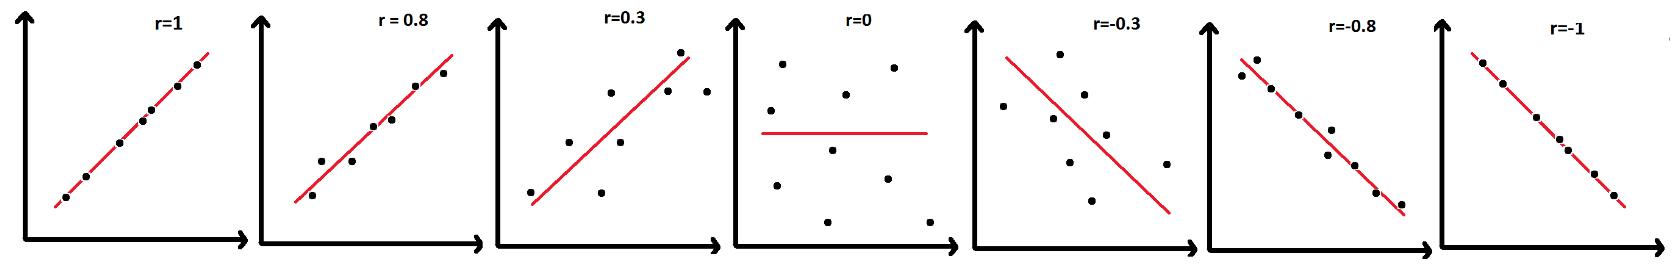
The closer the data points are to the line of best fit on a scatter graph, the stronger the correlation. This fit may be measured numerically by a correlation coefficient. There are several coefficients that may be used, but the one we shall consider here is the Pearson's Product Moment Correlation Coefficient (bizarrely denoted r), which measures the strength of the linear correlation between two variables.
Pearson's product moment correlation coefficient (sometimes known as PPMCC or PCC) is a measure of the linear relationship between two variables that have been measured on interval or ratio scales. It can only be used to measure the relationship between two variables which are both normally distributed. It is usually denoted by r, and it can only take values between -1 and +1. Its value may be interpreted as follows:

To calculate Pearson's Product Moment Correlation Coefficient, r:
- Plot the scatter diagram for your data; you have to do this first to detect any outliers. If you do not exclude these outliers in your calculation, the correlation coefficient will be misleading
- By being able to see the distribution of your data, you will get a good idea of the strength of correlation of your data before you calculate the correlation coefficient
- Next, check that your data meets all the calculation criteria. The variables need to be:
- measured
on an interval / ratio scale (like weight in kilograms or distance in
kilometres)
- Normally
distributed: you can check this by looking at a boxplot of your data. If the boxplot is approximately symmetric, it
is likely that the data will be Normally distributed
- linearly
correlated: look at a significance test of the null and alternative hypotheses.
- Finally, calculate the correlation coefficient using the following formula:
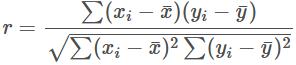
where xi and yi are the ith pair of array points and x̄ and ȳ are the means of the two arrays.
Alternatively, you can calculate this metric using
the PEARSON function in Excel. It
returns the Pearson product moment correlation coefficient, r, a
dimensionless index that ranges from -1.0 to 1.0 inclusive and reflects the
extent of a linear relationship between two data sets, as explained above.
The PEARSON function has the following syntax:
=PEARSON(array1, array2)
It contains two arguments:
- array1 which is required and represents a set of independent values
- array2 which is also required and represents a set of dependent values.
It should be noted that:
- the arguments must be either numbers or names, array constants or references that contain numbers
- if an array or reference argument contains text, logical values or empty cells, those values are ignored; however, cells with the value zero [0] are included
- if array1 and array2 are empty or have a different number of data points, PEARSON returns the #N/A error value.
Please see my example below:

We’ll continue our A to Z of Excel Functions soon. Keep checking back – there’s a new blog post every business day.
A full page of the function articles can be found here.